Oil Prices Under OPEC+ Pressure!Oil prices fell for a second consecutive session, with Brent crude down 0.6% to $67.17 a barrel and U.S. West Texas Intermediate down by the same percentage to $63.53. Investors are now looking ahead to the upcoming OPEC+ meeting early next week, amid rising expectations that producers may consider a fresh output hike for October.
This comes after the alliance had already raised its targets by about 2.2 million barrels per day between April and September, along with an additional 300,000 barrels for the UAE. At the same time, market focus is shifting to U.S. crude inventory data, particularly after the American Petroleum Institute reported an unexpected build of 622,000 barrels for the week ending August 29, compared with analyst forecasts of a nearly 2 million barrel drawdown.
From the technical side:
Crude oil is still trading in a general uptrend on the 4-hour chart, forming higher highs and higher lows. However, it is approaching a key level in the short- to medium-term at 62.95, which represents the last higher low recorded by the price. A break below this level and the formation of a lower low on the 4-hour chart would indicate a shift from the current uptrend to a renewed downtrend. On the other side, if price holds the 62.95 level and fails to form a lower low, oil could potentially target the 65.31 level.
USOUSD trade ideas

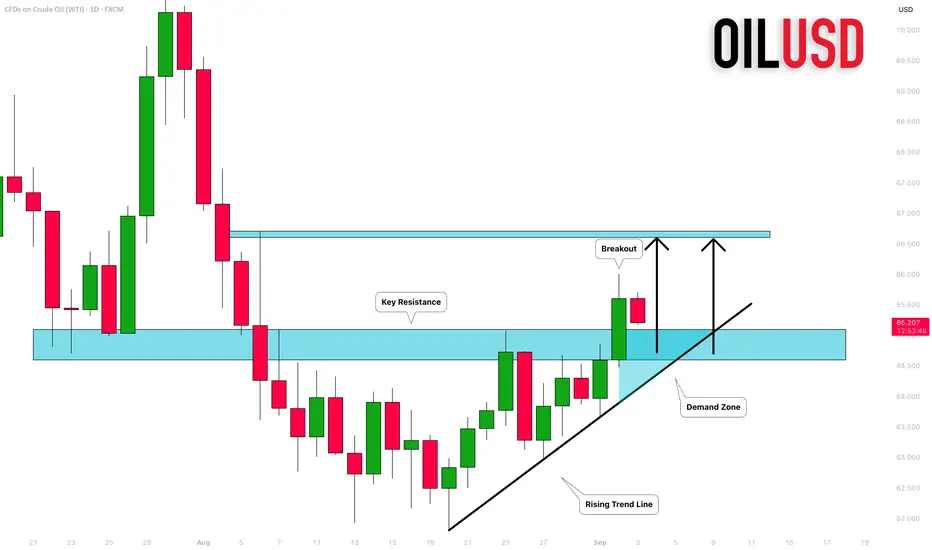
CRUDE OIL (WTI): Important Breakout!
With a strong bullish rally, WTI Crude Oil violated a significant
daily resistance cluster yesterday.
The broken structure and a rising trend line compose an important
demand zone now.
I will expect a bullish continuation from that.
Next resistance - 66.6
❤️Please, support my work with like, thank you!❤️
CRUDE OIL (WTI): Consolidation is OverFollowing a test of a significant daily support level, USOIL has been consolidating for an entire trading week.
Today's fundamental data has instilled a bullish sentiment in the market, and the price has successfully surpassed a major resistance point within its sideways movement.
It is anticipated that the market will continue to experience growth.
The next resistance level to watch is 66.72.

Bearish reversal forming at key resistance?WTI Oil (XTI/USD) is rising towards the pivot, which is an overlap resistance and could reverse to the 1st support.
Pivot: 65.82
1st Resistance: 66.80
1st Support: 63.79
Risk Warning:
Trading Forex and CFDs carries a high level of risk to your capital and you should only trade with money you can afford to lose. Trading Forex and CFDs may not be suitable for all investors, so please ensure that you fully understand the risks involved and seek independent advice if necessary.
Disclaimer:
The above opinions given constitute general market commentary, and do not constitute the opinion or advice of IC Markets or any form of personal or investment advice.
Any opinions, news, research, analyses, prices, other information, or links to third-party sites contained on this website are provided on an "as-is" basis, are intended only to be informative, is not an advice nor a recommendation, nor research, or a record of our trading prices, or an offer of, or solicitation for a transaction in any financial instrument and thus should not be treated as such. The information provided does not involve any specific investment objectives, financial situation and needs of any specific person who may receive it. Please be aware, that past performance is not a reliable indicator of future performance and/or results. Past Performance or Forward-looking scenarios based upon the reasonable beliefs of the third-party provider are not a guarantee of future performance. Actual results may differ materially from those anticipated in forward-looking or past performance statements. IC Markets makes no representation or warranty and assumes no liability as to the accuracy or completeness of the information provided, nor any loss arising from any investment based on a recommendation, forecast or any information supplied by any third-party.

USOIL BEARS WILL DOMINATE THE MARKET|SHORT
USOIL SIGNAL
Trade Direction: short
Entry Level: 65.90
Target Level: 59.95
Stop Loss: 69.84
RISK PROFILE
Risk level: medium
Suggested risk: 1%
Timeframe: 1D
Disclosure: I am part of Trade Nation's Influencer program and receive a monthly fee for using their TradingView charts in my analysis.
✅LIKE AND COMMENT MY IDEAS✅

WTI LONG SETUPPrice manage to find support strong enough to bounce the relentless fall, climb to nearest resistance is active

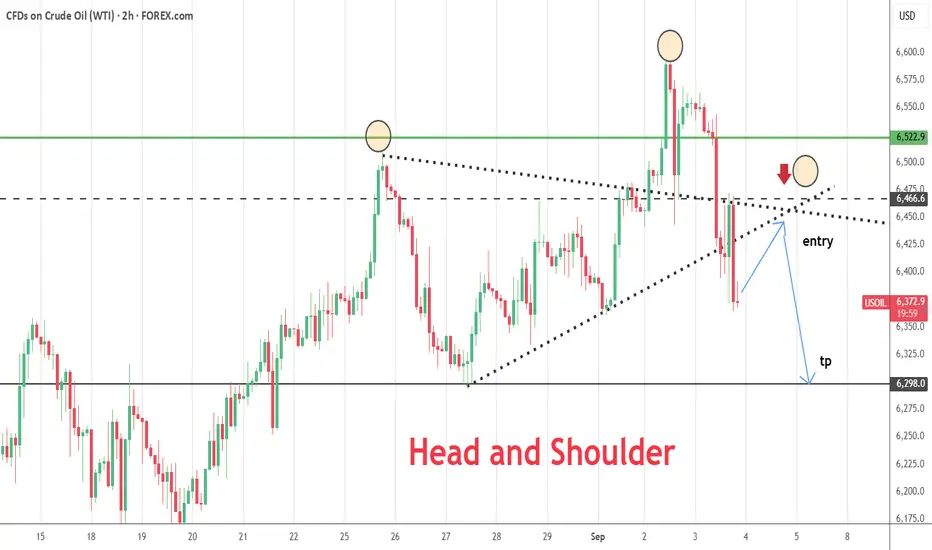
USOIL--Head and Shoulder--Head and shoulder is about to form.
--entry and tp levels are shown on chart
Brent Crude Futures Remember when Oil was $100 a barrel??? Looks like we are headed right back there.
Every 90 weeks we get a "change in trend" for Brent. This week Brent is 180 weeks down from high and 90 weeks from low. It is time for a turn. Brent was up 1.4% August 26. It is turning higher in sync with this 90-week cycle. And when you see a close above 72.65, be ready for "panic buying" and an oil shock.
But we all can use a little exercise. Time to either ride bikes, car share or SAVE and MANAGE money for Gas!!

WTI OIL 4H BUY SIGNAL WTI OIL 4H Buy Signal 🟢
After catching last week’s low and hitting $66.30 target, WTI now pulled back to the 4H MA50 inside the short-term Channel Up.
The last 3 touches = buy opportunities ✅.
If this Higher Low holds, a new bullish leg should target the 1.382 Fib extension → $66.75 🎯.
Kaizo precision. Next move loading… 🥷🔥

BUY USOILBeen a while since I last shared a trade to take, but today as you can see, the market grabbed the LQ to give us an entry point to take for a long trade.
Follow for more!

WTI Crude resistance at 6600The WTI Crude Oil is currently trading with a bearish bias, aligned with the broader downward trend. Recent price action shows a retest of the resistance, suggesting a further selling pressure within the downtrend.
Key resistance is located at 6600, a prior consolidation zone. This level will be critical in determining the next directional move.
A bearish rejection from 6600 could confirm the resumption of the downtrend, targeting the next support levels at 6200, followed by 6100 and 6000 over a longer timeframe.
Conversely, a decisive breakout and daily close above 6600 would invalidate the current bearish setup, shifting sentiment to bullish and potentially triggering a move towards 6710, then 6800.
Conclusion:
The short-term outlook remains bearish unless the pair breaks and holds above 6600. Traders should watch for price action signals around this key level to confirm direction. A rejection favours fresh downside continuation, while a breakout signals a potential trend reversal or deeper correction.
This communication is for informational purposes only and should not be viewed as any form of recommendation as to a particular course of action or as investment advice. It is not intended as an offer or solicitation for the purchase or sale of any financial instrument or as an official confirmation of any transaction. Opinions, estimates and assumptions expressed herein are made as of the date of this communication and are subject to change without notice. This communication has been prepared based upon information, including market prices, data and other information, believed to be reliable; however, Trade Nation does not warrant its completeness or accuracy. All market prices and market data contained in or attached to this communication are indicative and subject to change without notice.

WTI - Moscow's Discounts Keep Russian Oil Flowing to IndiaIndian refineries are still incentivized to buy Russian Urals oil, says Commerzbank Research's Carsten Fritsch. President Trump inflicted stiff tariffs on New Delhi--including a 25% levy for its purchases of Russian oil--but Indian Prime Minister Narendra Modi appears unwilling to bow to U.S. pressure. Meanwhile, the Kremlin cut the price of its oil in order to keep Indian customers. "This oil is being offered at a discount of $3-$4 per barrel compared to Brent for cargoes loaded at the end of September and in October," Fritsch says, citing unnamed sources. "By comparison, Indian refineries recently had to pay a premium of $3 over Brent for U.S. oil."
WTI Surges Above 65$ ResistanceCrude oil is currently supported by a combination of energy sanctions, geopolitical tensions, and rate cut expectations — with price action eyeing the $70 barrier as long as it holds above $65.20.
WTI maintained its rebound above the 61.80–62.00 support zone — aligning with the neckline of the previous inverted head and shoulders formation — and has broken above the 65 resistance level, signaling a potential continuation of bullish momentum. Daily RSI has also moved above the neutral 50 level, further confirming upside momentum.
• A clean hold above 65.20 may extend the rally toward 68.00, 69.40, and 70.40 — the next major resistance levels.
• On the downside, 62.00 and 61.80 remain key support levels. A break below them could expose oil to deeper losses toward 59.40 and 57.90.

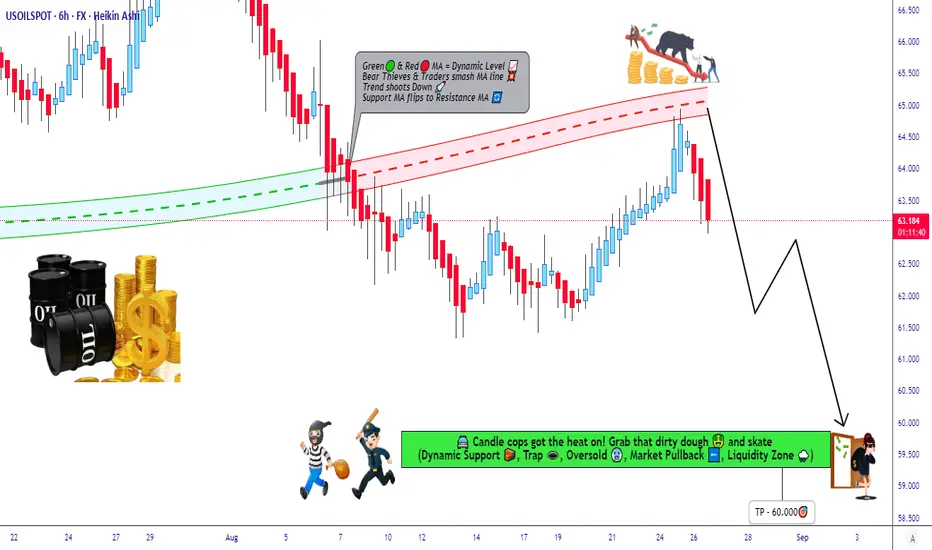
USOil Bear Trap Set: Ready For The Downside Raid?🛢️ WTI Oil Bearish Heist Plan 💣 | Thief Trader Layers Activated 🔐
💥 Welcome to the vault raid, Thief OG’s! 💥
We’re targeting US Oil Spot / WTI (XTIUSD) — and this time, the plan is pure Bearish robbery.
🚨 The Robbery Setup:
This isn’t just a sell — it’s a layered ambush. We place traps, let bulls walk in, and then we rob clean.
📌 Thief Entry Plan (Limit Layers):
Sell Limit @63.000
Sell Limit @63.500
Sell Limit @64.000
Sell Limit @64.500
👉 You can stack more layers if the vault door keeps opening.
🛑 Thief Stop Loss:
SL locked @65.500 🔒
⚠️ Adjust your SL like a true Thief — according to your risk + number of layers.
🎯 Escape Plan (Target):
🚔 Police barricade spotted around 59.000.
📌 Official Heist Exit: 60.000 — grab the loot before the cops arrive.
🧠 Thief Strategy Logic:
Multi-layer sell ambush 🏴☠️
Bearish pressure from supply + demand shifts 📊
Technical rejection zones aligning with macro weakness 📉
⚠️ Risk Management Note:
Thieves don’t rush!
👉 Place alerts before the raid.
👉 Don’t dump blind orders — wait for price to approach layers.
👉 Manage your position like a stealth operation, not a casino gamble.
💬 Thief Community Code:
Smash ❤️ & Boost if you’re with the robbery crew.
Drop your charts + sniper entries below.
We rob together. We win together. 🏆
🔔 Stay locked in — more heist plans dropping soon.
💰 Rob Smart. Trade Sharp. Exit Clean.
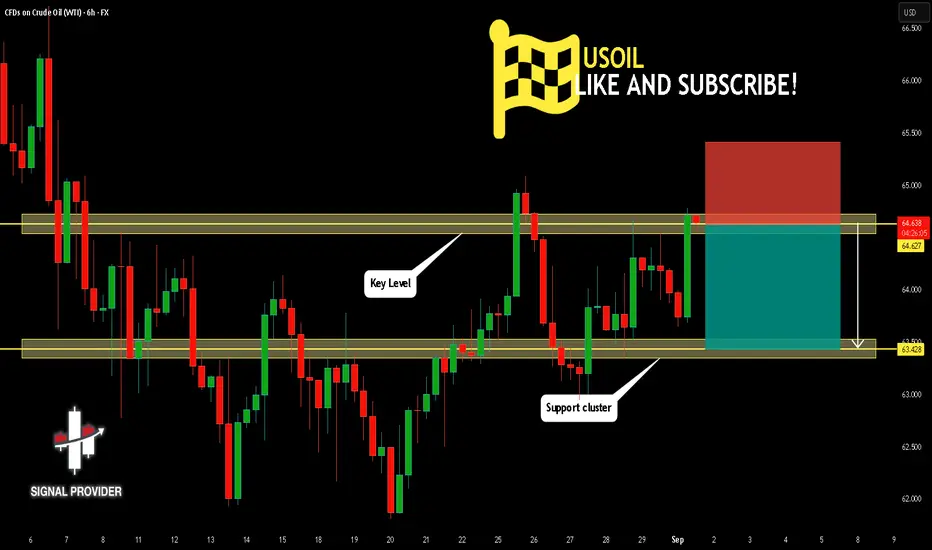
USOIL Will Go Lower! Sell!
Take a look at our analysis for USOIL.
Time Frame: 6h
Current Trend: Bearish
Sentiment: Overbought (based on 7-period RSI)
Forecast: Bearish
The market is approaching a key horizontal level 64.627.
Considering the today's price action, probabilities will be high to see a movement to 63.428.
P.S
Please, note that an oversold/overbought condition can last for a long time, and therefore being oversold/overbought doesn't mean a price rally will come soon, or at all.
Disclosure: I am part of Trade Nation's Influencer program and receive a monthly fee for using their TradingView charts in my analysis.
Like and subscribe and comment my ideas if you enjoy them!
OIL SetupClearly oil seems on the upside, according to supply and demand and price action. I took this long with seems to be a very high probability to tp.
SpotCrude Short Setup - 4h💎MJTrading
📸 Viewing Tip:
🛠️ Some layout elements may shift depending on your screen size.
🔗 View the fixed high-resolution chart here:
🛢️ PEPPERSTONE:SPOTCRUDE Short Setup – Third Tap of Falling Wedge Resistance
Pattern: Falling wedge
Context: Price is testing wedge resistance for the third time, with rejection signs
Bias: Bearish
🟢 Entry Point: 64.5
This aligns with upper boundary of the Falling Wedge (After Rejection).
❌ Stop Loss (SL): 65.5
🎯 Take Profit (TP) Levels
✅ TP1 (RR1) → 63.5
📈 TP2 → 62.5
💰 TP3 → 61.5
🧠 Trade Logic
Price is testing wedge resistance for the third time, with rejection signs
⚠️ Risk Management
Risk:Reward ratio ranges from 1:1 to 1:3, depending on TP level.
Psychology Always Matters:

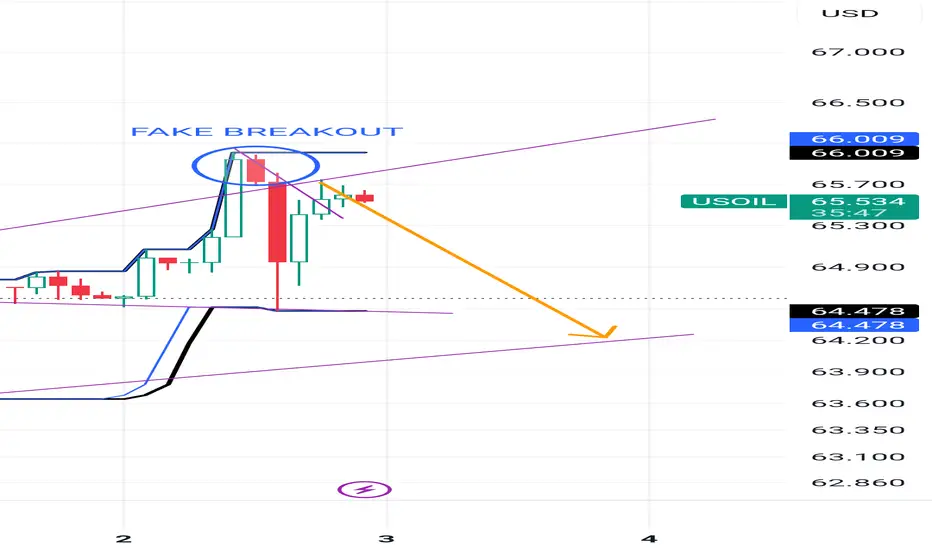
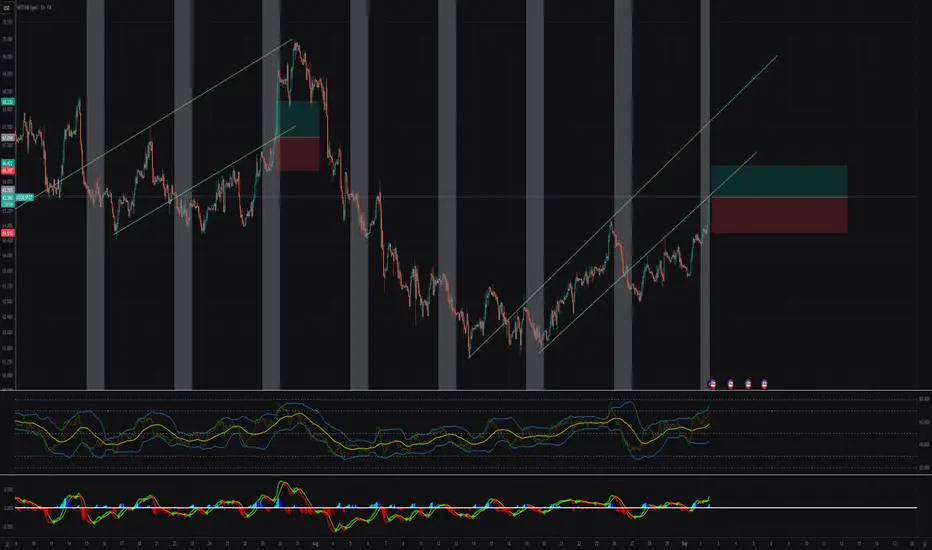
Oil: Navigating the Final Legs of a CorrectionIt looks like oil is still in the upward correction of wave ii, which should continue into next week.
This bounce can be traded using indicators and key levels for intraday setups. In this scenario, wave interpretation is of little help and can actually do more harm than good.
The diagonal that appears to be wave i is now complete, and the larger downtrend is expected to resume within the next few days.

USOIL BEARS WILL DOMINATE THE MARKET|SHORT
USOIL SIGNAL
Trade Direction: short
Entry Level: 64.00
Target Level: 62.79
Stop Loss: 64.80
RISK PROFILE
Risk level: medium
Suggested risk: 1%
Timeframe: 4h
Disclosure: I am part of Trade Nation's Influencer program and receive a monthly fee for using their TradingView charts in my analysis.
✅LIKE AND COMMENT MY IDEAS✅

WTI crude oil Wave Analysis – 2 September 2025- WTI crude oil broke the resistance level 64.00
- Likely to rise to resistance level 66.00
WTI crude oil recently broke the resistance level 64.00 intersecting with the resistance trendline of the daily Falling Wedge from June.
The breakout of the resistance level 64.00 coincided with the breakout of the 38.2% Fibonacci correction of the downward impulse i from July.
WTI crude oil can be expected to rise to the next resistance level 66.00, which is the 50% Fibonacci correction of the downward impulse i from July.

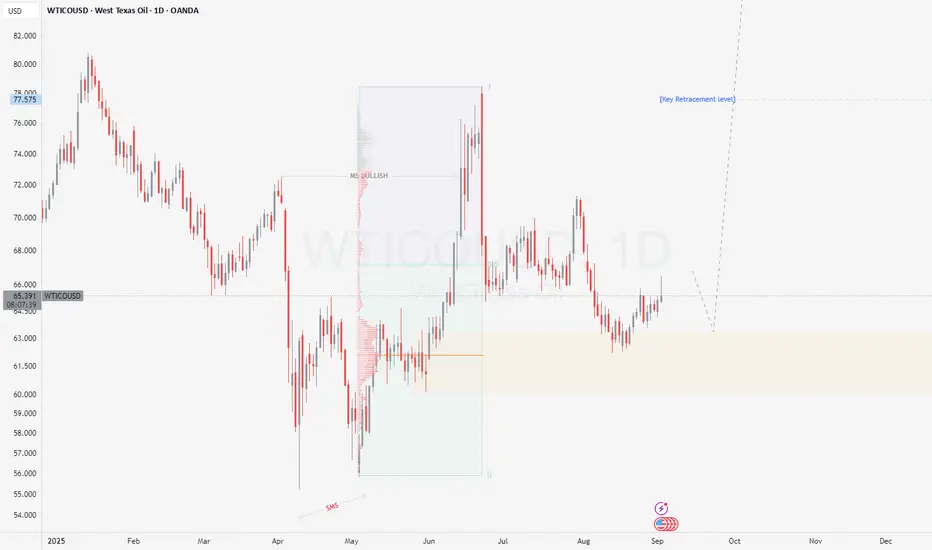
Is usoil still bullish?
Hi my dears
How are you?
Usoil seems to have the potential to move higher. I think it has the potential to reach $65.80 in the coming weeks if and only if the conditions in the picture are met.
What do you think?
Check out my analysis.

oil sell Current Assumed Position: The market appears to be completing a 4th wave correction (as a Zig-Zag pattern) within a larger impulsive trend.
Wave A (Down): Complete.
Wave B (Up): Complete. This was the counter-trend bounce.
Wave C (Down): Currently in progress. This is the final leg of the corrective pattern.
Key Guidance on the Length of Wave C:
Elliott Wave theory provides two primary guidelines for estimating the length of a C wave within a Zig-Zag:
Most Common Relationship: Wave C is often equal in length to Wave A.
This is the standard first target. Measure the price length (not time) of Wave A and project that same distance downward from the peak of Wave B.
Common Alternative: Wave C frequently extends to a length of 1.618 times the length of Wave A.
This is a very typical target if the underlying trend is strong and the C wave becomes powerful. This would be your second, deeper target.
What this means for your analysis:
Calculate the price difference (High - Low) of Wave A.
Subtract that value from the high of Wave B to find your primary target for the end of Wave C.
For a more bearish scenario, take the length of Wave A x 1.618 and subtract that from Wave B's high to find a secondary target.
Important Consideration:
Wave C must subdivide into a full 5-wave impulse itself. It cannot be a simple three-wave move. Monitor the internal structure of this decline to confirm it is developing as a 5-wave pattern, which will add confidence to this projection.
In summary: The most probable minimum length for Wave C is a decline equal to Wave A. Be prepared for a move extending to the 1.618 Fibonacci extension of Wave A.
