The US-Oil will jump from the historic Support LevelHello Traders
In This Chart US-OIL HOURLY Forex Forecast By FOREX PLANET
today US-OIL analysis 👆
🟢This Chart includes_ (US-OIL market update)
🟢What is The Next Opportunity on US-OIL Market
🟢how to Enter to the Valid Entry With Assurance Profit
This CHART is For Trader's that Want to Improve Their Technical Analysis Skills and Their Trading By Understanding How To Analyze The Market Using Multiple Timeframes and Understanding The Bigger Picture on the Charts
Trade ideas
Crude oil trading strategy for today.,Hope it is helpful to yoFactors That May Drive Up Crude Oil Prices (Bullish Logic)
1.Breakthrough in trade negotiations: If China and the United States reach a consensus at the summit to ease trade frictions, the global cargo transportation and economic outlook will improve, which may increase the demand for crude oil.
1.Unexpected geopolitical tensions: Although the Gaza conflict has ended, the situation between Russia and Ukraine remains unresolved. If further unrest breaks out in the Middle East or Eastern Europe, it may disrupt crude oil transportation. The market will worry about a shortage of oil supply, leading to a rise in oil prices.
1.Demand for technical rebound: Oil prices have dropped significantly from their previous highs, so a "short - term oversold rebound" may occur in the near future. Just like a ball bouncing back up after hitting the ground, some funds will take the opportunity to buy (and push up oil prices).
Crude Oil Trading Strategy for Today
usoil @buy57.50-58.00
pt:58.50-59
sl:57

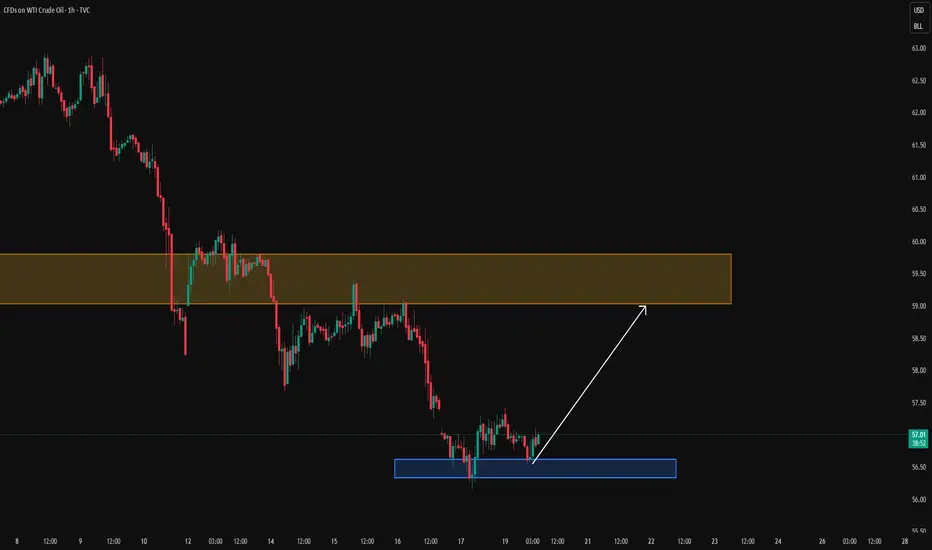
WTI Crude Oil
As shown in my previous analysis (pinned below this post), we shorted oil from the range high.
Now price has reached the range low, where two key buy levels are marked on the chart ✅.
🔹 If these levels break, the opposite scenario still stands.
🔹 We’re not in OPEC, we don’t make political or war decisions, and we don’t give orders to the market.
🔹 We are traders, simply trying to profit from opportunities.
⚡️ Remember: being biased toward your analysis = blowing up your account and losing confidence.
🎯 Always follow the market, never fight it.

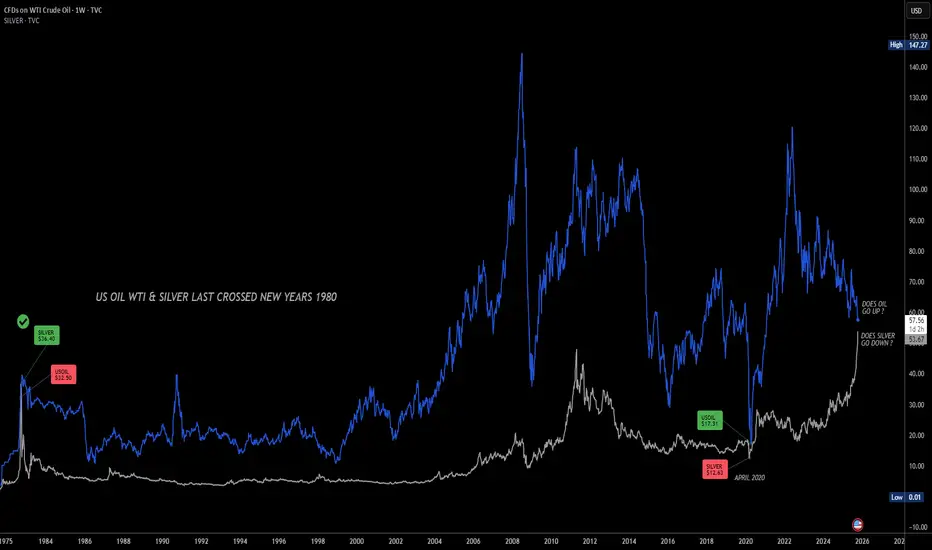
Its been a long time Silver Spot ( AMEX:USD ) has not crossed that of US Oil WTI since the first three weeks of 1980 ..and not prior going back to 1901 ~ so looking today I have to ask, does Oil go up or Silver down.. and has anyone seen a 5 year running oil deficit ?
Crude oil's trend continues to oscillate downwardCrude oil has been oscillating downward in the short term, touching 57.7. The moving average system is diverging downward and suppressing oil prices, with the objective short-term trend direction being bearish.
In the early session, oil prices rebounded from the bottom, but the momentum was relatively weak. The MACD indicator is operating below the zero line, and bearish momentum still dominates. It is expected that crude oil will mainly trade with an oscillating downward trend during the day.
Sell 58.8
TP 57.80
SL 59.40
Daily-updated accurate signals are at your disposal. If you run into any problems while trading, these signals serve as a reliable reference—don’t hesitate to use them! I truly hope they bring you significant assistance

XTIUSD crossed the rtrendline LONGFinally the XTIUSD croosed the trendline and price moved above cloud and long can be entred now with target 60 and 60.5 with Fib level of 0.5 and 0.635 level.

USOIL Can Rise Higher (Swing Trade Opportunity)USOIL Can Rise Higher (Swing Trade Opportunity): OIL has been falling hard in the recent weeks. One of the reasons was the sub sector rotation. Most funds were being routed from energy to precious metals. Now OIL has completed and M pattern, which means that it can start to rise. So far this has showed a little upward movement which is not a sign of strength but rather an initial invite to the buyers.
Lets see if it gains momentum and becomes substantial.
Not a trade advice as usual.
Follow this channel and switch the notifications on for more. Please support this analysis by liking, commenting, and sharing with friends, colleagues, traders, and trading communities. Thanks👍🙂

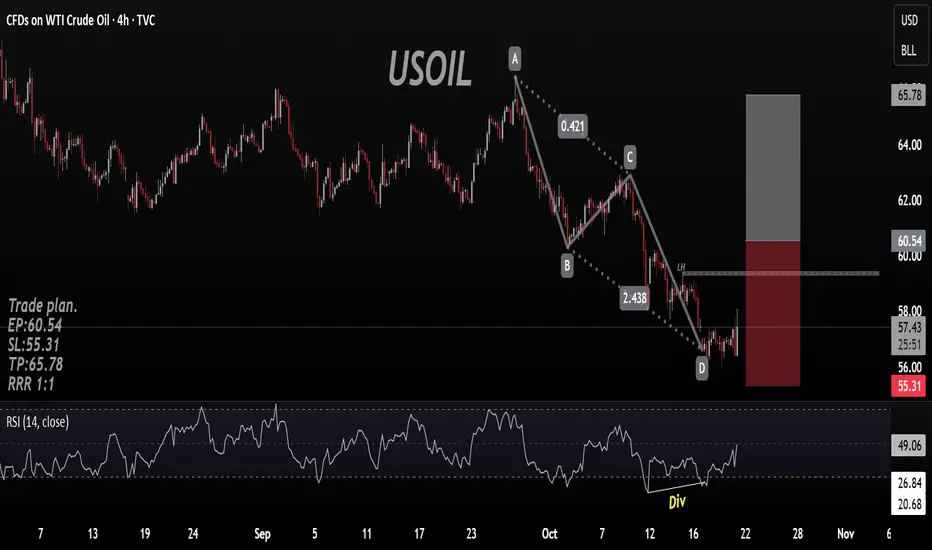
AB=CD Reversal Pattren on USOIL AB=CD reversal pattren with Divergence on Rsi.
Bias Long
Trade plan.
EP:60.54
SL:55.31
TP:65.78
RRR 1:1
WTI bullish swing setupRSI divergence
Bullish chart pattern
Wait for trend reversal
red line is previous major level
Entry on trend reversal
RRR 1:2

USOIL: Buy setups during higher-timeframe correctionOIL PRICE WEEKLY OUTLOOK
(Week of Oct 20-24, 2025)
Key Drivers & Risks
Updates in Supply, Demand, and Geopolitical News
EIA (week ending Oct 10): Crude inventories +3.5 million bbl; distillates −4.5 million bbl.
IEA OMR (Oct 2025): Upgraded global supply forecast: +3.0 mb/d in 2025 and +2.4 mb/d in 2026, while demand grows only ~0.7 mb/d per year ⇒ signaling a large surplus risk and downward pressure on prices.
OPEC (Oct 2025): Maintains demand growth outlook of +1.3 mb/d for 2025, but acknowledges a smaller deficit in 2026 as OPEC+ output rises; September production increased by ~630 kb/d.
Maritime risk in the Red Sea / Gulf of Aden: Over the weekend, a gas carrier reportedly caught fire following a possible attack off Yemen’s coast, leading to higher shipping risk premiums, though no major disruption to trade flows has been reported yet.
Watchlist for the Week Ahead
EIA Weekly Report (Oct 22): Focus on crude and distillate inventories, and any signs of policy or flow adjustments.
Maritime security updates in the Red Sea / Gulf of Aden / Strait of Hormuz — monitor frequency and severity of incidents.
China data: imports, refinery runs, and inventories — potential signals of stockpiling at lower price levels.
Any notable demand-side surprises (if any emerge).
Overall View
Oil prices are expected to gradually decline within a relatively narrow range of $70–$50 through mid-2026.
Short-term rebounds may occur due to low price levels and heightened transport risk headlines.
China’s potential restocking activity could provide limited demand-side support.
* Trend: assessed using at least three trend indicators, with market structure as the primary guide.
** Weak or Reversal Signals: Assessed based on one of our criteria for trend reversal signals.
*** Support/Resistance: Selected from multiple factors – static (Swing High, Swing Low, etc.), dynamic (EMA, MA, etc.), psychological (Fibonacci, RSI, etc.) – and determined based on the trader’s discretion.
**** Our advice takes into account all factors, including both fundamental and technical analysis. It is not intended as a profit target. We hope it can serve as a reference to help you trade more effectively. This advice is for informational purposes only and we assume no responsibility for any trading results based on it.
George Vann @ ZuperView
Crude oil -DAILY- 20/10/2025Oil prices fell after a third straight weekly decline as traders reacted to easing U.S.–China trade tensions pushing WTI toward $56 a barrel amid optimism over upcoming trade talks. China’s economy slowed for a second consecutive quarter, though Beijing maintained its 5% growth target. Oil futures are heading for a third monthly loss, pressured by an expected supply surplus through 2026, according to the IEA. Trump said he plans a second meeting with Putin to discuss ending the war in Ukraine, though prior talks have achieved little. Citigroup warned that any de-escalation could push oil toward $50 a barrel. Market indicators suggest weakness, with near-term spreads narrowing and longer-term contracts shifting into bearish contango.
On the technical side, crude oil price has extended its aggressive bearish trend last week with no major signs of reversing. Apart from the extreme oversold Stochastic oscillator there are no other signs of a bullish correction. The faster 50-day simple moving average is trading below the slower 100-day simple moving average validating the overall bearish trend in the market while the Bollinger Bands are quite expanded showing that there is increased volatility in the market for crude oil hinting that there is potential for sharp moves in the upcoming sessions. Eventhough, the area of $62 is the major technical resistance level, it seems that it might need some time to retest this level. The lower band of the Bollinger Bands seems to be the first level of technical support for the price while the area of $56 might pose some support since its the multiyear low which was last tested in early May 2025.
Disclaimer: The opinions in this article are personal to the writer and do not reflect those of Exness

USOIL BULLS ARE STRONG HERE|LONG
USOIL SIGNAL
Trade Direction: short
Entry Level: 57.23
Target Level: 59.72
Stop Loss: 55.57
RISK PROFILE
Risk level: medium
Suggested risk: 1%
Timeframe: 12h
Disclosure: I am part of Trade Nation's Influencer program and receive a monthly fee for using their TradingView charts in my analysis.
✅LIKE AND COMMENT MY IDEAS✅

WTI to $55 amid excess supply concerns?There was some relief at the start of the week for oil prices as traders reacted to the weekend news of de-escalation in the trade war between the US and China and figured that a potential extension of the tariff truce would be net positive for the demand outlook. However, the recovery stalled as WTI prices couldn’t break above $60 per barrel and have since turned flat on the week. The bearish trend thus remains intact for oil. Here, investors are concerned about the excess supply of the stuff hitting the markets, as the OPEC+ is gradually releasing some withheld oil supplies to win back market share. The group’s plan is to increase production by a total of 1.65 million barrels per day by the end of 2025. It has already increased output by 137K bpd from October. Against a backdrop of increasing supplies, it looks like WTI is heading towards the April lows of around $55.00 again.
By Fawad Razaqzada, market analyst with FOREX.com

WTI Crude Oil range trading support at 5747The WTI Crude Oil is currently trading with a bearish bias, aligned with the broader downward trend. Recent price action shows a retest of the longer term support, suggesting a temporary relief rally within the downtrend.
Key resistance is located at 6030, a prior consolidation zone. This level will be critical in determining the next directional move.
A bearish rejection from 6030 could confirm the resumption of the downtrend, targeting the next support levels at 5747, followed by 5677 and 5606 over a longer timeframe.
Conversely, a decisive breakout and daily close above 6030 would invalidate the current bearish setup, shifting sentiment to bullish and potentially triggering a move towards 6073, then 6170.
Conclusion:
The short-term outlook remains bearish unless the WTI Crude price breaks and holds above 6030. Traders should watch for price action signals around this key level to confirm direction. A rejection favours fresh downside continuation, while a breakout signals a potential trend reversal or deeper correction.
This communication is for informational purposes only and should not be viewed as any form of recommendation as to a particular course of action or as investment advice. It is not intended as an offer or solicitation for the purchase or sale of any financial instrument or as an official confirmation of any transaction. Opinions, estimates and assumptions expressed herein are made as of the date of this communication and are subject to change without notice. This communication has been prepared based upon information, including market prices, data and other information, believed to be reliable; however, Trade Nation does not warrant its completeness or accuracy. All market prices and market data contained in or attached to this communication are indicative and subject to change without notice.

Crude OilCrude Oil best buy aera from $52 and 2nd area is $49 this is my technical analysis. Take entry on your own risk. Thanks

WTI Crude oversold bounce capped at 6030 resistanceThe WTI Crude Oil is currently trading with a bearish bias, aligned with the broader downward trend. Recent price action shows a retest of the longer term support, suggesting a temporary relief rally within the downtrend.
Key resistance is located at 6030, a prior consolidation zone. This level will be critical in determining the next directional move.
A bearish rejection from 6030 could confirm the resumption of the downtrend, targeting the next support levels at 5747, followed by 5677 and 5606 over a longer timeframe.
Conversely, a decisive breakout and daily close above 6030 would invalidate the current bearish setup, shifting sentiment to bullish and potentially triggering a move towards 6073, then 6170.
Conclusion:
The short-term outlook remains bearish unless the WTI Crude price breaks and holds above 6030. Traders should watch for price action signals around this key level to confirm direction. A rejection favours fresh downside continuation, while a breakout signals a potential trend reversal or deeper correction.
This communication is for informational purposes only and should not be viewed as any form of recommendation as to a particular course of action or as investment advice. It is not intended as an offer or solicitation for the purchase or sale of any financial instrument or as an official confirmation of any transaction. Opinions, estimates and assumptions expressed herein are made as of the date of this communication and are subject to change without notice. This communication has been prepared based upon information, including market prices, data and other information, believed to be reliable; however, Trade Nation does not warrant its completeness or accuracy. All market prices and market data contained in or attached to this communication are indicative and subject to change without notice.

US OIL SUPPORT, RESISTANCE & TRENDLINE ANALYSISThe market is sideways kindly save your capital yall.
Go "long" if it breaks the trendline and 57.45 and aim for 57.80 and 58.14 and if it breaks 58.37 then we might see a good move upside.
Go "Short" if it breaks below 57.12 and breaking the trendline as well will lead to 56.77 and 56.43.
Good Night!!

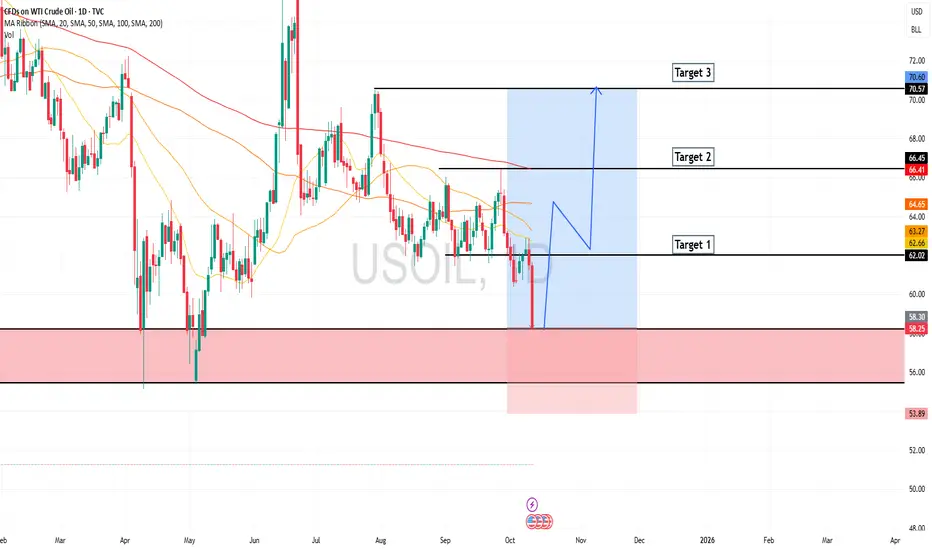
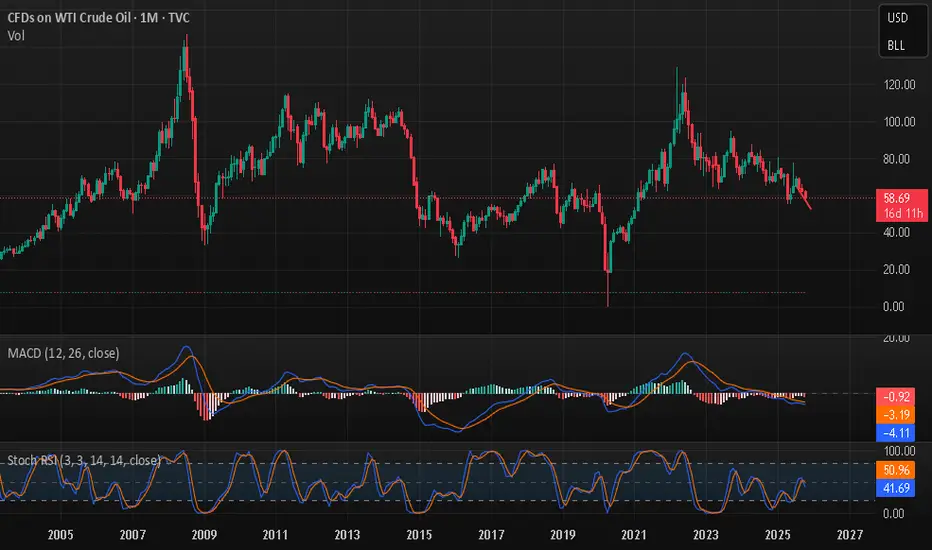
Why Oil’s Drop Fuels a Global Risk-Off SentimentWTI Crude Oil Monthly Technical Outlook: Below $60 and the Broader Market Implications
As the fourth quarter of 2025 unfolds, the WTI Crude Oil (USOIL) chart offers a critical perspective on the state of global supply-demand balance and its broader impact on market sentiment. Trading near $58.5 per barrel, oil prices have fallen below a key psychological threshold, and while the move may seem technical at first, its implications reach far beyond the energy market.
The combination of weakening momentum indicators, rising supply projections, and softening global demand paints a nuanced but important story: oil’s slide below $60 is no longer just a chart event, it’s a macro signal about global growth, supply dynamics, and investor positioning.
Technical Overview: Momentum Loss Deepens
The monthly chart for WTI shows a clear picture of fatigue after multiple failed rebound attempts over the past 18 months. Since peaking near $130 in early 2022, prices have formed a persistent pattern of lower highs and lower lows, reflecting an extended process of distribution.
In recent months, WTI has failed to sustain moves above $70, with sellers consistently stepping in on rallies. The October bar extended losses toward the $58 level, marking the weakest monthly close since mid-2023.
Structurally, this decline puts WTI in a critical support zone between $55 and $57, which coincides with the base that previously stabilized prices in late 2023. Should this zone fail, the next major support rests around $50 per barrel, aligning with a key Fibonacci retracement of the 2020–2022 rally.
On the upside, the resistance band remains in the $65–$68 range, a descending trendline that has capped every rebound since early 2024. A decisive monthly close above that zone would be the first confirmation of renewed strength, but momentum indicators are still leaning toward continued weakness or sideways consolidation.
MACD and Stochastic RSI: Weakening Momentum Signals
The MACD (12,26,9) indicator remains subdued below the zero line, underscoring a prolonged loss of upside momentum. The histogram has recently turned red again, indicating that the MACD line may cross below the signal line, a potential confirmation that sellers still control the trend.
Meanwhile, the Stochastic RSI, which measures RSI velocity, has rolled over from midrange levels and is pointing lower again. Its failure to sustain a rebound above 50 shows that bullish energy has faded.
If this oscillator drops below 30, it would confirm a continuation of weak-to-neutral price action through the rest of Q4. Historically, such conditions precede prolonged consolidation phases, where volatility contracts before a new trend forms.
Together, these indicators portray a market not in full capitulation, but clearly lacking conviction for an upside breakout.
Fundamental Picture: Oversupply Meets Slowing Demand
While technical signals reveal a loss of momentum, the fundamental backdrop provides stronger clues about why oil has struggled to maintain value above $60. Recent data from major energy agencies, including the International Energy Agency (IEA), the U.S. Energy Information Administration (EIA), and multiple Reuters reports, converge on one central theme:
the global oil market is entering a surplus phase, with supply growth outpacing demand.
Large Oversupply Projections
Read full analysis on my website
darrismanresearch com
USOIL towardws range 185-250 $Looking at long term chart we can see usoil is competing the descending cycle, 2nd wave (1st corrective) started from 130$ peak.
In my view the bottom could be 50.3$ area where I think bullish trend will resum and wave #3 will start to 1st target 185$ area.
Final targetpoint could be 250$ area

XTIUSD possible pullback set up Long The oil price fallen drastically and now price has crossed the trendline but has not crossed the cloud , price within the cloud and possibly may break resistance . Since it’s at support you can buy with very small stop loss .

Hellena | Oil (4H): SHORT to support area of 58.884Colleagues, it appears that the downward movement is not over and I see several reasons to continue to look short.
The higher order wave “C” is looking to complete the correction and I expect the start of the middle order wave “3” to see the low update and reach the support area at 58.884.
Fundamental context
Oil remains under pressure as supply increases and demand outlook weakens. OPEC+ decided to slightly raise output for November, while U.S. inventories keep growing. Crude lost about 8% last week, and EIA now expects lower prices by the end of the year — all of which supports the idea of a continued downside move within wave “3” toward the 58.884 support area.
Manage your capital correctly and competently! Only enter trades based on reliable patterns!

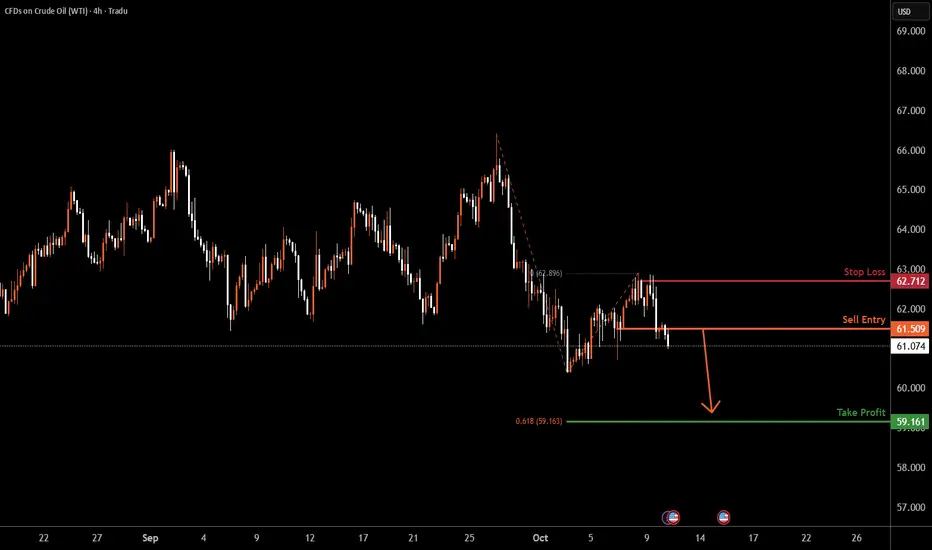
USOIL H4 | Bearish Drop OffUSOIL is reacting off the sell entry, which is a pullback resistance and could drop from this level to the downside.
Sell entry is at 61.50, which is a pullback resistance.
Stop loss is at 62.71, which is a pullback resistance.
Take profit is at 59.16, which lines up with the 161.8% Fibonacci extension.
High Risk Investment Warning
Trading Forex/CFDs on margin carries a high level of risk and may not be suitable for all investors. Leverage can work against you.
Stratos Markets Limited (tradu.com ):
CFDs are complex instruments and come with a high risk of losing money rapidly due to leverage. 65% of retail investor accounts lose money when trading CFDs with this provider. You should consider whether you understand how CFDs work and whether you can afford to take the high risk of losing your money.
Stratos Europe Ltd (tradu.com ):
CFDs are complex instruments and come with a high risk of losing money rapidly due to leverage. 66% of retail investor accounts lose money when trading CFDs with this provider. You should consider whether you understand how CFDs work and whether you can afford to take the high risk of losing your money.
Stratos Global LLC (tradu.com ):
Losses can exceed deposits.
Please be advised that the information presented on TradingView is provided to Tradu (‘Company’, ‘we’) by a third-party provider (‘TFA Global Pte Ltd’). Please be reminded that you are solely responsible for the trading decisions on your account. There is a very high degree of risk involved in trading. Any information and/or content is intended entirely for research, educational and informational purposes only and does not constitute investment or consultation advice or investment strategy. The information is not tailored to the investment needs of any specific person and therefore does not involve a consideration of any of the investment objectives, financial situation or needs of any viewer that may receive it. Kindly also note that past performance is not a reliable indicator of future results. Actual results may differ materially from those anticipated in forward-looking or past performance statements. We assume no liability as to the accuracy or completeness of any of the information and/or content provided herein and the Company cannot be held responsible for any omission, mistake nor for any loss or damage including without limitation to any loss of profit which may arise from reliance on any information supplied by TFA Global Pte Ltd.
The speaker(s) is neither an employee, agent nor representative of Tradu and is therefore acting independently. The opinions given are their own, constitute general market commentary, and do not constitute the opinion or advice of Tradu or any form of personal or investment advice. Tradu neither endorses nor guarantees offerings of third-party speakers, nor is Tradu responsible for the content, veracity or opinions of third-party speakers, presenters or participants.
USOIL Struggles to Hold Gains, Bearish Trend Intact
Current market sentiment is bearish.
USOIL is struggling to hold above resistance and leaning towards support.
USOIL is trading at $63.76, below the mid-Bollinger band → showing weak momentum.
Price failed to hold above $66–68 resistance zone and is now trending lower.
Price is leaning towards the lower band, suggesting bearish continuation risk.
