USOIL WILL FALL|SHORT|
✅CRUDE OIL/b] after engineering liquidity above the recent high, price reacted sharply from the 4H supply area, suggesting distribution by institutional players. With buy-side liquidity swept, the market now looks poised to rebalance inefficiency below the $61 handle. Time Frame 4H.
SHORT🔥
✅Like and subscribe to never miss a new idea!✅
Trade ideas

USOIL Market Direction: Bearish Tilt Amid Downward Momentum?USOIL Market Direction: Bearish Tilt Amid Downward Momentum?
Current Price Snapshot
As of October 15, 2025, USOIL (WTI Crude Oil) is trading around $58.20 per barrel, reflecting a modest intraday uptick of approximately 0.9% from yesterday's close at $58.66. This follows a 1.39% decline on October 14, extending a broader monthly drop of over 7%. The price has been consolidating in a descending channel, with recent lows testing the $57.29–$57.60 support zone, prompting a short-term corrective bounce.
Technical Indicators
- **Trend Structure**: USOIL remains below a key descending trendline on shorter timeframes (H1–H4), signaling sustained downward pressure. A breakdown below $57.65 could accelerate the slide toward $56.00 or lower, aligning with a potential descending flag pattern.
- **Momentum Oscillators**: The RSI (14-period) is climbing from oversold territory around 31, currently near 35–40, suggesting a temporary relief rally but lacking conviction for a full reversal. The ADX at 41.78 confirms a strong prevailing downtrend.
- **Moving Averages**: Price is below the 50-day SMA ($61.55) and 200-day EMA ($59.15), with bearish crossovers reinforcing the negative bias. Key resistance clusters at $60.44–$60.75 (Fibonacci retracement levels) cap upside potential.
- **Support/Resistance**: Immediate support at $57.29–$57.80; breach targets $56.00. Overhead resistance at $60.75, with a pivot at $61.50. A close above $60.75 would invalidate the bearish setup, but current action shows rejection at these levels.
Fundamental Drivers
- **Supply Dynamics**: OPEC+ is gradually unwinding production cuts, adding ~0.6 million barrels per day (b/d) in 2025, while non-OPEC output (led by the US at 13.5 million b/d) surges by 2.0 million b/d. This floods the market, driving global inventories higher and exerting downward force on prices. Recent US inventory builds (e.g., +1.8 million barrels in commercial crude) further signal softening demand.
- **Demand Outlook**: Resurfacing US-China trade tensions are clouding economic recovery prospects, capping industrial fuel needs. Global growth slowdowns, coupled with accelerated renewable energy investments, are projected to weaken crude consumption through 2026.
- **Geopolitical Factors**: While sanctions on Russia and Middle East risks provide occasional support, they are outweighed by ample supply. EIA forecasts Brent (closely correlated to WTI) averaging $62/bbl in Q4 2025, dropping to $52/bbl in 2026, implying further WTI weakness toward $56–$59 by year-end.
- **Macro Influences**: A strengthening USD (amid Fed hawkishness) makes oil less attractive to non-US buyers, adding to the bearish case. Broader forecasts from Reuters and LongForecast see WTI averaging $64.65 for 2025 but ending October near $52.76, a 15.5% monthly decline.
Sentiment from Market Chatter
Real-time discussions on platforms like X highlight mixed but predominantly cautious views. Some traders eye short-covering bounces toward $60, citing oversold RSI and potential OPEC data surprises, but consensus leans bearish, with calls for sub-$60 targets due to inventory builds and trade war fears. Retail signals show sporadic buy setups, but institutional positioning favors shorts.
Overall Direction and Outlook
**Bearish** – USOIL's trajectory today points downward, with the corrective uptick likely fizzling at $60 resistance. Expect continued pressure toward $57–$56 unless a decisive break above $60.75 emerges, which would shift bias to neutral.
Monitor upcoming EIA inventory data and US-China headlines for volatility spikes. Position sizing should account for low ATR (0.40), indicating subdued near-term swings. This assessment draws from a synthesis of price action, indicators, supply-demand fundamentals, and market sentiment for a comprehensive view.


DOWN TRENDCrude oil price has reached major supply zone and has accumulated because of the strong zone. price has broken the liquidity structure indicating a bearish reversal for a long retracement

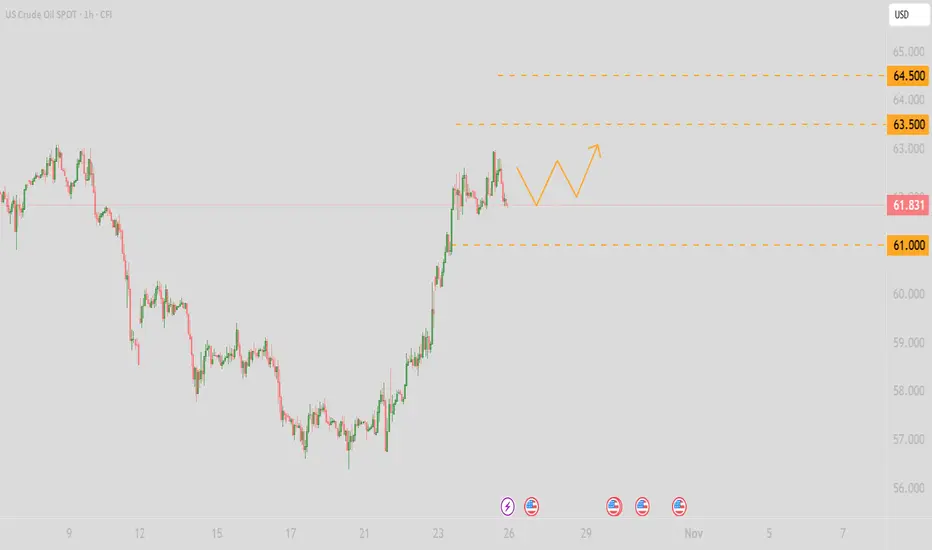
Will oil continue to rise? Yes, definitely.
Hi my Dears
Following recent trade policies, it seems that there is still room for oil to grow and we should see oil prices rise. The first price target we can hope for is $63.
Do you think it could happen?

USOIL – Daily Rejection & 4H Bearish Engulfing: Short Setup from 💬 Trade Description:
Price on **USOIL** recently pushed into a **daily supply zone** around the **62.00 area**, which had previously acted as a strong rejection point.
On the **daily timeframe**, a **clear pin-bar rejection** formed, showing that buyers lost control and sellers are stepping back into the market.
Dropping down to the **4-hour timeframe**, price created a **bearish engulfing candle** directly inside that same daily supply zone — confirming a strong **shift in momentum** and offering a precise entry opportunity.
This setup aligns perfectly with the **higher-timeframe bearish structure**, where the market continues to print **lower highs and lower lows**.
The reaction from the 62.00 zone suggests a potential continuation to the downside as price seeks liquidity near the **next major demand zone around 57.00**.
⚙️ Trade Breakdown:
* **Weekly Bias:** Bearish — market creating lower highs.
* **Daily Confirmation:** Pin bar rejection from daily supply.
* **4H Entry Trigger:** Bearish engulfing after retest.
* **Entry:** After 4H candle close.
* **Stop Loss:** Above the 4H engulfing high.
* **Take Profit:** Targeting 57.00 (next demand zone).
---
## 🧩 Technical Insights:
* The **daily pin bar** served as higher-timeframe confirmation that sellers were defending a premium level.
* The **4H engulfing** offered an early confirmation of short-term structure shift.
* The **trade idea** follows a simple, high-probability model:
**“Daily confirmation → 4H execution → Patience for follow-through.”**
---
## 💭 Trader’s Note:
Patience was key on this one. I waited for the daily signal first before dropping to the 4H to catch the clean bearish momentum. This is how I’m structuring all my trades now — only executing when the higher-timeframe aligns with the lower-timeframe trigger.
Discipline > Frequency.
Quality > Quantity.

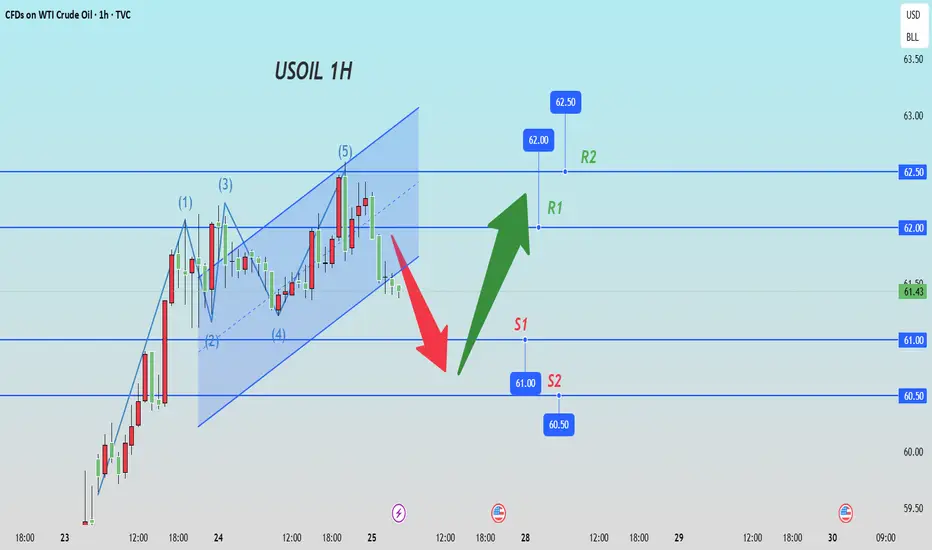
Crude Oil Trading Strategy for Today"Smart money" quietly entered the market, and the buying power accumulated rapidly.
In the last three trading days, the speculative funds (hedge funds, investment banks, etc.) in the crude oil futures market suddenly increased their bullish positions by 150,000 lots, marking the largest weekly increase in 3 months. These funds began to build positions in batches when the oil price dropped below $60, just like when the oil price fell to $58 last year, it was also these funds that entered the market, and the oil price soon rebounded by $5. At the same time, the inflow of funds into crude oil ETFs also increased fourfold. Ordinary investors began to follow suit and enter the market, and the buying pressure changed from "scattered" to "concentrated", providing sufficient short-term upward momentum.
Crude Oil Trading Strategy for Today
usoil @ buy 61-61.5
tp:62-62.5
SL:60

Crude oil review -DAILY- 27/10/2025Oil prices advanced as signs of progress in U.S.–China trade negotiations lifted market sentiment and improved the outlook for global energy demand. The easing of tariff threats and plans for a potential meeting between Presidents Trump and Xi have strengthened hopes for a trade deal, calming risk assets across markets. At the same time, U.S. sanctions targeting Russia’s largest oil producers added a modest geopolitical risk premium, providing further support to prices.
However, persistent concerns about oversupply remain, with OPEC+ members continuing to raise output, and weak demand projections weighing on sentiment. While optimism around trade is providing short-term support, the broader backdrop of abundant supply and sluggish consumption is likely to keep gains limited.
On the technical side, the crude oil price has corrected to the upside after finding support on the lower band of the Bollinger Bands, which are still quite expanded, indicating that there is sufficient volatility in the market to support any significant moves in the upcoming sessions. The 50-day SMA is still trading below the 100-day SMA, validating the overall bearish trend despite the recent bullish correction. The Stochastic is pushed near the extreme overbought levels, hinting that a bearish correction might be seen going forward, and if this scenario plays out, then the first area of support might be found around the $60 price mark, which is the psychological support of the round number as well as the 38.2% of the Fibonacci retracement level. In the event of a further move lower, the next support area might be seen around $58, which corresponds to the 23.6% Fibonacci level.
Disclaimer: The opinions in this article are personal to the writer and do not reflect those of Exness

USOIL SELLERS WILL DOMINATE THE MARKET|SHORT
USOIL SIGNAL
Trade Direction: short
Entry Level: 61.87
Target Level: 58.58
Stop Loss: 64.06
RISK PROFILE
Risk level: medium
Suggested risk: 1%
Timeframe: 6h
Disclosure: I am part of Trade Nation's Influencer program and receive a monthly fee for using their TradingView charts in my analysis.
✅LIKE AND COMMENT MY IDEAS✅

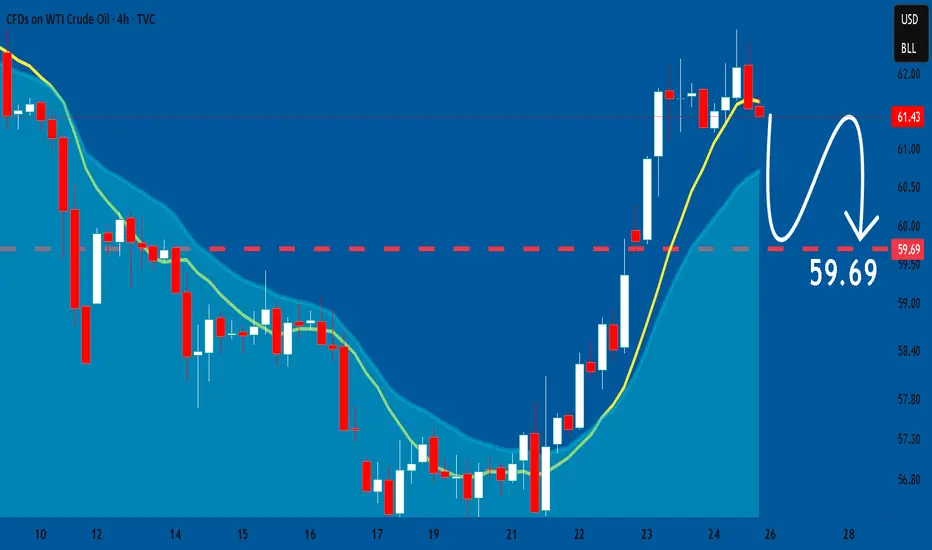
Crude oil consolidates ahead of the FEDCrude oil had reached the 50-day moving average, driven by sanctions for Russia, and creating some bullish flow amid some short coverage, as open interest for crude oil futures has been declining steadily since October 15. The effect seems temporary, as the global record surplus expectations skew expectations for lower price levels.
Thus, we may expect some rotation around the achieved level with some volatility around it. One should be careful with upside breakouts, as they have greater odds to be false, unless any game changing news will reach the market.
Don't forget - this is just the idea, always do your own research and never forget to manage your risk!

US OIL SUPPORT, RESISTANCE & TRENDLINE ANALYSISGood Morning Guyzz!!
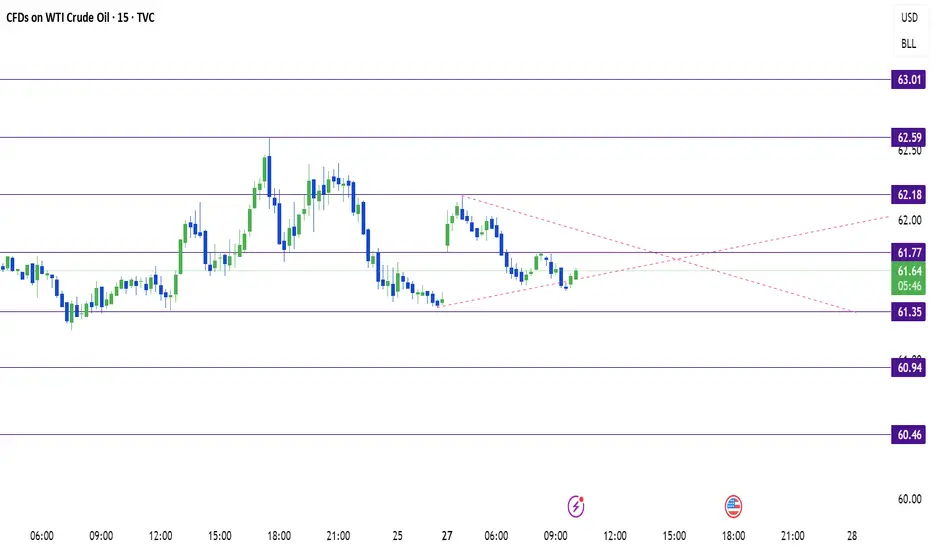
My levels will still remain the same as last weeks.
Go "LONG" if it breaks 62.18 and if it also breaks the trendline then can move up till 62.59 and breaking that might lead to 63.01.
Go "SHORT" if it breaks 61.77 along with the trendline leading to 61.35 and if it breaks that then aim for 60.94 and lastly if it breaks that as well by then 60.46 should be our target.
Crude Oil Trading Strategy for TodayInventory data validates the short-term demand resilience: The U.S. EIA data shows that the crude oil inventory decreased by 960,000 barrels on a week-on-week basis as of October 17th, with the decline exceeding market expectations. At the same time, the gasoline inventory also decreased simultaneously, alleviating concerns about weak demand. The unexpected decline in inventories coincided with geopolitical benefits, driving speculative funds to quickly enter the market to repair the previously oversold situation.
Price patterns exhibit rebound momentum: Since October 17th, WTI crude oil has risen by more than 8% in the past three trading days, closing at $61.68 on October 24th, forming a "bottom-up volume-driven rebound" pattern; the main contract of Shanghai crude oil also rose significantly, with the closing price on October 24th rising by 6.7% compared to the low point on October 20th, and the trading volume has continuously expanded for three consecutive days, indicating a rapid accumulation of buying power.
Crude Oil Trading Strategy for Today
usoil @ buy 61-61.5
tp:62-62.5
SL:60

Crude oil analysis and trading strategiesAffected by the U.S. sanctions on Russia and India's reduction in crude oil imports from Russia, coupled with the boost to demand from the easing of trade tensions, crude oil prices have rebounded significantly amid multiple uncertainties.
From the daily chart perspective, after oil prices touched around the 56 level, the candlesticks closed three consecutive bullish candles, successfully regaining the losses from the previous decline.
Oil prices have broken above the moving average system, and the medium-term objective trend has shifted from a downward direction to a transition phase. The MACD indicator has opened upward below the zero line, indicating that the bearish momentum is weakening. It is expected that the medium-term trend of oil prices will gradually pick up, but a clear medium-term bullish pattern has not yet been formed. From the 1-hour short-term trend, oil prices have risen for three consecutive trading days, breaking through the 60 level and reaching a high above 62. The current moving average system shows a bullish arrangement, providing support for oil prices, and the short-term trend is generally upward.
During the early trading session, oil prices fluctuated slightly within a high-level range. It is expected that the intraday crude oil trend will continue the upward rhythm. Based on comprehensive analysis, the trading strategy for crude oil today is recommended to focus on buying on dips.
Resistance Levels:61.50, 62.00, 63.00
Support Levels: 59.50, 59.00, 58.50

Crude Oil Trading Strategy for TodayGeopolitical sanctions trigger expectations of supply contraction: In late October, both the United States and Europe simultaneously escalated their energy sanctions against Russia. The United States imposed sanctions on Rosneft (the Russian oil company) and Lukoil (another Russian oil company), with the combined total of these two companies accounting for nearly 50% of Russia's total crude oil exports; the 19th round of sanctions by the European Union for the first time blocked the "third-country bypass" export channels. India, as the largest buyer of Russian maritime crude oil (accounting for over 36%), has begun to seek sources in the Middle East, directly pushing up the spot market premium and providing immediate support for oil prices.
Crude Oil Trading Strategy for Today
usoil @buy 61-61.5
tp:62-62.5
SL:60

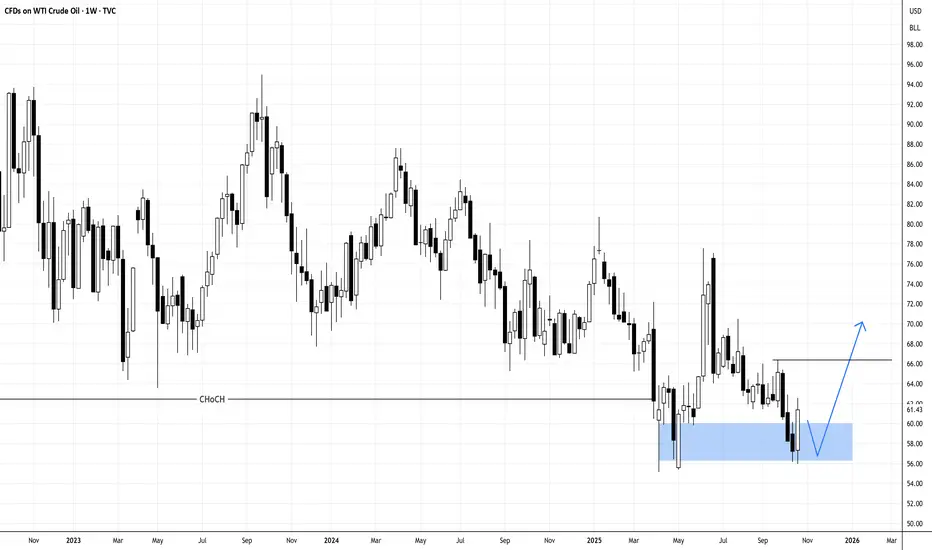
USOIL IN DOUBLE BOTTOM, MAYBE TARGETING ABOVE 66Oil may have found temporary bottom with the weekly double bottom.
N.B!
- USOIL price might not follow the drawn lines . Actual price movements may likely differ from the forecast.
- Let emotions and sentiments work for you
- ALWAYS Use Proper Risk Management In Your Trades
#usoil
#ukoil
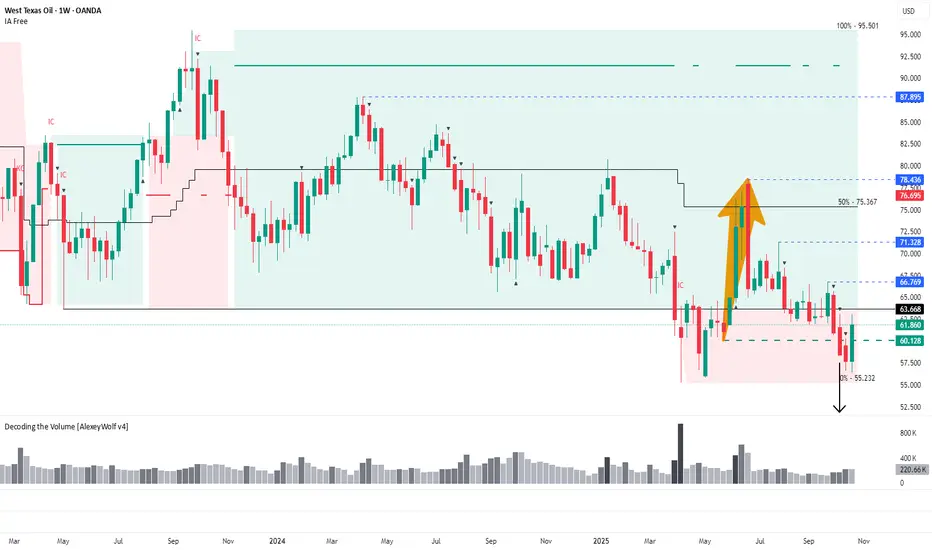
WTI: Possible reversal after false breakout of 60.128Weekly range structure may define oil’s direction for the coming months — buyers defend key support, while targets above 66.769 remain in focus.
Hi traders and investors!
This analysis is based on the Initiative Analysis (IA) concept.
On the weekly timeframe, a sideways range has been in place since April 2023, followed by a transitional phase.
Sellers managed to push the price below the lower boundary of this range — the first breakout occurred in March 2025.
After that, buyers brought the price back inside the range and reached the 50% level of the trading zone, from where sellers resumed control and once again pushed the price below the lower boundary at 63.668.
What’s interesting here is that earlier there was a buyer’s move returning the price into the range, with its base around 60.128.
We now see a seller candle attacking this level on high volume, followed by another seller candle with even higher volume, after which the price returned above 60.128.
This behavior may signal a false breakout (manipulation) of that level.
If this interpretation holds, the next potential upside targets are:
66.769 — first target,
71.328 — second target,
78.436 — third target,
followed by 87.895 and possibly 95.501.
Key points to watch:
whether buyers defend the 60.128 level if the price pulls back,
and whether they manage to break through the range boundary at 63.668, and then 66.769
.
If buyers succeed in holding above these two levels, the buyer’s vector is likely to continue developing toward the mentioned upside targets.
Wishing you profitable trades!
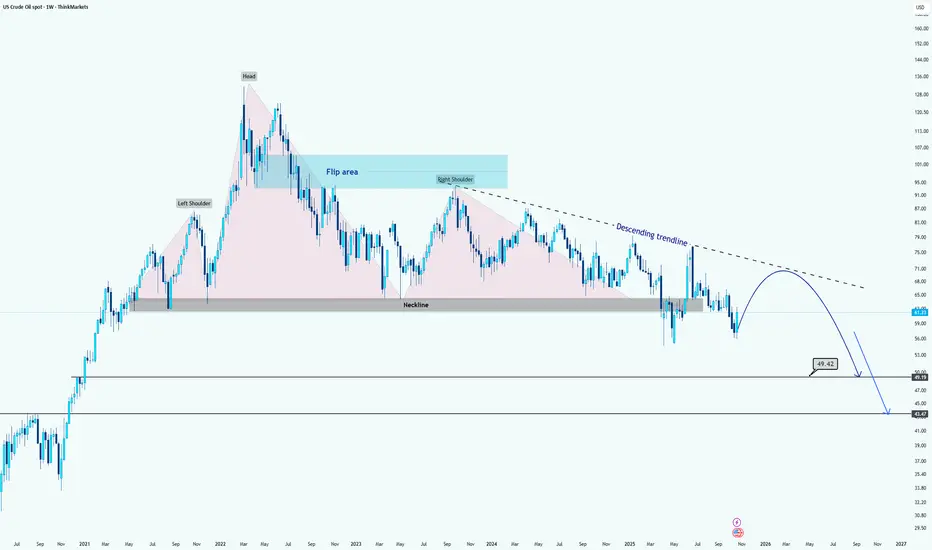
WTI Crude Oil Forms Major Head and Shoulders BreakdownHi guys.
WTI has formed a massive Head and Shoulders pattern on the weekly timeframe, signaling a potential long-term bearish reversal structure.
After the right shoulder completed, price decisively broke below the neckline around the $67–$70 range, confirming the pattern breakdown. This neckline now acts as a major resistance zone and aligns closely with the descending trendline, adding confluence to the bearish bias.
The recent rebound appears to be a corrective pullback toward the neckline or flip area, before potentially continuing to the downside. As long as WTI remains below the descending trendline and neckline zone, bearish momentum is expected to dominate.
The projected measured move target from the pattern suggests two possible support objectives:
First target: around $49.40, corresponding to prior consolidation and structural support.
Final target: near $43.40, aligning with historical demand and the full measured move projection from the Head and Shoulders formation.
Overall, unless WTI reclaims and sustains above the $70 area, the medium- to long-term bias remains bearish, with corrective rallies likely to face selling pressure.
Disclaimer: As part of ThinkMarkets’ Influencer Program, I am sponsored to share and publish their charts in my analysis.
Crude Oil Trading Strategy for Next Week"Buy low" strategy + "bottom has stabilized" in terms of technical analysis - there is a chance for a short-term rebound.
Financing side: "Bottoming" funds "quietly enter the market" and change the supply-demand expectations
In the past three days, the "non-commercial net long positions" (that is, the bullish positions of speculative funds) in the crude oil futures market suddenly increased by 120,000 lots, marking the largest weekly increase in 3 months. Among them, hedge funds and large investment banks were the main buyers. They began to build positions in batches starting from below 60 US dollars, just like when the oil price dropped to 58 US dollars, these funds entered the market and the oil price quickly rebounded by 4 US dollars. At the same time, the inflow of funds into crude oil ETFs also tripled, and ordinary investors began to follow the trend, and the buying power was accumulating rapidly.
Technical aspect: The price "successfully bottomed out" and the breakthrough signal has appeared
WTI crude oil has been oscillating in the range of 59.8 - 60.5 US dollars for a week, forming a "double bottom" pattern (two times falling to 59.8 without breaking through), and broke through the upper edge of the oscillation range (61.2 US dollars) on Thursday. After that, it has been running above this position. From the short-term trend, every time it drops to 61 US dollars, there are buyers to take over, indicating that the bottom support is very stable. In addition, the trading volume has also increased along with the breakthrough (the trading volume at the breakthrough was 40% higher than usual), it is not "false increase", and the rebound signal is very clear.
usoil @ buy 60.5-61.0
tp:62-62.5
SL:59.5
USOIL: Bearish Continuation is Highly Probable! Here is Why:
The analysis of the USOIL chart clearly shows us that the pair is finally about to tank due to the rising pressure from the sellers.
Disclosure: I am part of Trade Nation's Influencer program and receive a monthly fee for using their TradingView charts in my analysis.
❤️ Please, support our work with like & comment! ❤️
Review of USOIL's Performance This Week📝This week, the USOil market exhibited a highly volatile pattern of "first bottoming out and stabilizing, then rebounding driven by geopolitical factors". The competition between supply-demand fundamentals and sudden geopolitical events dominated the market trend throughout the week. Details are as follows:
💡Price Movement: From Approaching Annual Lows to Intraday Surges, Volatility Within Ranges Intensifies
1. Bottoming Out Early in the Week
On Monday, USOil continued its weak oscillation. It opened at $57.32 per barrel, dipped to a low of around $56 per barrel (approaching the 2025 annual low of $55.12), and finally closed at $56.93 per barrel, down $0.61 from the previous trading day.
From Tuesday to Wednesday, as panic eased, prices gradually stabilized and rebounded. It closed at $57.58 per barrel on Tuesday; on Wednesday, boosted by geopolitical expectations, it surged by $3.25 in a single day to close at $61.75 per barrel, with trading volume rising to 711,600 lots.
2. Rebounding and Then Retreating in the Latter Half of the Week
On Thursday, the official release of detailed EU and U.S. sanctions on Russian energy triggered a strong market reaction. USOil opened at $59.94 per barrel and then jumped, peaking at $62.59 per barrel with an intraday gain of nearly 5%, before closing at $61.44 per barrel.
On Friday, after the earlier rebound, prices entered a consolidation phase, fluctuating narrowly around $62. For the whole week, it rebounded by over 10% from the previous week’s low.
💡Core Influencing Factors:
1. Bearish Drivers: Sustained Supply-Demand Easing Suppresses Oil Prices
✔Worsening Supply Glut
✔Weak Demand Weighs on Prices
2. Bullish Disturbances: Geopolitical Sanctions Trigger a Phased Rebo
💡Technicals and Market Sentiment: Recovery After Oversold Conditions, Persistent Long-Short Divisions
1. Divergent Signals from Technical Indicators
2. Intense Battles Around Key Levels
The support at the annual low of $55.12 proved effective, serving as the starting point for the week’s bottoming and rebound. The resistance levels at $58 and $62 were breached one after another, but the resistance from the $63 level and the 70-dollar trend line still posed long-term pressure. A breakthrough would require sustained improvement in fundamental
💡Outlook: Short-Term Oscillations Unlikely to Reverse Long-Term Weak Trend
💎Short-Term Perspective: Geopolitical risk premiums and technical recovery after oversold conditions may support oil prices to fluctuate within the $58-$63 range. If the supply gap caused by sanctions continues to widen, it may test the resistance level of $66.
💎Long-Term Perspective: The IEA predicts that Brent crude oil prices will range between $52-$60 in 2026. Core contradictions such as loose supply-demand, accelerated energy transition, and approaching demand peaks remain unresolved. If the support at $55 is broken, it may fall to the deep correction range of $49 or even $37.
The market should focus on whether OPEC+ will adjust its production increase plan at the November 2 meeting and the impact of global manufacturing PMI data on demand expectations.
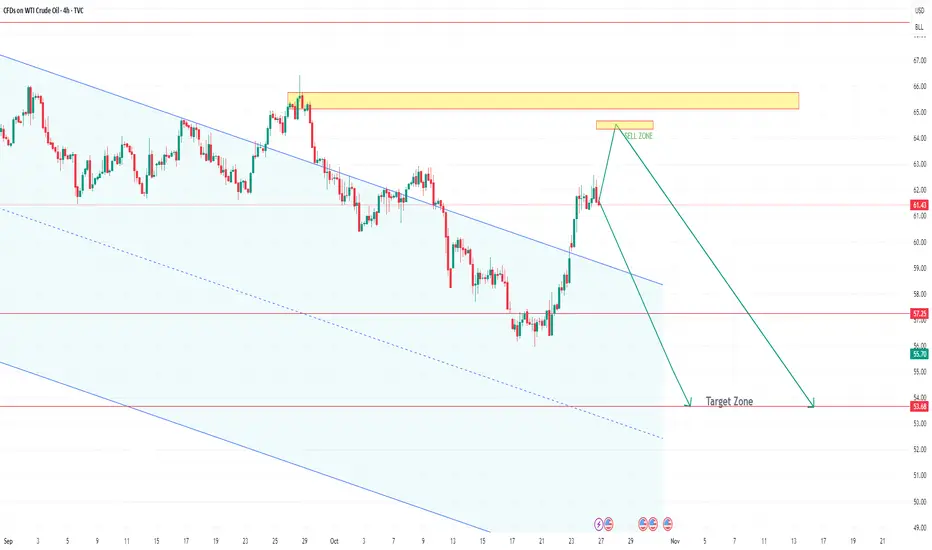
US OIL Short to 53.68The Commodity is expected to hit lower levels . The trend shows weakening of the Oil prices to the levels of 53 level.
The retracement is expected to the levels of 64.50 before the fall happens.
Upward trend in oilThe price of very clean oil reacted to the specified range and started an upward trend. We expect either the upward trend to continue or the price to correct and resume its upward movement from the specified range.

Crude Oil Trading Strategy for Next WeekShort-term demand "suddenly surges", creating space for the rebound
Unlike previous concerns about geo-political sanctions, the core support for this short-term bullish move is the "unexpected surge in demand". Two new variables directly change the short-term supply and demand balance:
Seasonal resumption of refineries "grabbing oil": As the maintenance period for refineries in the Northern Hemisphere comes to an end, refineries in Europe, the United States, and China have resumed operations simultaneously - the operating rate of European refineries has jumped from 78% to 85% (the highest in 3 months), and the production capacity that was halted due to hurricanes in the Gulf of Mexico has been fully restored (an additional 1.2 million barrels of processing capacity per day), and the operating rate of local refineries in Shandong, China has also risen from 65% to 72%. These refineries are rushing to stockpile raw materials before winter, and the spot purchase volume has increased by 30% month-on-month recently, directly pushing up the prices of near-month crude oil contracts, creating a "strong spot market, followed by a rise in futures" pattern.
Policy intervention to stabilize "low-price areas": The US Department of Energy announced last week that it will launch "small-scale replenishment" within the range of $60 - $62 (planning to repurchase 5 million barrels of crude oil to replenish strategic reserves), this is the first explicit replenishment signal after releasing reserves in 2022. The market knows that "there will be official buying to support when the price drops to $60", so there will be no deep decline in the short term; at the same time, the EU is responding to the winter energy shortage, requiring member states to complete 90% of natural gas inventory filling by November, and some countries (such as Germany) have begun to use crude oil instead of natural gas for power generation, adding an additional daily demand of 200,000 barrels of crude oil.
Crude Oil Trading Strategy for Next Week
usoil @ buy 60.5-61.0
tp:62-62.5
SL:59.5
