US500 Actionable Long Bullish 5 stack fundamental 6 stacks TechCMCMARKETS:SPX500Z2025
Fundamental: Bullish (5 stacks).
Technical: Bullish (6 stacks, Actionable 6+).
20-word summary: Earnings resilience and easing expectations support bids. EMAs aligned, RSI constructive. Dips bought while above 6675; trend continuation favored highs.
Trade plan (LONG): SL 107.768, TP 280.1968 (ATR method).
All stars align however stay sharp, stay nimble as tariffs loom.
Trade ideas

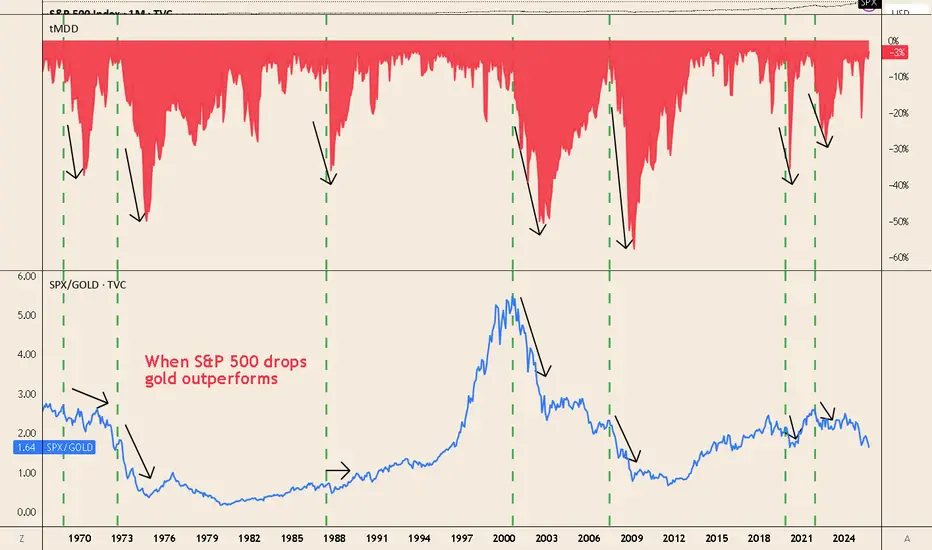
When Equities Fall, Gold Outperforms — SPX/Gold Says It All📊 Key insight
-Every major equity drawdown coincides with a drop in the SPX/Gold ratio — meaning gold outperforms stocks.
📉 What the chart shows
-1973–74 (stagflation): deep S&P 500 drawdown, SPX/Gold collapses.
-2000–02 (tech bust): ratio peaks ~5, then trends lower as gold rises and equities fall.
-2008–11 (GFC): brief liquidity hit to gold, then SPX/Gold plunges as gold rallies.
-2020 (COVID shock): rapid drop in SPX/Gold during equity sell-off.
-2022 bear market: ratio turns down again with inflation and rate stress.
Why it happens
-During market stress, investors seek safe collateral → gold demand spikes.
-Real rates and recession fears hurt equities more than gold.
-Silver carries industrial exposure, gold acts as a true safe haven.
🛡️ How to use it
-A gold allocation helps hedge against equity drawdowns.
-Long TVC:GOLD / short TVC:SPX (ratio trade) historically reduces portfolio volatility.
-Note: gold can dip during initial liquidity shocks (e.g., 2008, Mar 2020) — but recovers faster than equities.
Sovereign Debt Explained in the Global MarketIntroduction
Sovereign debt, also known as government debt or public debt, represents the money that a national government borrows to finance its expenditures and obligations. It is one of the most significant pillars of the global financial system, influencing everything from international trade and exchange rates to global market stability and development. Governments borrow to cover budget deficits, fund infrastructure, respond to crises, or stimulate economic growth. The management, structure, and sustainability of sovereign debt play a crucial role in determining a country's economic credibility and its integration into the global market.
In today’s interconnected world, sovereign debt is not an isolated national issue—it has far-reaching implications across borders. When a country defaults or faces a debt crisis, the ripple effects can be felt throughout the international financial system. Therefore, understanding sovereign debt in the context of the global market is essential to comprehend global economic dynamics, investor confidence, and long-term growth prospects.
1. Concept and Nature of Sovereign Debt
Sovereign debt is the total amount of money a government owes to external and internal creditors. It can take the form of bonds, loans, or other financial instruments issued by the government to domestic investors or foreign entities. Governments typically issue sovereign bonds—long-term or short-term securities that promise repayment of principal plus interest—to finance their fiscal needs.
There are two main categories of sovereign debt:
Domestic Debt:
Borrowed in the country’s own currency and often from local financial institutions or citizens. Domestic debt reduces exposure to foreign exchange risks but can crowd out private investment if excessive.
External Debt:
Borrowed from foreign creditors, including international organizations, foreign governments, and investors. It is often denominated in foreign currencies such as the U.S. dollar, euro, or yen. External debt exposes a country to exchange rate risks and global financial fluctuations.
Sovereign debt differs from corporate or personal debt because governments have unique powers—they can print money, tax citizens, and control monetary policy. However, these powers are not limitless, and excessive borrowing can lead to inflation, devaluation, or default.
2. Importance of Sovereign Debt in the Global Market
Sovereign debt plays several crucial roles in the global financial system:
Financing Government Expenditure:
Governments use debt to fund projects that stimulate economic growth—such as infrastructure, education, defense, and social welfare. This borrowing supports public services and long-term development.
Macroeconomic Stability and Fiscal Policy:
Borrowing helps smooth economic cycles. During recessions, governments may borrow more to stimulate demand and reduce unemployment. During booms, they may pay down debt to avoid overheating the economy.
Benchmark for Global Financial Markets:
Sovereign bonds, especially those issued by stable economies (like U.S. Treasury bonds), act as benchmarks for global interest rates. Investors worldwide use these as reference points to assess risk premiums on other assets.
Investment and Safe Haven Asset:
Many institutional investors, including central banks and pension funds, hold sovereign bonds as low-risk investments. U.S., Japanese, and German government bonds are considered “safe haven” assets during global uncertainty.
Indicator of Economic Health:
The level and sustainability of sovereign debt indicate a country’s fiscal health. A high debt-to-GDP ratio may raise concerns about solvency, while moderate debt can signal sound economic management.
3. Globalization and the Expansion of Sovereign Debt Markets
The globalization of finance has transformed sovereign debt markets dramatically. In the 20th and 21st centuries, capital mobility increased, allowing investors to buy foreign government bonds easily. Emerging markets also gained access to international borrowing, leading to a global expansion of sovereign debt.
Some key drivers of this trend include:
Financial Liberalization: Many developing countries opened their capital markets, allowing foreign investors to purchase local government bonds.
Technological Advancements: Digital trading platforms and global financial networks facilitated cross-border investment.
Global Savings Glut: High savings in developed nations, such as Japan and China, increased the demand for sovereign debt from other countries.
Monetary Policy in Advanced Economies: Low interest rates in developed countries pushed investors to seek higher yields in emerging markets, expanding their sovereign bond markets.
As a result, sovereign debt has become deeply intertwined with global capital flows. Investors in one country routinely hold the debt of others, linking their financial fortunes. This interdependence strengthens global economic cooperation but also amplifies systemic risks.
4. Determinants of Sovereign Debt Sustainability
The sustainability of sovereign debt depends on whether a government can service its obligations without resorting to excessive borrowing or risking default. Key determinants include:
Debt-to-GDP Ratio:
A widely used measure of a country’s debt burden. A high ratio may indicate financial strain, but the threshold varies across countries depending on growth rates and interest costs.
Interest Rate and Growth Differential:
If economic growth exceeds the interest rate on debt, the debt ratio tends to stabilize or decline over time. Conversely, if interest rates rise faster than growth, debt can become unsustainable.
Fiscal Balance:
Governments with persistent fiscal deficits (spending exceeding revenue) may accumulate unsustainable debt levels.
Exchange Rate Stability:
For countries with large external debt denominated in foreign currencies, exchange rate depreciation can inflate the debt burden.
Investor Confidence:
Global investors’ perception of a country’s economic management directly affects borrowing costs. Confidence can be influenced by political stability, monetary policy, and institutional credibility.
Debt Structure and Maturity Profile:
Short-term or variable-rate debt poses higher rollover and interest rate risks than long-term, fixed-rate debt.
5. Sovereign Debt Crises: Causes and Consequences
Sovereign debt crises occur when governments cannot meet their debt obligations, either through repayment or servicing interest. Such crises can arise due to poor fiscal management, external shocks, or global financial contagion.
Major Causes:
Excessive borrowing during boom periods followed by economic downturns.
Currency mismatches between debt and revenue.
Sudden stops in capital inflows or rising global interest rates.
Political instability and policy mismanagement.
Consequences:
Default and Restructuring: Governments may renegotiate terms with creditors or suspend payments temporarily.
Economic Recession: Austerity measures to reduce debt often suppress growth and increase unemployment.
Inflation and Currency Collapse: If debt is monetized (financed by printing money), it can lead to hyperinflation.
Loss of Credibility: A country’s access to international markets diminishes, raising borrowing costs for years.
Historical Examples:
Latin American Debt Crisis (1980s): Triggered by rising U.S. interest rates and oil price shocks.
Asian Financial Crisis (1997): Currency collapses led to debt defaults in several Asian economies.
Greek Debt Crisis (2010s): Excessive government spending and structural inefficiencies led to massive bailouts from the EU and IMF.
Argentina (multiple defaults): Chronic fiscal mismanagement and political instability have caused repeated sovereign defaults.
6. Role of International Institutions in Sovereign Debt Management
Institutions such as the International Monetary Fund (IMF), World Bank, and regional development banks play vital roles in managing sovereign debt crises and promoting fiscal stability.
IMF: Provides financial assistance and policy advice to countries facing balance-of-payments or debt crises. Its programs often come with fiscal and structural reform conditions.
World Bank: Focuses on long-term development financing and helps countries design sustainable debt management strategies.
Paris Club and London Club: Groups of official and private creditors that coordinate debt restructuring efforts for distressed sovereign borrowers.
Credit Rating Agencies (CRAs): Agencies like Moody’s, S&P, and Fitch assess sovereign creditworthiness, influencing borrowing costs in the global market.
These institutions aim to ensure that countries maintain fiscal discipline while providing relief during crises. However, critics argue that their policies sometimes prioritize creditor interests over social welfare, especially through austerity measures.
7. Sovereign Debt and Emerging Markets
Emerging markets have become significant participants in the global sovereign debt landscape. Countries like India, Brazil, Indonesia, and South Africa issue bonds in both domestic and international markets. While this enhances their access to capital, it also exposes them to global volatility.
Challenges Faced by Emerging Economies:
Currency risk due to foreign-denominated debt.
Limited investor confidence compared to developed nations.
Higher borrowing costs and vulnerability to global interest rate changes.
Political and policy uncertainties affecting credit ratings.
Despite these challenges, emerging market sovereign bonds attract global investors seeking higher yields, contributing to portfolio diversification.
8. The Future of Sovereign Debt in the Global Market
As the global economy evolves, the nature of sovereign debt is also transforming. Several trends are shaping its future:
Rising Global Debt Levels:
The COVID-19 pandemic and subsequent fiscal stimulus programs have driven global public debt to record highs, surpassing 100% of global GDP in many advanced economies.
Green and Sustainable Bonds:
Many governments now issue green bonds to finance environmentally sustainable projects. These instruments align debt issuance with climate goals and attract ESG-focused investors.
Digitalization and Transparency:
Blockchain technology and digital platforms are enhancing debt transparency, improving trust and efficiency in bond markets.
Geopolitical Shifts:
Rivalries among major economies, such as the U.S. and China, are influencing global debt markets through changes in capital flows and currency alignments.
Debt Relief and Restructuring Mechanisms:
Post-pandemic, international cooperation has increased to support low-income countries through debt relief initiatives like the G20 Common Framework.
Conclusion
Sovereign debt is both a tool of economic development and a potential source of financial instability. In the global market, it functions as a key instrument for investment, fiscal policy, and international cooperation. Properly managed, it enables nations to build infrastructure, stimulate growth, and enhance welfare. Mismanaged, it can trigger crises that ripple across the world economy.
The challenge for policymakers is to maintain a balance—borrowing enough to foster development while ensuring sustainability and market confidence. As the global financial landscape evolves, transparency, innovation, and prudent fiscal governance will determine how effectively sovereign debt continues to serve as a cornerstone of the global economy.

SPX .Pulling back a tadBuyers will want to keep it above 6700
6680-6695 is a bull test area if it gets there

ESG Investing and Green FinanceIntroduction
In the 21st century, global finance has undergone a profound transformation. Investors, corporations, and governments are increasingly recognizing that economic growth must go hand in hand with environmental protection, social responsibility, and ethical governance. This shift has given rise to two major trends — ESG (Environmental, Social, and Governance) investing and Green Finance. Both concepts aim to align financial decision-making with sustainability goals, addressing global challenges such as climate change, inequality, and responsible corporate behavior. ESG investing and Green Finance are not just moral imperatives; they are strategic approaches that seek long-term value creation, risk management, and the transition to a low-carbon economy.
1. Understanding ESG Investing
ESG investing refers to an investment strategy that incorporates environmental, social, and governance factors into financial analysis and portfolio management. It goes beyond traditional financial metrics by assessing how companies manage sustainability-related risks and opportunities.
Environmental criteria evaluate how a company impacts the planet — through carbon emissions, waste management, water usage, renewable energy adoption, and biodiversity protection.
Social criteria examine how a company treats people — including employees, customers, suppliers, and local communities. It focuses on labor rights, diversity, equality, workplace safety, and human rights.
Governance criteria assess corporate ethics, transparency, board diversity, executive compensation, and shareholder rights.
In essence, ESG investing combines profitability with purpose, allowing investors to generate financial returns while contributing to positive social and environmental outcomes.
2. Evolution and Growth of ESG Investing
The origins of ESG investing can be traced back to socially responsible investing (SRI) movements of the 1960s and 1970s. Activist investors avoided industries such as tobacco, weapons, or apartheid-linked businesses. However, ESG investing evolved beyond exclusionary screening to focus on proactive investment in sustainable and responsible companies.
A significant milestone occurred in 2006, when the United Nations launched the Principles for Responsible Investment (UNPRI), encouraging institutional investors to integrate ESG principles into their investment decisions. Since then, ESG investing has grown exponentially.
By 2025, the global ESG assets under management (AUM) are projected to exceed $50 trillion, representing more than one-third of total global assets. Major asset managers like BlackRock, Vanguard, and Fidelity have incorporated ESG frameworks into their portfolios, while ESG-focused funds have outperformed traditional funds in many market cycles, particularly during crises such as the COVID-19 pandemic.
3. Key Components of ESG
(a) Environmental Factors
Environmental aspects are central to ESG investing. Investors assess a company’s carbon footprint, energy efficiency, waste disposal practices, and compliance with environmental laws. For instance, companies that transition toward renewable energy sources or adopt circular economy principles are considered environmentally sustainable.
Important sub-factors include:
Greenhouse gas (GHG) emissions and carbon neutrality goals
Renewable energy investment
Water conservation and pollution control
Sustainable supply chains
Biodiversity preservation
For example, Tesla and Ørsted attract ESG investors for their leadership in clean energy and low-carbon technologies.
(b) Social Factors
The social dimension emphasizes a company’s treatment of people and communities. This includes fair labor practices, human rights, product safety, customer privacy, and diversity initiatives. A company’s reputation and long-term success often depend on social responsibility and stakeholder trust.
Key areas include:
Employee welfare and workplace safety
Gender and racial diversity in leadership
Consumer protection and ethical marketing
Community development programs
Supply chain ethics
Firms like Unilever and Patagonia are known for integrating social responsibility into their corporate strategy, enhancing both brand loyalty and long-term profitability.
(c) Governance Factors
Governance ensures accountability, transparency, and ethical leadership. It involves assessing how decisions are made within an organization and whether management aligns with shareholders’ and stakeholders’ interests.
Governance evaluation considers:
Board composition and independence
Executive pay and accountability
Anti-corruption policies
Shareholder voting rights
Ethical corporate conduct
Poor governance can lead to scandals and losses, as seen in corporate collapses like Enron or Wirecard, where lack of oversight and transparency destroyed investor confidence.
4. ESG Investing Strategies
Investors use several methods to implement ESG principles:
Negative Screening: Excluding companies involved in harmful industries (e.g., fossil fuels, tobacco, or weapons).
Positive Screening: Selecting companies that perform better on ESG metrics than their peers.
Best-in-Class Approach: Investing in the most sustainable companies within each sector.
Thematic Investing: Focusing on specific sustainability themes such as renewable energy, clean water, or gender equality.
Impact Investing: Targeting measurable social and environmental outcomes alongside financial returns.
ESG Integration: Incorporating ESG data into traditional financial analysis to evaluate overall risk-adjusted returns.
These approaches allow investors to align their portfolios with their values and long-term sustainability goals.
5. Importance and Benefits of ESG Investing
ESG investing offers multiple advantages to investors, businesses, and society.
Risk Mitigation: Companies with strong ESG performance tend to manage risks better, reducing exposure to legal, environmental, and reputational crises.
Financial Performance: Numerous studies show a positive correlation between ESG integration and long-term financial returns. Sustainable firms are often more efficient, innovative, and resilient.
Investor Demand: Younger generations, especially Millennials and Gen Z, increasingly prefer ethical investments that align with their values.
Regulatory Support: Governments and regulators are promoting ESG disclosures, creating an environment where sustainability becomes a necessity rather than a choice.
Corporate Reputation: Strong ESG performance enhances brand image, attracting customers, investors, and top talent.
6. Understanding Green Finance
While ESG investing focuses on evaluating sustainability within investments, Green Finance refers to financial instruments and services that directly support environmentally beneficial projects. It aims to mobilize capital toward green initiatives that promote climate resilience, energy efficiency, and ecological sustainability.
Green Finance includes a wide range of products such as:
Green Bonds – bonds issued to finance renewable energy, clean transportation, and waste management projects.
Green Loans – loans with favorable terms for sustainable projects.
Green Mutual Funds and ETFs – investment funds focusing on companies or projects that meet environmental standards.
Carbon Markets and Credits – mechanisms that incentivize emissions reduction.
Sustainable Insurance and Banking – financial institutions offering eco-friendly products and services.
In essence, Green Finance channels money into projects that contribute to a low-carbon and sustainable future.
7. The Rise of Green Finance Globally
Green finance gained global recognition after the 2015 Paris Agreement, which called for aligning financial systems with climate goals. The agreement encouraged nations to mobilize trillions of dollars in climate finance to limit global warming to below 2°C.
Leading economies such as the European Union, China, and the United States have established green finance frameworks.
The EU Green Deal and EU Taxonomy for Sustainable Activities provide a clear classification system for green investments.
China’s Green Bond Endorsed Project Catalogue guides green bond issuance and has made China one of the largest green bond markets globally.
Multilateral institutions such as the World Bank and Asian Development Bank support developing nations in adopting green finance principles.
According to the Climate Bonds Initiative, global green bond issuance surpassed $600 billion in 2023, signaling the growing importance of sustainability-linked finance.
8. Relationship Between ESG Investing and Green Finance
While both concepts share sustainability as their foundation, they differ in scope and application.
ESG investing focuses on evaluating corporate behavior and integrating sustainability into investment decisions across all industries.
Green Finance specifically directs capital toward projects that have clear environmental benefits.
However, the two are interconnected. ESG investors often allocate capital to green financial instruments, while green finance initiatives rely on ESG metrics to ensure accountability and transparency. Together, they form the backbone of sustainable finance, promoting a more inclusive and climate-conscious global economy.
9. Challenges in ESG Investing and Green Finance
Despite their growth, both ESG investing and green finance face several challenges:
Lack of Standardization: Different countries and rating agencies use varied ESG criteria, leading to inconsistent assessments and “greenwashing.”
Greenwashing Risks: Some companies exaggerate their sustainability claims to attract investors without actual environmental commitment.
Data Availability: Reliable ESG data and performance metrics are limited, especially in developing markets.
Short-Term Investor Mindset: Many investors prioritize short-term gains over long-term sustainability impacts.
Regulatory Barriers: Inconsistent regulations across jurisdictions make it difficult to measure and compare ESG performance globally.
Transition Costs: Shifting to sustainable business models requires upfront investments that may deter smaller firms.
Addressing these challenges requires global cooperation, transparent reporting, and strong regulatory frameworks.
10. The Future of ESG and Green Finance
The future of finance is undeniably green and responsible. Governments, institutions, and individuals are realizing that sustainability is essential for economic resilience and planetary survival. Key future trends include:
Mandatory ESG Disclosure: Regulators in the EU, India, and the US are introducing compulsory ESG reporting standards for corporations.
Technology Integration: Artificial intelligence, blockchain, and big data analytics are improving ESG measurement and transparency.
Sustainable Development Goals (SDGs): ESG investing and green finance will play vital roles in achieving the United Nations’ 17 SDGs by 2030.
Green Central Banking: Central banks are increasingly integrating climate risks into monetary policies and lending frameworks.
Emerging Market Participation: Developing countries are adopting green finance to address energy transitions and attract foreign investment.
Ultimately, ESG and green finance are not temporary trends — they represent a long-term transformation of the global financial system.
Conclusion
ESG investing and Green Finance have redefined how the world views the relationship between money, ethics, and the environment. They demonstrate that profitability and sustainability can coexist, driving innovation, resilience, and inclusive growth. As climate change intensifies and social challenges persist, the role of finance as a catalyst for sustainable development has never been more crucial.
By integrating ESG principles and promoting green financial instruments, investors and policymakers can pave the way toward a more sustainable, equitable, and prosperous global economy. The future belongs to those who not only generate wealth but also protect the planet and uplift society — a vision where finance serves humanity, not just profits.

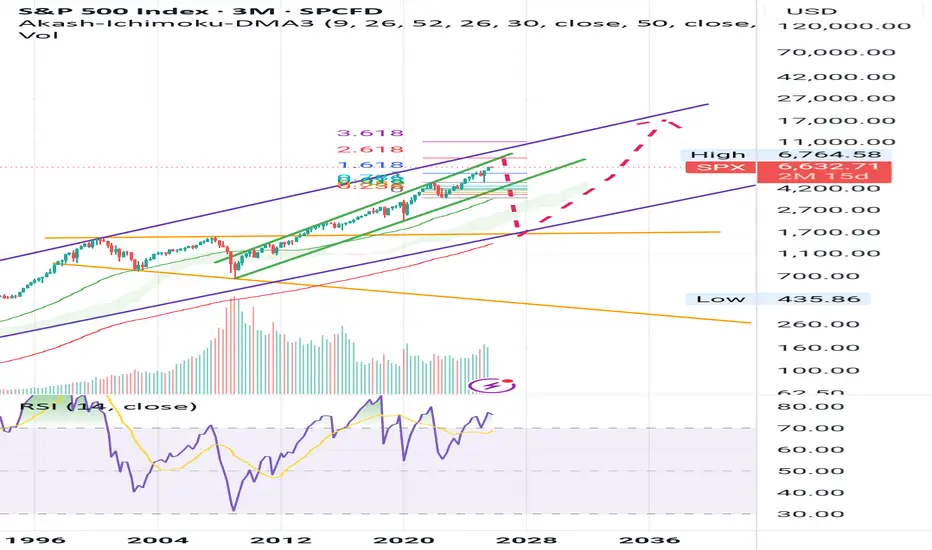
SP500 7000+++++In our latest analysis, we emphasized this region as decisive for seeking new highs.
Not much has changed since the last one, it made a small retraction and is already looking for the last ATH again.
Stay tuned in this price region, if it breaks we could soon see SP500 above 7000 points
Become a part of our Forex Dream Community

“SPX – 750-Point Range in Play”Date: 20-10-2025
#SPX - Current Price: $6,664.00
Pivot Point: $6,656.59 Support: $6,518.03 Resistance: $6,796.21
Upside Levels:
L1: $6,938.02 L2: $7,079.83 L3: $7,238.55 L4: $7,397.26
Downside Levels:
L1: $6,375.69 L2: $6,233.35 L3: $6,074.64 L4: $5,915.92
#SPX #TRADINGVIEW #DJI #NDQ # NIFTY

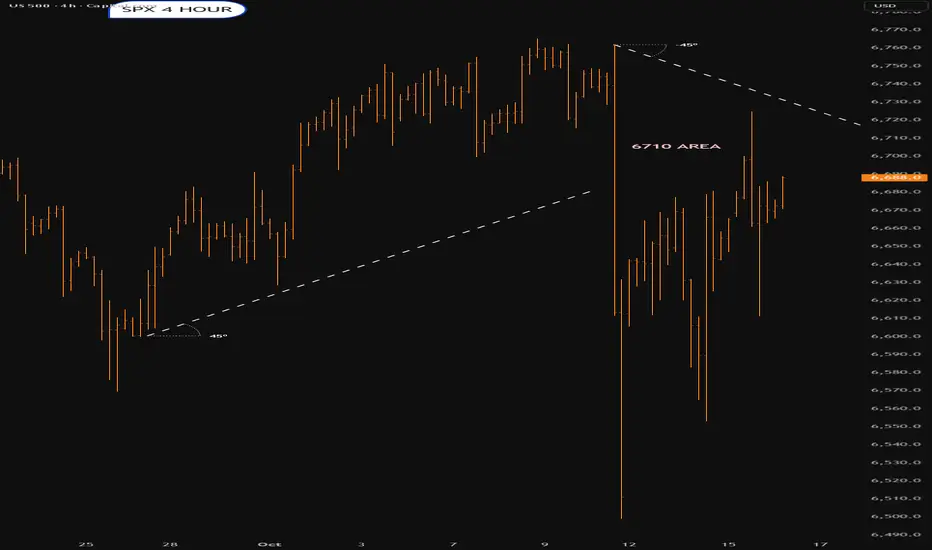
SPX into the open.Monday 20th OctoberLooking pretty bullish.Previous rez was above 6700.Lets see what happens above 6710 area

Or is this profit-taking ahead of year-end rebalancing?Or is this profit-taking ahead of year-end rebalancing?
1. US500 has reclaimed multiple EMAs, but price is still rotating around them—signaling range conditions and a wait for a clear break. With price hovering near the range top, the pullback is possible to extend consolidation or even shift to downtrend.
2. Failure to clear 6700 risks a roll-over beneath the EMAs toward 6500 support.
3. However, a decisive break/close above the 6700 swing high would confirm upside continuation and reopen the uptrend.
4. Equities investors paused ahead of big earnings and a delayed inflation print that could drive moves later this week. Markets were still nursing losses from bank-stress jitters, though solid U.S. regional bank results briefly calmed volatility.
5. Goldman Sachs said hedge funds sold U.S. equities at the fastest pace since early April, led by shorts in Macro Products and single names. U.S. ETF short interest saw its biggest jump in 5+ months, ending a seven-week net-buying streak.
6. Therefore, the failure to make a new high may signal profit-taking pressure, and the price could fall further as we approach year-end.
Analysis by: Krisada Yoonaisil, Financial Markets Strategist at Exness

SPX | DAILY ANALYSIS #6Hello and welcome back to DP.
Let’s kick off the weekday together by analyzing the **S&P 500 Index (SPX)**.
🟠 Market Overview
Previous Close: 6692.50
Current Daily Range: 6678.00 – 6705.80
Asia Session High: 6705.80
Asia Session Low: 6678.00
The index has seen significant selling pressure over the past week. She broke below the previous demand zone at 6715–6700, forming a new demand zone between 6680–6665.
This could suggest:
* Sellers are gaining momentum, OR
* Short positions were liquidated to make room for new entries.
🔵 Key Levels to Watch
Resistance Zone (Upside Target):
6711 – A break and hold above this level could lead to a test of 6735 and potentially new highs near 6755.
Support Zone (Blue Box):
6680 – 6665 – This is a critical support zone.
If broken, we may see the index fall toward:
First Support (Yellow Box): 6645
Deeper Support Zone: 6620 – 6605
If the 6680 zone holds and we see bullish confirmation (e.g., strong buying wicks, volume spike, or bullish engulfing candle), buyers may regain control and push the price back up toward the 6710–6730 range.
🧠 Trading Outlook
Bullish Bias Above: 6711
Bearish Bias Below: 6680
Neutral Zone: 6680–6710 (watch for consolidation or fakeouts)
📌 Note: The current structure suggests we are at a decision point. Be patient, wait for confirmation, and manage your risk accordingly.
Take care and have a great trading day!
For informational purposes only – not financial advice. © DIBAPRISM
Amir D. Kohn

US500 rallied despite lingering risks of regional banks stress
Fears surrounding regional banks that rattled markets quickly faded, as reassuring earnings results and President Trump’s conciliatory tone toward China restored investor confidence.
Earlier this week, Zions Bank and Western Alliance Bank reported losses tied to loan fraud, reviving fears reminiscent of the Silicon Valley Bank collapse. However, stronger-than-expected earnings and limited signs of credit deterioration reassured investors and eased market jitters. Moody’s noted that while concerns over bad loans persist, there is little evidence of systemic risk. They added that regional banks’ key health metrics remain solid.
US500 briefly tested the support at 6530 before approaching the resistance at 6700 again. The index remains above bullish EMAs, indicating a potential extension of bullish momentum.
If US500 closes above 6700, it may gain upward momentum toward the next resistance at 6800. Conversely, if it closes near EMA21, the index may retreat toward the next support at 6530.

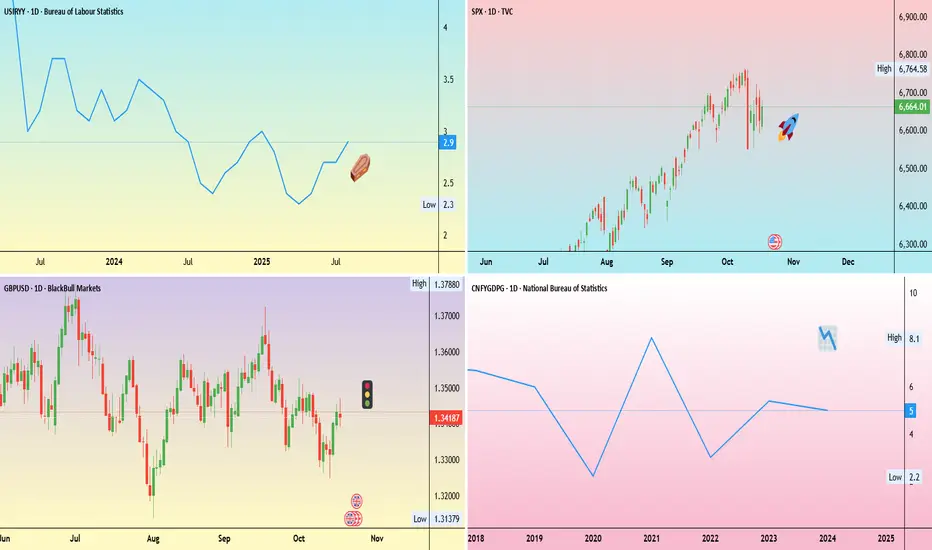
Weekly Trading Opportunities | October 21–25 • Monday: China GDP data
China’s third-quarter GDP report will be closely watched as growth is expected to slow to 4.8% year-on-year from 5.2% in Q2.
Slowing growth in China could reduce demand and prices for commodities. A surprise upside could support commodity prices.
• Tuesday: Coca-Cola and Netflix earnings.
Earnings season continues with Coca-Cola, Netflix, and others including Tesla, IBM, and Intel.
Strong results could offset soft U.S. data and help reignite the risk-on environment.
• Wednesday: U.K. inflation data and Tesla earnings
U.K. inflation is expected to edge back toward 4%. A softer reading could boost U.K. equities and pressure the pound.
• Thursday: Intel earnings
• Friday: U.S. CPI report
With the U.S. government shutdown entering its fourth week, the CPI release remains the week’s key data point. A hotter print could lift the dollar.
S&P 500 Daily Chart Analysis For Week of Oct 17, 2025Technical Analysis and Outlook:
Last week's trading session was marked by significant volatility in the S&P 500 Index, which experienced pronounced price fluctuations following its descent to our established Mean Support level of 6550. This level served as a critical point for market participants, triggering a series of rapid buying and selling activities that contributed to the index's overall gyrations.
At present, the index is positioned just below the newly established Mean Resistance level of 6671, which indicates the potential for further upward momentum, as this trend suggests a Well-built extension to the subsequent Mean Support level of 6550.
Contrariwise, it is essential to acknowledge and be aware of the emergence of the unexpected market drop to the Mean Support 6550, 6485, 6371, and the Key Support level of 6240. Additionally, it's crucial to take note of the Auxiliary Inner Rebounds occurring at these critical points.

S&P 500 at the Golden Support – Bounce or Breakdown?Short-Term View:
S&P 500 is testing its 50-day moving average near 6,470 after a recent correction from 6,800. A strong bullish reaction from this zone could push prices toward 6,850 → 7,000.
If the index closes below 6,550, short-term momentum turns bearish and a drop toward 6,400 becomes likely.
Long-Term View:
The broader trend remains bullish as long as price holds above 6,470–6,145.
Breaking below 6,145 would confirm a larger correction toward 6,000–5,800, while holding above this zone keeps the path open for new highs near 7,200.
Summary:
S&P 500 stands at a key technical decision zone — the market is deciding whether to resume its bullish trend or start a mid-term correction.

SPX short term roadmapPath says it all. Not financial advice. Will show zoomed out channel in another post.
US500 Short term cautionOutlook
While short term caution is warranted due to the recent decline and elevated volatility, the US500 remains in a long term uptrend supported by strong annual gains. Expectations of continued resilience from large cap stocks maintain a positive outlook going into year end. However, models suggest a cautious path for the near future, anticipating the index to correct, indicating potential headwinds. The critical support zone remains near 6,400.
Fundamental Analysis
US500 demonstrates robust long term health, up over 11% compared to one year ago. This performance is fundamentally driven by resilient large cap earnings and underlying strength in technology and consumer sectors. Major financial institutions, including JP Morgan, Goldman Sachs, and Citigroup, have recently raised their year end targets into the 6,000 – 6,900 range, citing expectations of continued strong earnings and potential tailwinds from monetary policy shifts and interest rate cuts. However, current sentiment has introduced short term caution due to recent macroeconomic developments and elevated volatility.
Technical Analysis
The index is currently trading around a key support of 6,600 points, reflecting a short term decline from the previous session. The short term trend is showing signs of a possible bearish correction or pullback, despite longer timeframes maintaining underlying bullish momentum. Volatility is notably elevated, with the VIX above 25.00, suggesting increased market uncertainty and potential for sharp swings. Immediate resistance is clearly defined near the recent high of 6,725. Immediate support is seen around 6,600 points. Short term bearishness is primarily attributed to technical factors like profit taking.
Analysis by Terence Hove, Senior Financial Markets Strategist at Exness

Is SPX selling for a sell off Observation on SPX
1) Since 25TH April the SPX was bouncing on its 20 Ema . In fact if you bought every time SPX touched the 20 EMA you would have made money .
2) The 20 Ema acted as a support 6 times .
3) But notice the last three bounces were weaker and weaker .
4) 7TH time the 20 Ema broke with increasing volume .
Conclusion the probability of a break down is very high almost 75%

16 OCT 2025: H1 - SMT DIVERGENCE VISUALIZEDNARRATIVE:
US100 made a HH purging the PDH and delivering into the H4 -OB
US30 made a LH and did not purge the PDH
US500 made a LH and did not purge the PDH
SMT is drawn from the High of the PD to the High of the current day - note that on the LTFs like the M15, if you look closely this is the PD NY High to the current day NY high. The M15 provides the landscape for you to execute in real-time and observe the SMT whilst it occurs.
Hope you enjoyed today's lesson :)
DISCLAIMER:
The owner of this page is an authorised Representative under supervision of TD MARKETS (PTY) LTD, an authorised Financial Services Provider (FSP No. 49128) licensed by the Financial Sector Conduct Authority (FSCA) under the Financial Advisory and Intermediary Services Act (FAIS).
The FSP is licensed to provide advice and intermediary services in respect of Category I financial products, including but not limited to derivative instruments, long-term deposits, and short-term deposits.
All investment ideas are provided in accordance with the scope of the FSP's license and applicable regulatory requirements. Derivative instruments is a leveraged products that carry high risks and could result in losing all of your capital, and past performance is not indicative of future results.
This idea and any attachments are informational/education and does not constitute a recommendation to buy/sell.
No guarantee is made regarding the accuracy or outcome of this trade idea.
If you choose to accept this idea, please do so at your own risk.

S&P500 | Mild CrashRisk assets looking to sell off as the stock market tops out around $6,800.
Current price action is only pulling back to test sellers again and we should see a continuation in selling until mid November and hopefully to see a Christmas rally to end the year off.
Since price action awfully looks similar to '24 - '25 Fractal we could say the SPX will look to top next year February/March also considering we're on correction 4 in the Elliott Wave Theory.
Would like to see the S&P bottom out around April - July months of next year at $5,600 if we can continue the bullish parallel trend.

H&S + RSI Divergence = Pain aheadSPX has a confluence of Head and shoulders and RSI divergence - This might be painful. Taking major profits here

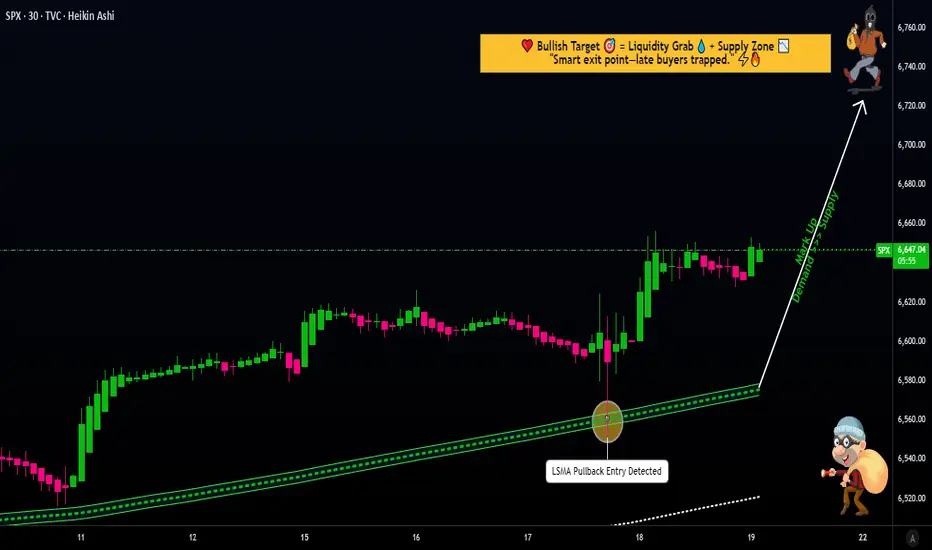
SPX500 Trading Strategy Explained: From Entry to Exit⚡ SPX500 “STANDARD & POOR” Indices Market Wealth Strategy Map ⚡
(Swing / Day Trade Plan – Thief OG Style)
🧭 Plan
📈 Bias: Bullish confirmed with 30m LSMA pullback + 0.786 Fibonacci-based MA confluence.
💡 Entry Approach (Thief Layering Strategy™):
Instead of one-shot entry, I place multiple buy-limit layers to average into strength. Example setup:
Buy limit: 6600
Buy limit: 6620
Buy limit: 6640
👉 You can extend or adjust the layering based on your own strategy.
🎯 Stop Loss (SL)
This is my Thief SL @6560.
⚠️ Note to Ladies & Gentlemen (Thief OG’s): This SL is not a recommendation. Use your own judgment — protect your loot at your own risk.
💰 Target (TP)
📌 6750 — sitting at strong resistance + overbought zone + possible bull-trap.
⚠️ Again, OG’s — this is not financial advice. Take profit when it fits your plan. Secure the bag, then enjoy the loot!
🔍 Related Pairs to Watch
Keep an eye on these correlated assets to confirm the SPX500’s move:
NASDAQ:NDX (Nasdaq 100): Tech-heavy index with strong correlation to SPX500. If tech stocks are pumping, it’s a bullish signal for our trade. 📊
TVC:DXY (US Dollar Index): A weaker dollar often boosts equities. Watch for inverse correlation—DXY dropping could mean SPX500 is ready to fly! 🚀
TVC:VIX (Volatility Index): Low VIX levels signal market calm, supporting our bullish setup. A spike in VIX could warn of trouble, so stay sharp! ⚡
Key Correlation Insight: SPX500 often moves in tandem with NASDAQ:NDX due to shared tech giants (think Apple, Microsoft). If NASDAQ:NDX is rallying, it’s a tailwind for our trade. Conversely, a rising TVC:DXY or TVC:VIX could signal caution.
📝 Thief Note
Dear Ladies & Gentlemen (Thief OG’s):
This map is my personal swing/day trade playbook — not a fixed recommendation. Layer entries, cut losers fast, and loot when you can. Market moves are wild; manage risk like a true OG.
✨ “If you find value in my analysis, a 👍 and 🚀 boost is much appreciated — it helps me share more setups with the community!”
⚠️ Disclaimer: This is a Thief-style trading strategy shared just for fun & educational vibes. Not financial advice. DYOR & trade responsibly.
SPX | Daily Analysis #4 Hello and welcome back to DP,
**Review and News**
Yesterday, the index experienced a $150 intraday fluctuation and closed in the green. As mentioned in a previous post, we noted that "if the price breaks the 6682 zone, the index could extend towards the 6720 area." As illustrated in the chart, the market responded to this price range and dropped towards the 6620 zone. However, in a significant move, buyers outperformed sellers, pushing the price back to the 6681 zone. This move is noteworthy as it indicates that the market shows more potential for upward movement rather than a downward move. It’s also important to note that, in the final moments before market closure, President Trump tweeted: "The USA is officially in a trade war with China."
**1-Hour and 4-Hour Time Frame Price Action**
As depicted in the chart, the formation of higher highs (HH) and higher lows (HL) suggests that the market is struggling to regain gains and recover from its previous record highs. The significant candlestick shows that buyers have a strong presence and are willing to push the price higher. However, if the price dips below this candlestick, the index could move lower, potentially benefiting short sellers. That being said, I don’t believe this will happen. In my opinion, many retail traders are hoping for a larger price drop, but based on market behavior, this could be a trap for sellers. Therefore, I anticipate a potential upward move and a recovery of last Friday’s losses within this week.
**Trend Analysis**
While I’m unable to display my trend analysis chart here, as mentioned previously, the price tested the 4-hour trend line (with the first trend line originating from February 25, 2025, and the second starting from August 12, 2025). The price then made a significant move, breaking through the upper trend line.
**Trade Ideas**
1. If the price falls through the 6681 zone and confirms the break, consider entering a buy position at the last high.
2. If the price declines with high volume (possibly triggered by news) through the 6617 area and breaks this zone strongly, a cautious sell position can be considered, with two take-profit levels on the way down.
3. Based on the 4-hour trend line, a buy position could be considered if the price falls and approaches the trend line again (around the 6630 area).
**Disclaimer**
These notes and trade ideas are for informational purposes only and do not constitute financial advice.
*Issued by: A. Diba Kohn*

SPX into Thursday 16th OctoberMarket has flipped from bullish to bearish,It is trying to unwind that downtrend.Will it succeed.?