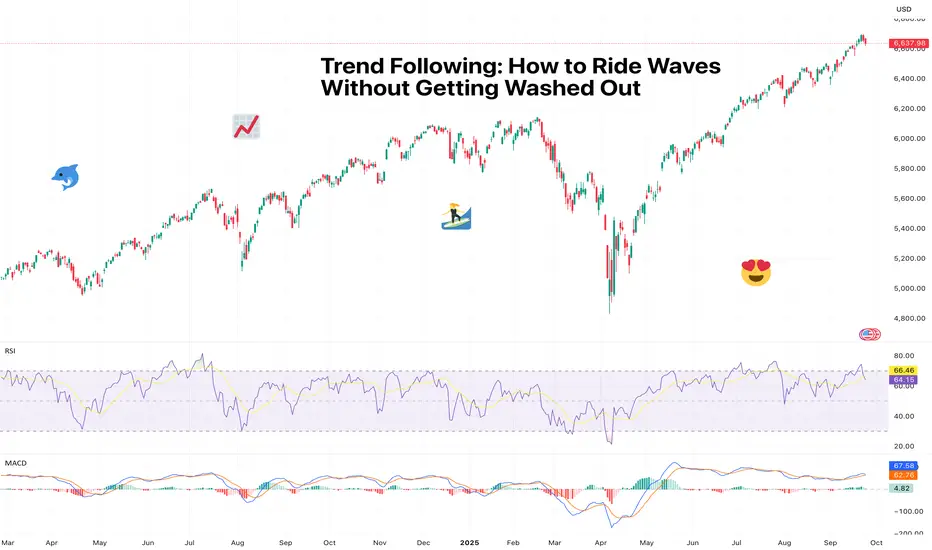
Trend Following: How to Ride Waves Without Getting Washed OutMarkets move in waves. Easy, right? But if you’ve tried catching one only to find out you get washed out, you’ve realized it ain’t’ that easy.
Sometimes there are gentle ripples that lull traders into boredom, other times they’re tsunamis that wipe out everything in sight.
The trick isn’t predict
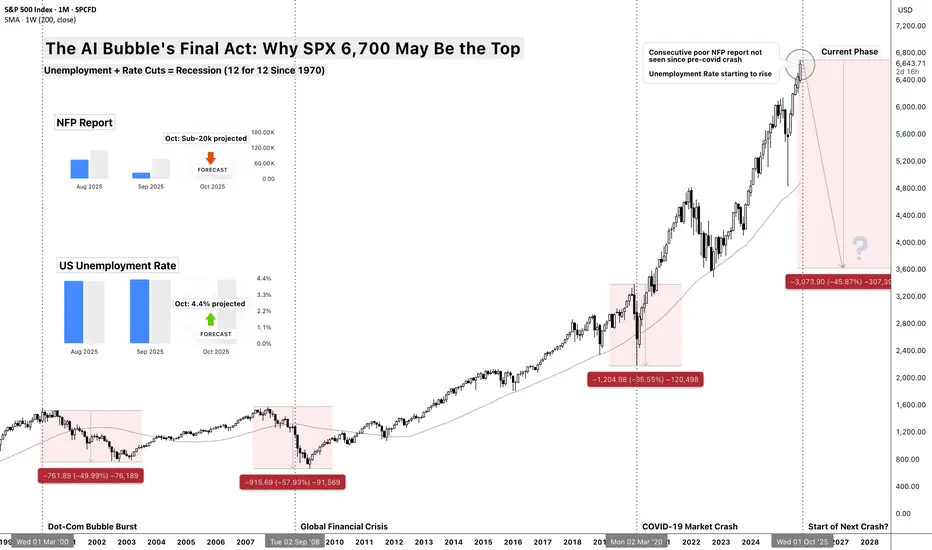
The AI Bubble's Final Act: Why $SP:SPX 6,700 May Be the TopThe AI Bubble's Final Act: Why SP:SPX 6,700 May Be the Top
Unemployment + Rate Cuts = Recession (12 for 12 Since 1970)
The Death Cross Pattern
There's a simple rule that's worked for 55 years: When the Fed cuts rates while unemployment is rising from cycle lows, recession follows within 12 m
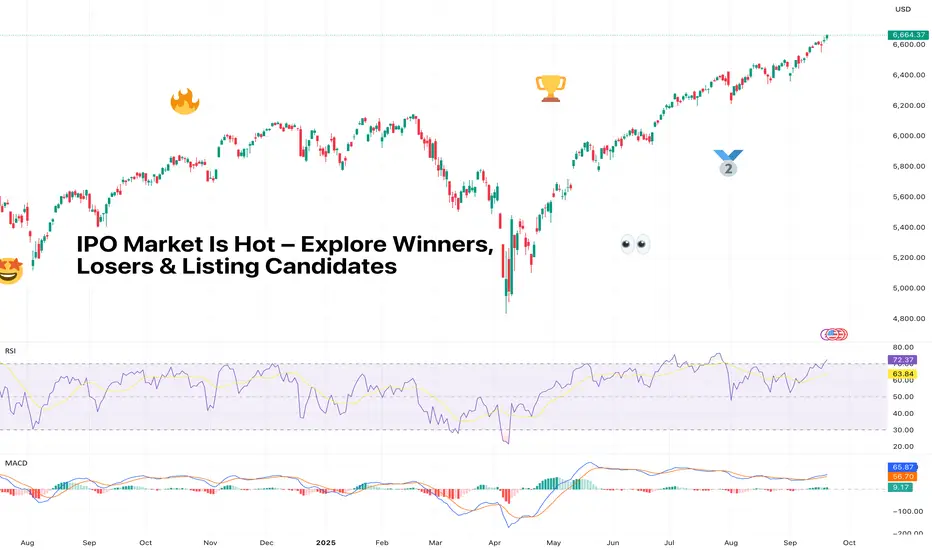
IPO Market Is Hot – Explore Winners, Losers & Listing CandidatesThe IPO market has woken up from its multi-year nap and is now in beast mode. But as always, Wall Street’s hottest party comes with an entrance fee and a dose of uncertainty – opaque prices, sketchy balance sheets, and a whole lot of FOMO.
So who’s winning, who’s losing, and who’s still waiting in
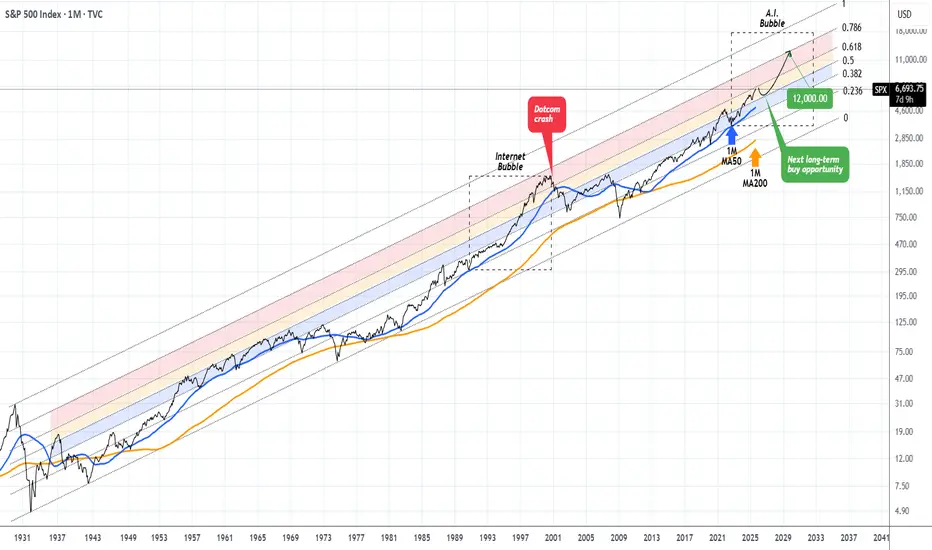
S&P500 approaching a Resistance that was last tested in 1998 !!This isn't the first time we present you this chart, in fact from time to time (usually on a quarterly basis) we like to bring this forward with some adjustments in order to help us maintain a long-term perspective.
And that technically shows the S&P500 index (SPX) trading within a century long Fib
SP500 Consolidation Higher to fresh HighsThe S&P 500 is consolidating within a strong range as U.S. stocks gained traction on Monday, extending record highs with additional support from the technology sector. Markets continue to assess the outlook for interest rates, but sentiment remains broadly positive.
The index advanced more than 0.5

Financial crisis like no other coming to the SPX V SOON!Guys, it is what it says in the title.
I don't know what will cause it.
But, some how it'll happen.
Max upside potential to 6,860$, which is nothing in comparison to max downside potential of 3,958$.
What do you think will happen to other traditional assets such as property etc ?
I am not

Hellena | SPX500 (4H): SHORT to support area of 6550.Colleagues, I am not much of a correction trader, but I have to share my opinion that the upward impulse has almost formed wave “5” and now it would still be logical to expect a correction.
I believe that first the price will update the local maximum in the resistance area of 6759, then we will see

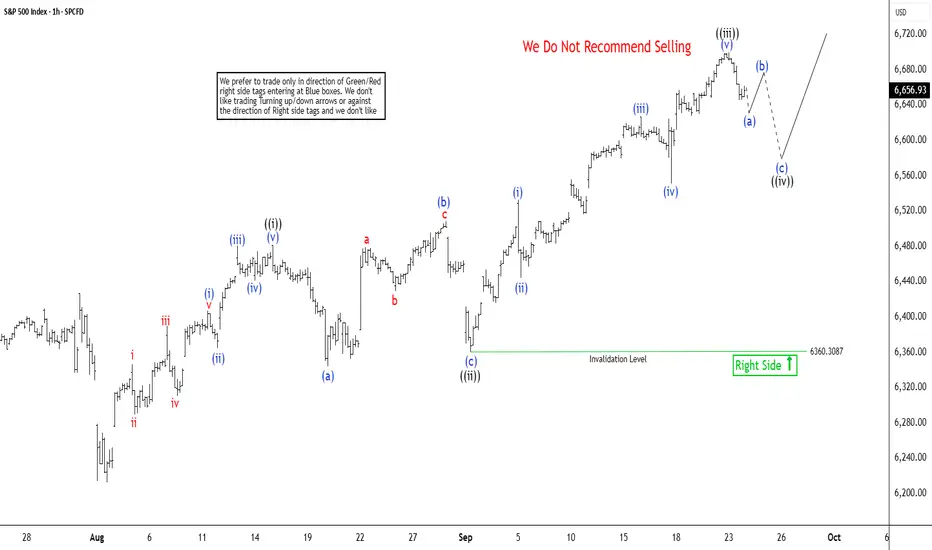
S&P 500 (SPX) Remains Bullish and Should See Support in 3, 7, 11The short-term Elliott Wave analysis for the S&P 500 (SPX) indicates that the cycle starting from the August 2, 2025 low is unfolding as a five-wave structure. From that low, wave ((i)) concluded at 6481.34. The subsequent pullback in wave ((ii)) developed as a running flat Elliott Wave pattern. In
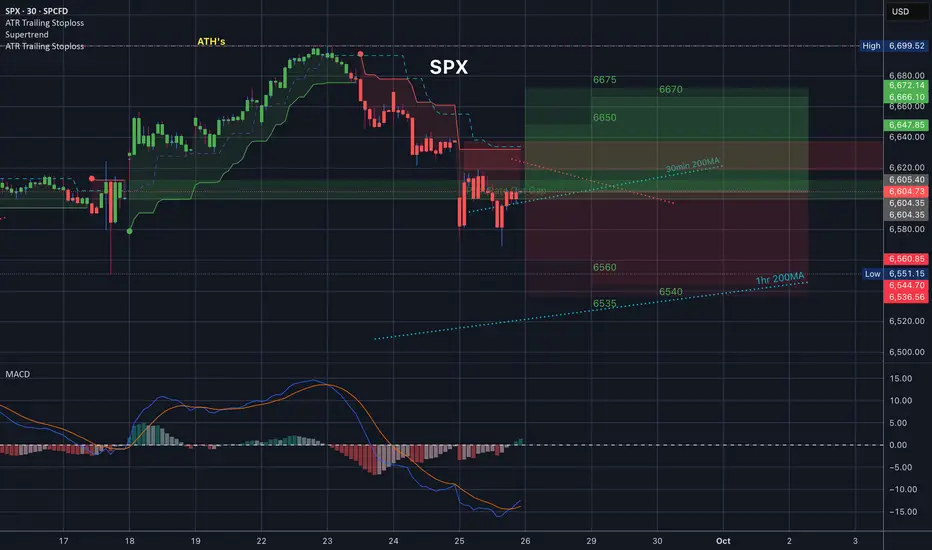
$SPX Tomorrow’s Trading Range 9.26.25
This is tomorrow’s trading range for SPX - Look at that Island gap in the upper part. What do you think? End of the rally?
Rates were cut, equities are overvalued and it’s time to reverse this beast. Just my opinion - trade the chart not my opinion.
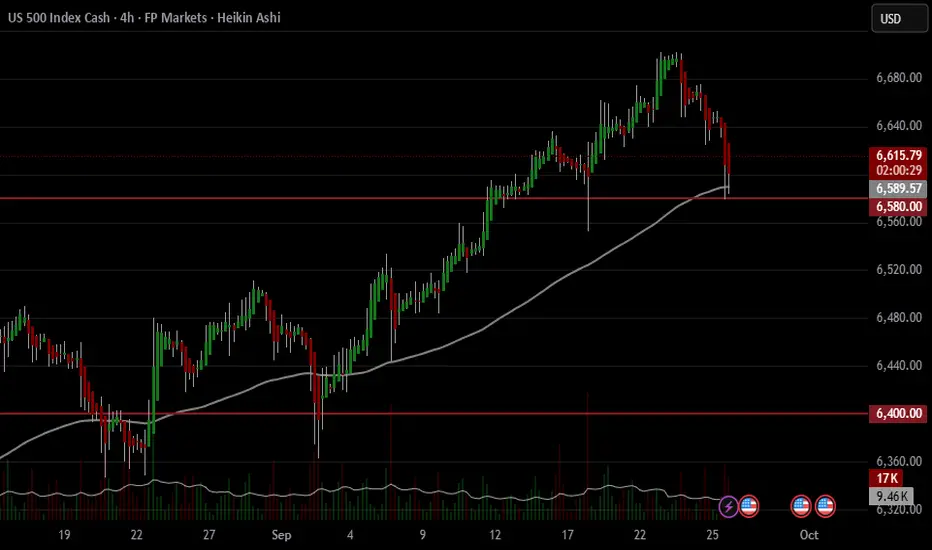
US500 Rally end?The S&P 500 is at a key moment right now, testing the 6580 support area after a sharp pullback from recent highs.
In my view, if this level breaks decisively with strong selling pressure, the market could head toward the 6400 zone, which has acted as an important support area in the past.
As long
See all ideas
Displays a symbol's price movements over previous years to identify recurring trends.
Frequently Asked Questions
US SP 500 CFD reached its highest quote on Sep 23, 2025 — 6,698.9 USD. See more data on the US SP 500 CFD chart.
The lowest ever quote of US SP 500 CFD is 1,264.1 USD. It was reached on Jun 3, 2012. See more data on the US SP 500 CFD chart.
US SP 500 CFD is just a number that lets you track performance of the instruments comprising the index, so you can't invest in it directly. But you can buy US SP 500 CFD futures or funds or invest in its components.