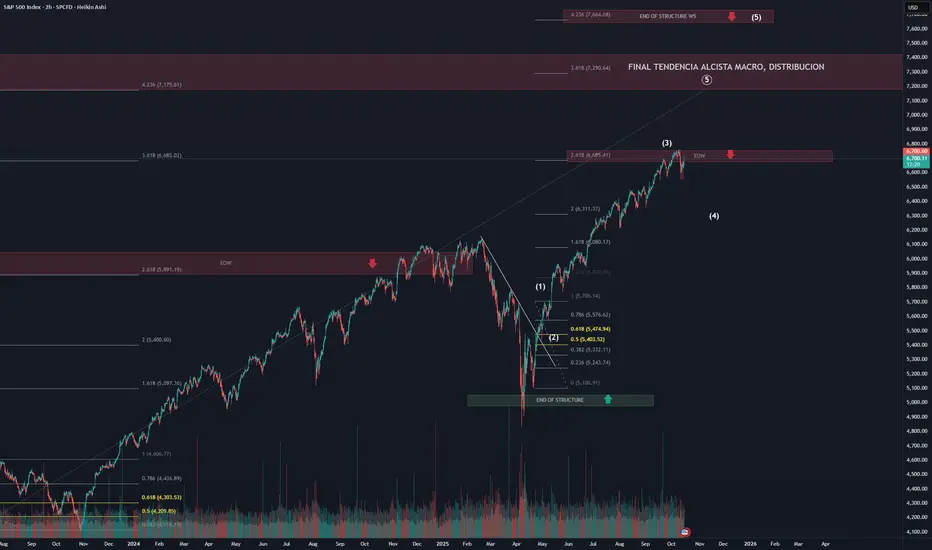
SPX Bullish Trend / Elliot analysisOur analysis of this index suggests that we are currently in the development of a Wave 4 (W4) within the last bullish substructure of the macro fifth wave, where, in the long term, we could potentially see the end of the trend between the 7100 and 7600 levels.
At the moment, the price appears to be moving within the final substructure, which seems about to begin a Wave 4 (W4) correction.
💡 This is just my opinion — always remember to do your own analysis!
Trade ideas
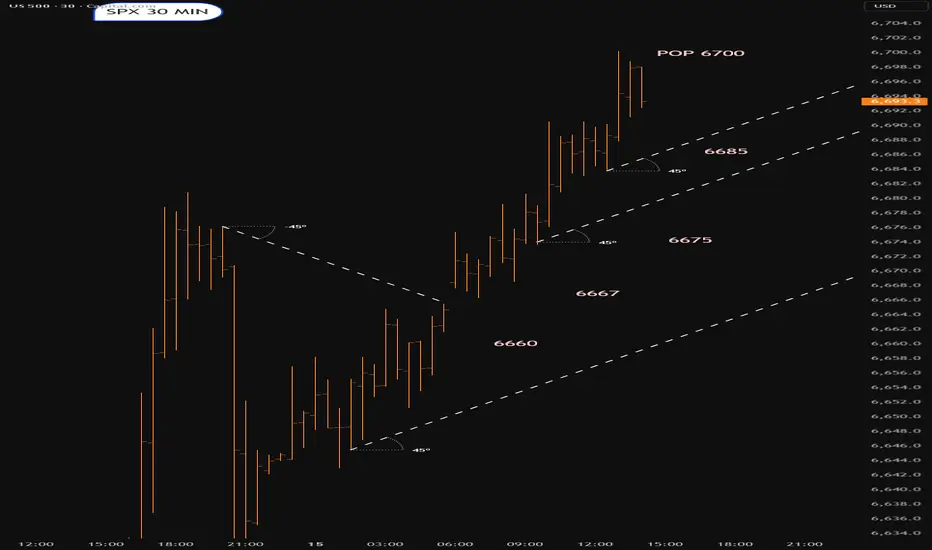
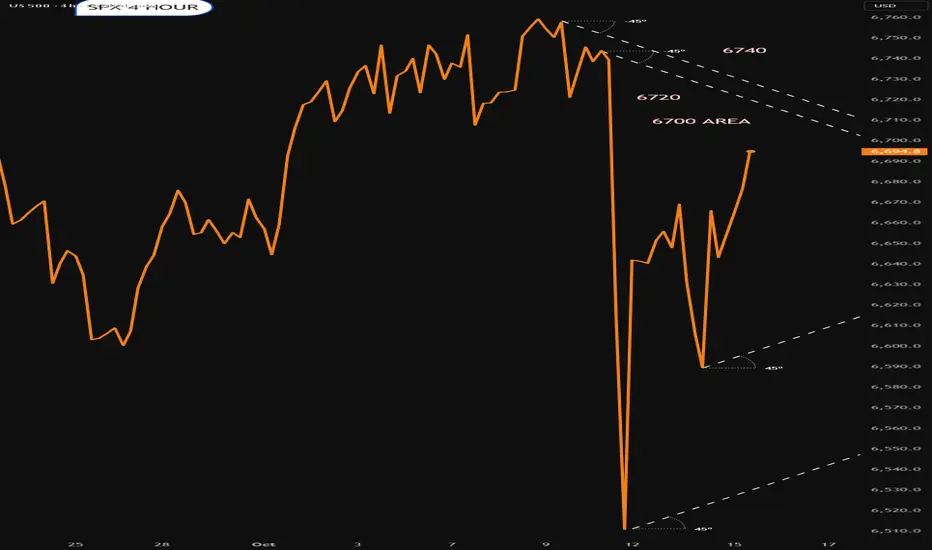
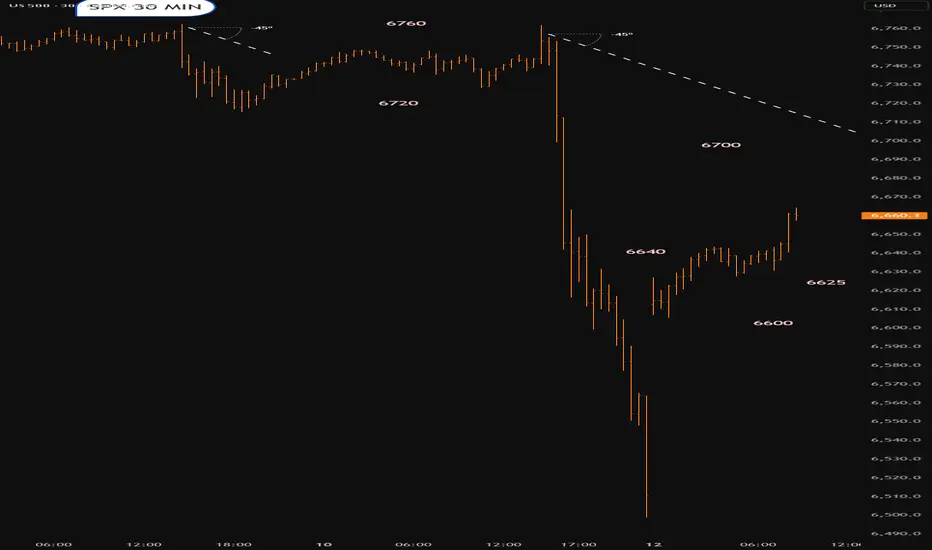
Less bars ...More tequilaGo up a timeframe.Much clearer.I have ignored a spike downwards.6700 to pop.?
S{X looking a tad over stretched/ short termCareful...Looks a tad over stretched.Could still pump though.Lets see what happens


SPX500USD | Daily Analysis #3**Yesterday Review**
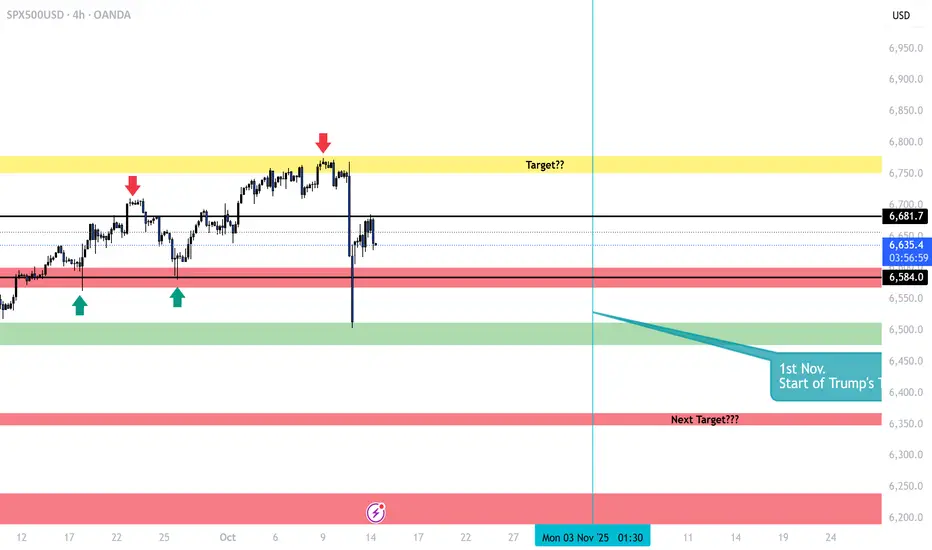
As observed, the index reacted to the 6682 zone, and news from China stating, "China will maintain tariffs until the end," fueled the market with sellers, pushing the price to the lower zone at 6584. In the morning of the New York session, it appeared that Trump realized the importance of offering a positive signal or message, or the index would suffer significantly. After a strong battle between buyers and sellers on the 1-hour timeframe, the price began to rise, driven by buying pressure.
During the middle of the New York session, Trump found an opportunity to provide some optimism, announcing a scheduled meeting with Chinese President Xi in South Korea on November 1st to discuss trade matters. (This could be a significant day.) This news contributed to a bounce, pushing the price back up to 6682.
**1-Hour & 4-Hour Timeframes**
On the 1-hour timeframe, two potential patterns are forming. One is a box range between 6682 and 6585, and the other is an upward trend channel. However, neither pattern is fully respected due to limited confirmation.
On the 4-hour timeframe (although I cannot share an image here), if you draw two lines—one starting from February 25, 2025, and the other from August 12, 2025—and extend them to the right, you'll notice a clear respect and relationship between these lines.
**Current Situation**
As of the time I am posting this analysis, the price is currently testing below the trendline, and we are awaiting a reaction. If the index, with or without further news, breaks the 6682 zone or the trendline strongly, we could expect the price to reach the 6672 zone. On the other hand, if the price respects the box or the upward trend channel, the index may find support and rise toward the 6604 area.

How Spot Forex Trading Works1. Understanding the Concept of Spot Forex Trading
Spot Forex trading, also known as spot FX, refers to the direct exchange of one currency for another at the current market rate, known as the spot price. Unlike futures or options contracts, where settlement happens at a later date, a spot transaction is settled “on the spot”, typically within two business days (T+2) for most currency pairs.
The Forex market is the largest and most liquid financial market globally, with a daily trading volume exceeding $7 trillion. It operates 24 hours a day, five days a week, allowing traders from around the world to speculate on currency price movements. Spot Forex trading forms the foundation of global currency trading, providing real-time exchange of currencies between participants such as banks, corporations, investors, and retail traders.
2. The Participants in the Spot Forex Market
The Spot Forex market involves multiple participants who trade for different purposes:
Central Banks – Manage currency reserves, stabilize exchange rates, and implement monetary policies.
Commercial Banks and Financial Institutions – Facilitate interbank trading and currency exchange for clients.
Multinational Corporations – Exchange currencies for international trade and investment purposes.
Hedge Funds and Investment Firms – Engage in speculative trading to profit from currency fluctuations.
Retail Traders – Individuals using online platforms to speculate on short-term price movements.
Each participant contributes to market liquidity, influencing price dynamics based on supply and demand.
3. Currency Pairs and Price Quotation
In the Forex market, currencies are always traded in pairs, such as EUR/USD, GBP/JPY, or USD/INR. The first currency is the base currency, and the second is the quote currency.
The price quote represents how much of the quote currency is required to buy one unit of the base currency. For example, if EUR/USD = 1.0900, it means 1 Euro = 1.09 US Dollars.
Each pair has:
Bid Price – The price at which the market (or broker) is willing to buy the base currency.
Ask Price – The price at which the market (or broker) is willing to sell the base currency.
The difference between these two is called the spread, which represents the broker’s commission or transaction cost.
4. How Spot Forex Transactions Are Executed
Spot Forex trading operates through over-the-counter (OTC) networks rather than centralized exchanges. When a trader places a buy or sell order on a trading platform, the broker executes it through liquidity providers or the interbank market.
For instance, if a trader buys EUR/USD, they are effectively buying Euros while selling US Dollars at the current spot rate. The transaction is typically settled within T+2 days, though in practice, many brokers offer rolling spot contracts, which are automatically extended daily for speculative purposes.
Execution types include:
Market Orders – Executed instantly at the best available price.
Limit Orders – Executed when the market reaches a specified price level.
Stop Orders – Triggered when the price crosses a set threshold to limit losses or capture breakouts.
5. The Role of Leverage in Spot Forex Trading
Leverage is one of the most distinctive features of the Forex market. It allows traders to control large positions with relatively small amounts of capital. For example, a 1:100 leverage ratio means that a trader can control a $100,000 position with only $1,000 of margin.
While leverage amplifies potential profits, it also magnifies losses, making risk management essential. Professional traders typically use moderate leverage and implement stop-loss mechanisms to protect against adverse movements.
Regulators in different regions impose varying limits on leverage — for example, 1:30 in the EU (ESMA regulations) and 1:50 in the US.
6. Determinants of Spot Forex Prices
Spot exchange rates are influenced by numerous macroeconomic, geopolitical, and technical factors:
Interest Rate Differentials: Higher interest rates attract foreign capital, boosting demand for the currency.
Economic Indicators: GDP growth, employment data, inflation, and trade balances affect currency valuation.
Central Bank Policies: Monetary tightening or loosening directly impacts currency strength.
Political Stability: Political risk or uncertainty weakens investor confidence, depreciating the currency.
Market Sentiment and Speculation: Traders’ collective expectations drive short-term fluctuations.
Global Events: Wars, pandemics, and natural disasters can trigger volatility across the Forex market.
In short, Forex prices are a reflection of global economic health and investor confidence.
7. Profit and Loss Calculation in Spot Forex
The profit or loss in a spot Forex trade is determined by the change in exchange rate between the time the position is opened and closed.
For example, if a trader buys EUR/USD at 1.0900 and sells it later at 1.1000, they gain 100 pips (the fourth decimal point represents a pip in most pairs).
Profit calculation formula:
Profit (USD)
=
Pip Movement
×
Lot Size
×
Pip Value
Profit (USD)=Pip Movement×Lot Size×Pip Value
For a standard lot (100,000 units), one pip in EUR/USD equals $10. Thus, a 100-pip move equals $1,000 profit.
Conversely, if the trade moves against the trader, losses occur at the same rate. Hence, understanding position sizing and pip value is crucial for effective risk management.
8. Settlement and Delivery in Spot Forex
While traditional spot Forex transactions involve physical delivery of currencies within two business days, retail traders rarely take delivery. Instead, brokers provide contract-based trading that simulates real exchange but is settled through cash differences in profit or loss.
For institutional participants, however, settlement occurs through systems like CLS (Continuous Linked Settlement), which eliminates settlement risk by synchronizing payments between major financial institutions globally.
Thus, while the spot market technically implies immediate delivery, in practice, most participants engage for speculative or hedging purposes without currency delivery.
9. Risk Management in Spot Forex Trading
Spot Forex trading carries inherent risks due to volatility, leverage, and unpredictable global events. To mitigate these, traders adopt structured risk management strategies:
Stop-Loss and Take-Profit Orders – Automatically close positions at predefined levels to control losses or lock in profits.
Position Sizing – Limiting trade size relative to account equity, often 1–2% per trade.
Diversification – Avoiding concentration in one currency pair or region.
Economic Calendar Monitoring – Tracking major events like central bank meetings and GDP releases to anticipate volatility.
Technical and Fundamental Analysis – Combining chart patterns with macroeconomic insights to make informed decisions.
Effective risk management ensures long-term sustainability and consistent returns in the Forex market.
10. Advantages and Challenges of Spot Forex Trading
Advantages:
High Liquidity: Tight spreads and minimal slippage due to massive global participation.
24/5 Availability: Traders can operate across global time zones without limitation.
Low Entry Barriers: Retail traders can start with small capital using micro or mini accounts.
Leverage Access: Enables higher market exposure with limited funds.
No Centralized Exchange: Global accessibility through OTC trading networks.
Challenges:
High Volatility: Sharp fluctuations can trigger significant losses.
Leverage Risk: Over-leveraging can wipe out accounts quickly.
Information Overload: Constant economic updates require active monitoring.
Broker Reliability: Unregulated brokers pose counterparty risks.
Psychological Pressure: Emotional control is essential for success in a fast-paced market.
Despite these challenges, spot Forex trading remains one of the most popular avenues for both institutional and retail investors due to its liquidity, flexibility, and potential for profit.
Conclusion
Spot Forex trading represents the core of the global currency market, enabling participants to exchange currencies directly at real-time rates. Its structure—comprising major participants, dynamic pricing, leverage, and decentralized execution—creates immense opportunities and risks alike. Understanding how the market functions, the economic forces behind exchange rates, and effective risk management techniques is crucial for success. Whether used for speculation, hedging, or international trade, the Spot Forex market remains a cornerstone of global finance, reflecting the heartbeat of the world’s economic and political landscape.
S&P500 Volatility remains elevated, ahead of earnings resultsMonday’s Rally Recap:
The S&P 500 rebounded strongly, recovering over half of Friday’s losses. The main driver was more positive trade rhetoric, with signs the US is open to compromise—softening the tone from Friday’s comments.
A secondary boost came from AI optimism, as OpenAI signed a major chip deal with Broadcom (+9.88%), lifting tech sentiment.
Current Market Setup:
Despite Monday’s gains, S&P 500 futures are down -0.38% this morning, as:
US-China tensions escalated again—China sanctioned US units of a Korean shipping giant, a counter to US trade pressure.
Market volatility persists, with the dollar and Treasuries rising, and oil pulling back.
Government shutdown enters Day 14, disrupting IPO timelines and withholding macroeconomic data, adding uncertainty.
Focus Ahead:
The start of US earnings season today is crucial: JPMorgan, Goldman Sachs, Wells Fargo, BlackRock, Citigroup, and Johnson & Johnson all report. Their results will likely set the tone for Q4 expectations and influence near-term direction.
Underneath market movements, there's a sense of longer-term repricing as investors hedge against policy uncertainty and inflation ("debasement trade").
Bottom Line for S&P 500:
Volatility remains elevated. Monday’s rebound was fueled by sentiment, but renewed geopolitical risk, lack of macro data, and earnings uncertainty are keeping futures under pressure today. Market likely to trade cautiously until earnings results provide clearer direction.
Key Support and Resistance Levels
Resistance Level 1: 6680
Resistance Level 2: 6703
Resistance Level 3: 6728
Support Level 1: 6547
Support Level 2: 6522
Support Level 3: 6487
This communication is for informational purposes only and should not be viewed as any form of recommendation as to a particular course of action or as investment advice. It is not intended as an offer or solicitation for the purchase or sale of any financial instrument or as an official confirmation of any transaction. Opinions, estimates and assumptions expressed herein are made as of the date of this communication and are subject to change without notice. This communication has been prepared based upon information, including market prices, data and other information, believed to be reliable; however, Trade Nation does not warrant its completeness or accuracy. All market prices and market data contained in or attached to this communication are indicative and subject to change without notice.

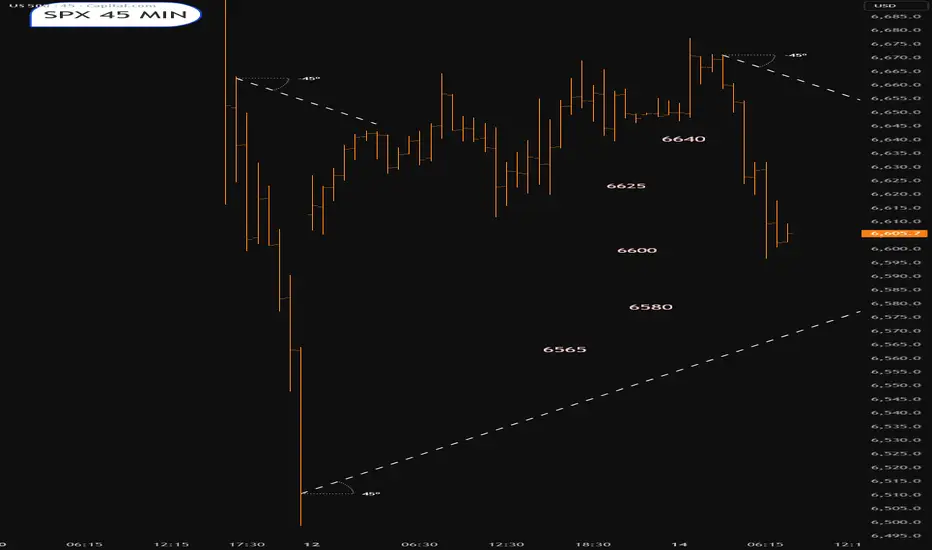
SPX into the Euro open.Tuesday 14th OctoberPoss supp area 6565-6600 looming
66400 seems to be some swearing and fighting
SPX | Daily Analysis #2Hello and welcome back to DP,
**Review and News**
Yesterday, at the start of the week, the SPX opened with a significant upside gap, largely driven by a tweet from former President Trump on Friday. His statement—"Don’t worry about China and Xi, they don’t want a recession for their economy, and neither do we"—helped restore investor confidence, pushing them back into the market, particularly into this index. However, shortly after, Trump reiterated that tariffs would still be implemented on November 1st, which is expected to have a considerable impact.
This morning, President Xi reaffirmed his stance, saying, "China will fight to the end, but the doors for negotiation are always open." As seen on the chart, the price has moved within a range between $6,681 and $6,584.
**4-Hour Price Action**
As indicated by the chart, the price range between $6,681 and $6,584 seems to be holding steady for now. One scenario suggests the market is in a consolidation phase. The shape of this consolidation will depend on the future performance of the market. It could either form a diagonal pattern or remain within a box range, as investors battle against short-sellers.
Using Fibonacci retracement, it appears the price may extend to the 0.236 line at $6,706. If this Fibonacci level holds, the market could face a downturn, potentially targeting the next support level indicated by the red box below the chart.
**Trend Analysis**
As shown, the trend illustrates a clear relationship with price movement. The price opened above the trend line, then expanded below the next trend level, showing respect for it. This movement suggests that downward pressure remains, with the market's direction depending on the break of the current trend line.
Personally , I believe the market may head south, but it won’t be a straightforward move. The decline could be unpredictable and happen quickly, or it may unfold in more gradual, choppy moves. One thing to be certain of is that retail traders are betting against the market, mainly due to the gap being filled. However, caution is advised when trading this index. It’s important to wait for confirmation before making any decisions.
SNP500 short uptick and quick downfallZeusExodus
As the marked upticks close to 7k levels it will drop about 10% that will mark the lowest point on July 11th.
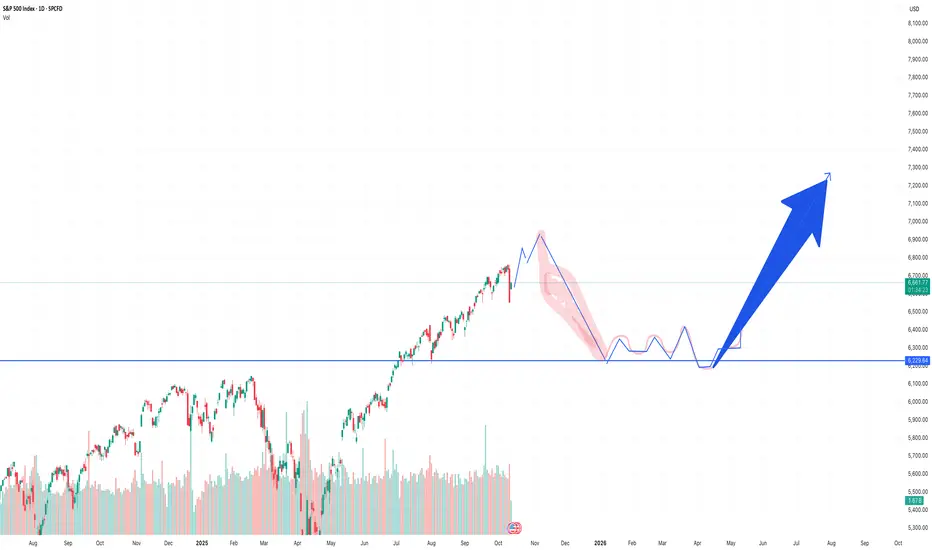
SP500 path forward: volatility and retest of previous highsAssuming that previous patterns continue, and they may not, the SP500 will eventually retest its previous new highs, but likely not in the near future, short of a volatility event.
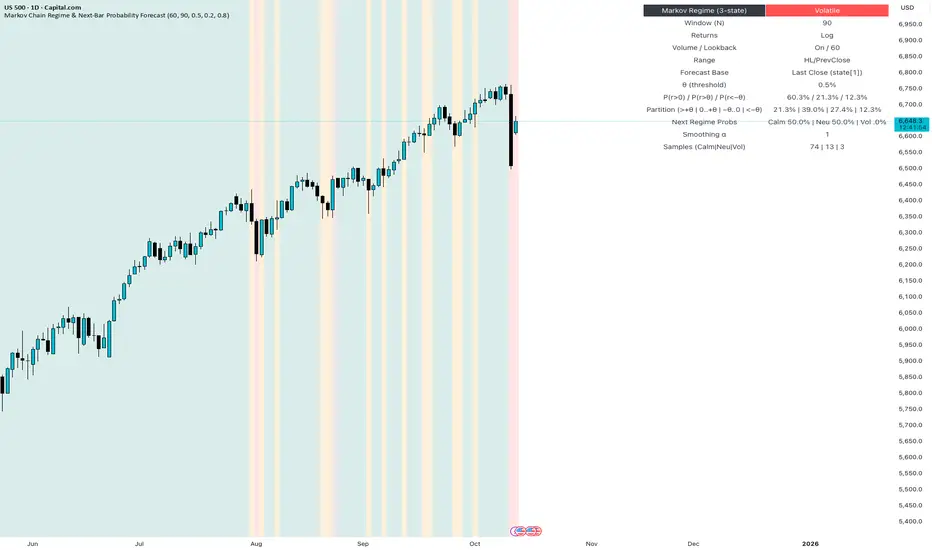
HOW-TO: Forecast Next-Bar Odds with Markov ProbCast🎯 Goal
In 5 minutes, you’ll add Markov ProbCast to a chart, calibrate the “big-move” threshold θ for your instrument/timeframe, and learn how to read the next-bar probabilities and regime signals
(🟩 Calm | 🟧 Neutral | 🟥 Volatile).
🧩 Add & basic setup
Open any chart and timeframe you trade.
Add Markov ProbCast — P(next-bar) Forecast Panel from the Public Library (search “Markov ProbCast”).
Inputs (recommended starting point):
• Returns: Log
• Include Volume (z-score): On (Lookback = 60)
• Include Range (HL/PrevClose): On
• Rolling window N (transitions): 90
• θ as percent: start at 0.5% (we’ll calibrate next)
• Freeze forecast at last close: On (stable readings)
• Display: leave plots/partition/samples On
📏 Calibrate θ (2-minute method)
Pick θ so the “>+θ” bucket truly flags meaningful bars for your market & timeframe. Try:
• If intraday majors / large caps: θ ≈ 0.2%–0.6% on 1–5m; 0.3%–0.8% on 15–60m.
• If high-vol crypto / small caps: θ ≈ 0.5%–1.5% on 1–5m; 0.8%–2.0% on 15–60m.
Then watch the Partition row for a day: if the “>+θ” bucket is almost never triggered, lower θ a bit; if it’s firing constantly, raise θ. Aim so “>+θ” captures move sizes you actually care about.
📖 Read the panel (what the numbers mean)
• P(next r > 0) : Directional tilt for the very next candle.
• P(next r > +θ) : Odds of a “big” upside move beyond your θ.
• P(next r < −θ) : Odds of a “big” downside move.
• Partition (>+θ | 0..+θ | −θ..0 | <−θ): Four buckets that ≈ sum to 100%.
• Next Regime Probs : Chance the market flips to 🟩 Calm / 🟧 Neutral / 🟥 Volatile next bar.
• Samples : How many historical next-bar examples fed each next-state estimate (confidence cue).
Note: Heavy calculations update on confirmed bars; with “Freeze” on, values won’t flicker intrabar.
📚 Two practical playbooks
Breakout prep
• Watch P(next r > +θ) trending up and staying elevated (e.g., > 25–35%).
• A rising Next Regime: Volatile probability supports expansion context.
• Combine with your trigger (structure break, session open, liquidity sweep).
Mean-reversion defense
• If already long and P(next r < −θ) lifts while Volatile odds rise, consider trimming size, widening stops, or waiting for a better setup.
• Mirror the logic for shorts when P(next r > +θ) lifts.
⚙️ Tuning & tips
• N=90 balances adaptivity and stability. For very fast regimes, try 60; for slower instruments, 120.
• Keep Freeze at close on for cleaner alerts/decisions.
• If Samples are small and values look jumpy, give it time (more bars) or increase N slightly.
🧠 Why this works (the math, briefly)
We learn a 3-state regime and its transition matrix A (A = P(Sₜ₊₁=j | Sₜ=i)), estimate next-bar event odds conditioned on the next state (e.g., q_gt(j)=P(rₜ₊₁>+θ | Sₜ₊₁=j)), then forecast by mixing:
P(event) = Σⱼ A · q(event | next=j).
Laplace/Beta smoothing, per-state sample gating, and unconditional fallbacks keep estimates robust.
❓FAQ
• Why do probabilities change across instruments/timeframes? Different volatility structure → different transitions and conditional odds.
• Why do I sometimes see “…” or NA? Not enough recent samples for a next-state; the tool falls back until data accumulate.
• Can I use it standalone? It’s a context/forecast panel—pair it with your entry/exit rules and risk management.
📣 Want more?
If you’d like an edition with alerts , σ-based θ, quantile regime cutoffs, and a compact ribbon—or a full strategy that uses these probabilities for entries, filters, and sizing—please Like this post and comment “Pro” or “Strategy”. Your feedback decides what we release next.
SPX for October 13thOversold not unwound as yet.6700-6720 will test the bulls.Buyers will want it to stay above 6600
Us500 sellsUS 500 is in a clear bearish downtrend and we are waiting for that important key level to hit so we short

Trading Crude Oil and the Geopolitical Impact on Prices1. The Basics of Crude Oil Trading
Crude oil trading involves buying and selling contracts that represent the value of oil, typically through futures, options, and spot markets. The two most widely used benchmarks are:
West Texas Intermediate (WTI): A light, sweet crude primarily produced in the United States.
Brent Crude: Extracted from the North Sea, it serves as the global benchmark for oil pricing.
Oil prices are determined by a combination of market fundamentals (supply and demand), speculative activities, and geopolitical factors. Traders use various tools to forecast price movements, such as analyzing OPEC reports, inventory levels, and global economic data.
The key players in oil trading include:
Oil-producing countries and national oil companies (e.g., Saudi Aramco, Rosneft).
International oil corporations (e.g., ExxonMobil, BP, Shell).
Financial institutions and hedge funds.
Retail traders and investors trading oil futures or ETFs.
2. Geopolitical Factors Influencing Crude Oil Prices
Oil is not merely a commodity; it is a strategic resource. This makes it extremely sensitive to political instability, war, sanctions, and diplomatic decisions. Some of the major geopolitical influences on crude oil prices include:
a. Conflicts in Oil-Producing Regions
Most of the world’s oil reserves are located in politically volatile regions like the Middle East, Africa, and parts of South America. Any conflict in these areas can lead to supply disruptions or fears of shortage, pushing prices higher.
For example:
The Iraq War (2003) caused Brent crude prices to spike above $40 per barrel, reflecting fears of supply disruptions.
The Yemen conflict and attacks on Saudi Aramco facilities in 2019 led to a sudden 15% increase in global oil prices within a day.
Traders closely monitor these developments because they directly affect production, transportation, and export capacities.
b. OPEC and OPEC+ Decisions
The Organization of the Petroleum Exporting Countries (OPEC), along with its allies (OPEC+), plays a critical role in controlling global oil supply. Decisions regarding production quotas can dramatically alter prices.
For instance:
When OPEC decided to cut output in 2016 to stabilize prices, Brent crude rose from around $30 to over $50 per barrel within months.
In contrast, during the 2020 price war between Saudi Arabia and Russia, oil prices collapsed, with WTI even turning negative briefly.
Geopolitical alliances and disagreements within OPEC+ remain a major source of price volatility.
c. Sanctions and Trade Restrictions
Economic sanctions imposed on oil-producing nations can limit their ability to export crude, tightening global supply and raising prices.
Prominent examples include:
Iranian oil sanctions by the U.S., which have repeatedly affected global oil markets.
Sanctions on Russia following the invasion of Ukraine in 2022, which drastically reduced its oil exports to Europe, causing a surge in global prices.
In such situations, traders speculate on potential supply shortages, leading to sharp movements in futures contracts.
d. Strategic Petroleum Reserves (SPR) Releases
Governments, especially major consumers like the U.S., China, and India, maintain strategic reserves of oil to cushion against supply disruptions. When tensions rise or prices spike, these countries may release oil from reserves to stabilize markets.
For example, in 2022, the U.S. released millions of barrels from its SPR to counter rising prices after the Russia-Ukraine conflict. While these releases provide short-term relief, they rarely alter long-term price trends unless accompanied by broader policy shifts.
e. Global Alliances and Energy Policies
Energy policies and diplomatic relations also play a huge role. Countries may enter alliances to secure stable oil supplies or diversify their sources. For instance:
The China-Russia energy partnership has reshaped global oil trade patterns.
The U.S. shale revolution reduced American dependence on Middle Eastern oil, altering geopolitical power balances.
3. Case Studies: How Geopolitics Moves Oil Markets
Case 1: The Russia-Ukraine War (2022–Present)
This conflict caused one of the most dramatic spikes in oil prices in recent history. Russia, being one of the largest oil and gas exporters, faced severe sanctions from Western nations. As a result:
Brent crude surged above $120 per barrel.
European nations scrambled to find alternative suppliers.
Energy inflation soared globally, contributing to a global economic slowdown.
This case shows how a single geopolitical event can alter supply chains, trade routes, and investment flows within weeks.
Case 2: The Middle East Tensions
Recurring tensions between Iran, Saudi Arabia, and Israel have historically shaken oil markets. The closure threats of the Strait of Hormuz, through which nearly 20% of global oil passes, are particularly alarming for traders. Even rumors of blockade or military action lead to speculative buying and price hikes.
Case 3: The U.S. Shale Boom
While not a “conflict,” the rise of shale oil production in the United States changed global geopolitics. By 2018, the U.S. became the world’s largest oil producer, reducing its dependency on OPEC and reshaping global energy diplomacy. This led to more competitive pricing, strategic shifts in OPEC policies, and a new era of price volatility.
4. Trading Strategies During Geopolitical Uncertainty
Professional traders and investors employ various strategies to navigate geopolitical risks in oil markets:
a. Hedging
Companies involved in energy-intensive industries use futures and options to hedge against price fluctuations. For example, airlines lock in fuel prices to avoid losses due to sudden price spikes.
b. Speculative Trading
Traders often capitalize on volatility triggered by geopolitical news. They use tools like technical analysis, sentiment indicators, and futures spreads to predict short-term price movements.
c. Diversification
Investors may diversify their portfolios across different commodities or asset classes (such as gold, natural gas, or renewable energy stocks) to reduce exposure to oil market volatility.
d. Monitoring News and Reports
Geopolitical events unfold rapidly. Traders rely on real-time news, OPEC bulletins, and government reports to make quick decisions. Platforms like Bloomberg, Reuters, and TradingView offer live analysis tools tailored to geopolitical risks.
5. The Role of Speculation and Market Psychology
In modern oil markets, perception often drives prices as much as actual supply-demand data. A threat of conflict or a statement by a political leader can move prices instantly, even before any tangible disruption occurs.
For instance:
Tweets from policymakers or rumors of sanctions can trigger algorithmic trading activity.
Fear of shortages leads to speculative buying, amplifying price rallies.
Conversely, peace agreements or ceasefires often trigger sell-offs.
This behavior shows how market psychology magnifies geopolitical effects, making oil one of the most sentiment-driven commodities.
6. Global Economic Impact of Oil Price Volatility
Oil prices affect every sector of the global economy. The consequences of geopolitical-driven price swings are far-reaching:
Inflation: Higher oil prices raise transportation and manufacturing costs, leading to overall inflation.
Currency Fluctuations: Oil-exporting countries benefit from stronger currencies during price spikes, while import-dependent economies face weakening currencies.
Stock Markets: Rising oil prices often pressure equities in energy-dependent industries but benefit oil producers.
Interest Rates: Central banks may adjust interest rates in response to energy-driven inflation.
Trade Balances: Nations that import large volumes of oil, like India and Japan, experience worsening trade deficits when oil prices rise.
Thus, geopolitical disruptions in the oil market can reshape global financial stability.
7. The Transition to Renewable Energy and Future Outlook
As the world moves toward renewable energy, the geopolitical landscape of oil is slowly shifting. However, oil remains indispensable in global energy consumption. Despite rising investments in solar and wind, oil still accounts for over 30% of the world’s primary energy supply.
In the future:
Energy diversification may reduce the geopolitical leverage of major oil producers.
Green energy policies in the U.S., EU, and China may dampen long-term oil demand.
Yet, short-term volatility driven by geopolitics is likely to persist as conflicts and alliances evolve.
Furthermore, the rise of electric vehicles (EVs) and energy storage technologies will reshape demand patterns. However, developing economies will continue to rely heavily on oil for decades, ensuring that geopolitical influences remain potent.
8. Conclusion
Trading crude oil is not merely a financial activity—it is a reflection of global power dynamics, politics, and economic interests. The intricate relationship between geopolitical events and oil prices ensures that traders must constantly monitor global developments, from military conflicts to OPEC meetings.
Key takeaways:
Oil is both an economic and political weapon.
Geopolitical instability often leads to supply fears and price surges.
Sanctions, wars, and alliances directly impact trading strategies and market psychology.
Understanding global events is essential for successful crude oil trading.
In essence, geopolitics is the invisible hand that moves the oil market. Whether it’s a conflict in the Middle East, sanctions on Russia, or production decisions in OPEC+, each event creates ripples across global trade and financial markets. For traders, mastering the art of interpreting these events is the key to navigating the world’s most volatile and influential commodity—crude oil.
The S&P500 paused on AI valuation concerns and trade fears
The US equity rally, driven by optimism over AI momentum, Fed rate-cut expectations, and solid consumer data, lost steam after President Trump’s combative remarks toward China. Delta Air Lines beat 3Q estimates with profit up 4.1% YoY and EPS at 1.71 USD, while Costco’s (COST) Sep sales rose 8% YoY, underscoring resilient US consumption. However, Trump’s threat of steep tariff hikes triggered the S&P; 500’s sharpest one-day drop in three months.
US500 extended its sharp decline, briefly testing the support at 6530. The index broke below the ascending channel's lower bound, suggesting a potential shift toward bearish momentum. If US500 breaks below the support at 6530 again, the index may retreat toward the next support at 6420. Conversely, if US500 breaches above EMA21 and the resistance at 6700, the index may advance toward the psychological resistance at 6800.

S&P 500 Faces Earnings Test Amid Shutdown Fog and Tariff FearsStocks Face Earnings Test as S&P 500 Heads for Worst Shutdown Performance Since 1990
The S&P 500 slipped on Friday, just two days after hitting a record high, as renewed tariff fears and the ongoing U.S. government shutdown weighed on sentiment.
This week marks a key test as major Wall Street banks open the third-quarter earnings season, potentially offering direction amid what analysts call a “vacuum of government data” due to the shutdown.
On Wednesday, the S&P 500 logged its 33rd record close of 2025, even as the shutdown that began October 1 dragged on. But Trump’s threat of a “massive increase” in tariffs on Chinese imports erased gains, leaving the index down 2% since the shutdown began — its worst such stretch since 1990, per Dow Jones Market Data.
The delay of key reports like CPI inflation data has added “fog” to the market, making it harder to gauge the impact of tariffs on core prices. Still, analysts expect solid Q3 results, especially from banks, with FactSet’s John Butters noting a rare increase in EPS estimates — the first since late 2021.
Volatility Returns — But Will Investors Buy the Dip?
October, historically the most volatile month, lived up to its reputation.
Friday’s drop left traders debating whether it was triggered by Trump’s post or simply profit-taking after record highs.
S&P 500 – Technical Outlook Merging with Fundamentals
The price dropped sharply by $165 within just six hours, reflecting strong volatility driven by both technical factors and fundamental uncertainty.
From now on, market movements are expected to remain highly sensitive, especially as third-quarter earnings season begins this week — a phase that could significantly influence the indices amid the ongoing U.S. government shutdown.
Technically, a short-term correction is expected toward 6550 – 6577 before renewed bearish pressure resumes.
However, if the price closes a 4H candle below 6484, it would confirm continuation of the bearish trend toward 6450 and 6425, with further downside potential toward 6347 and 6283.
On the other hand, as long as the price trades above 6506, buyers may attempt to correct the move upward toward 6550 – 6577.
A sustained break below 6484, however, would clearly reestablish the bearish momentum.
Pivot Line: 6506
Support Levels: 6450, 6425, 6348
Resistance Levels: 6550, 6570, 6620
Summary Expectation:
Next likely direction — bearish continuation, possibly after a minor corrective pullback toward 6,570 – 6,600, unless buyers reclaim control above 6,620.

S&P 500 - Buy Zone PlanThe S&P 500 remains in a strong long-term uptrend, trading within a rising channel. After months of steady gains, price has now pulled back sharply from the top of the channel — a healthy correction within the bigger trend.
🔹 Buy Targets
• Target 1 (Buy Zone): ~6,400 – first key support near the 50 SMA
• Target 2 (Buy Zone): ~6,200 – aligning with the 100 SMA
• Target 3 (Worst Case – Buy): ~6,000 – near the 200 SMA and major trendline support
These levels represent staggered accumulation points, allowing for gradual buying if the correction deepens.
🔹 RSI View
The RSI has dropped near 40, showing a cooling-off phase. If it dips below this level, it could signal oversold conditions and mark a potential bottom.
🔹 Outlook
• The pullback looks like a gap-fill and mean reversion within the uptrend.
• I’ll look to accumulate quality U.S. stocks around these targets, focusing on strong fundamentals and large-cap names.
• The broader structure stays bullish unless the 200 SMA breaks decisively.
🧠 “Pullbacks in bull markets are opportunities, not threats.”
📜 Disclaimer: This is general information only and not financial advice. Always do your own research before investing.

SP500 4H🔹 Overall Outlook and Potential Price Movements
In the charts above, we have outlined the overall outlook and possible price movement paths.
As shown, each analysis highlights a key support or resistance zone near the current market price. The market’s reaction to these zones — whether a breakout or rejection — will likely determine the next direction of the price toward the specified levels.
⚠️ Important Note:
The purpose of these trading perspectives is to identify key upcoming price levels and assess potential market reactions. The provided analyses are not trading signals in any way.
✅ Recommendation for Use:
To make effective use of these analyses, it is advised to manually draw the marked zones on your chart. Then, on the 5-minute time frame, monitor the candlestick behavior and look for valid entry triggers before making any trading decisions.

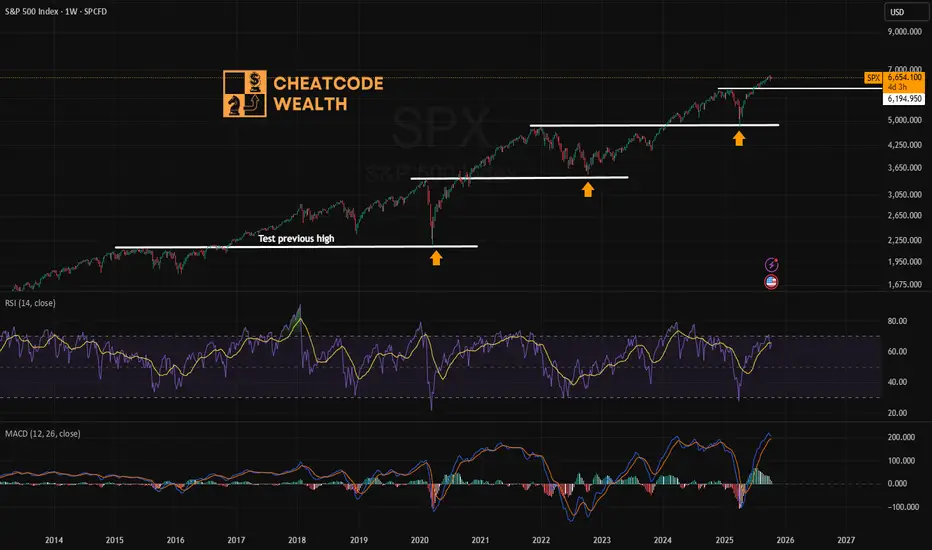
SPX Current Technical analysis of the SPX, Focus on the Stochastics, channel lines and recohnizable patterns

S&P 500 (US500) Multi-Timeframe StrategyS&P 500 (US500) Technical Analysis | October 11, 2025 UTC+4 Multi-Timeframe Strategy
Closing Price: 6,508.2 | Market Context: Trading at all-time highs with institutional accumulation evident
Market Structure Analysis
The S&P 500 demonstrates robust bullish momentum, having broken through the critical 6,500 psychological barrier. Daily chart reveals a mature impulse wave in Elliott Wave terminology (Wave 5 extension), supported by expanding volume profiles. Wyckoff analysis indicates we're in a Phase E markup following successful re-accumulation between 5,800-6,200. The Ichimoku cloud on 4H timeframe shows price trading above all components (bullish alignment), with Tenkan-sen (9-period) at 6,485 providing dynamic support. Gann analysis using the Square of 9 identifies 6,528 as the next natural resistance level, with time-price squaring suggesting October 15-17 as a potential pivot zone.
Technical Indicators Confluence
RSI (14): Daily = 68 (approaching overbought but not extreme), 4H = 71 (caution zone).
Bollinger Bands: Price riding the upper band on 4H (expansion phase), suggesting continuation with potential volatility.
VWAP Analysis: Anchored from October 1st shows strong positioning above 6,465; volume profile indicates acceptance above 6,480 with 82% bullish volume dominance. Moving Averages: Golden cross intact (50 EMA > 200 EMA by 340 points), 21 EMA at 6,470 acting as immediate support. Harmonic pattern detection reveals a potential Butterfly completion near 6,550-6,580 zone (1.272-1.618 Fibonacci extension).
Critical Levels & Pattern Recognition
Support Structure: 6,485 (Tenkan-sen + 4H demand), 6,465 (VWAP anchor), 6,440 (daily pivot + Gann 45° angle), 6,400 (psychological + Wyckoff spring test). Resistance Zones: 6,528 (Gann Square of 9), 6,550-6,580 (Butterfly PRZ + 1.618 extension), 6,620 (weekly resistance). Pattern Alert: Watch for potential bull trap formation if price spikes above 6,580 on declining volume—this would signal exhaustion. Current candlestick structure shows consistent higher highs/higher lows with no reversal patterns (no shooting stars or bearish engulfing yet).
Intraday Trading Strategy (5M-4H Charts)
BUY ZONES: Primary entry: 6,485-6,495 (confluence of Ichimoku + VWAP support) | Stop Loss: 6,465 (risk 20-30 points) | Targets: T1: 6,520 (quick scalp, 25 points), T2: 6,545 (risk-reward 1:2), T3: 6,575 (swing extension). Secondary Entry: Aggressive long on breakout above 6,528 with volume confirmation (minimum 20% above 20-period average) | Stop: 6,510 | Target: 6,565-6,580.
SELL/SHORT ZONES: Counter-trend short only if rejection at 6,580 with bearish divergence on RSI + shooting star formation | Entry: 6,575-6,585 | Stop: 6,595 | Target: 6,520, 6,485. Intraday Bias: 75% bullish until broken below 6,465.
Swing Trading Strategy (Daily-Weekly)
Position Building: Accumulate on pullbacks to 6,440-6,465 zone (25-35% position) with 4-6 day holding period | Full position stop: 6,390 (swing low violation). Profit Targets: Conservative: 6,580 (exit 50%), Aggressive: 6,650-6,720 (monthly target based on Elliott Wave projection and Gann time cycles suggesting completion by October 28-31). Risk Management: Trail stops below each daily higher low; current trail at 6,465. If price closes below 21 EMA on daily (6,470), reduce exposure by 60%. Wave Count: Currently in Wave 5 of (5) of larger degree—expect final parabolic move but prepare for 8-12% correction when complete (target retracement to 5,950-6,050 zone).
Market Context & Catalyst Watch
Geopolitical landscape shows stabilization in Middle East tensions, supporting risk-on sentiment. Fed policy remains neutral (hold position), but monitor October 17th retail sales data and October 23rd PMI releases—strong data could push us to 6,650; weak data triggers profit-taking. VIX at 13.2 (complacency zone) suggests low fear but increases gap-risk. Volume analysis critical: Declining volume on new highs would confirm distribution (Wyckoff Phase E to Phase A transition)—watch for volume 25% below 20-day average as warning signal. Institutional flow data shows continued net buying but decelerating pace.
Execution Playbook
Monday-Tuesday: Expect consolidation 6,485-6,520; ideal for range scalping. Wednesday-Thursday: Gann time window suggests volatility expansion; breakout likely. Friday: Monthly options expiry could create pinning effect near 6,500. Best trades: Long on dips to 6,485-6,495 with tight stops OR breakout long above 6,528 on volume. Avoid: Chasing above 6,550 without pullback; shorting below 6,580 without clear reversal confirmation. Risk no more than 0.5-1% account per intraday trade, 2% for swing positions. This market rewards patience at support and aggression at breakouts—trade the plan, not emotions.
