S&P Nearing Major Resistance (Update)This updates my previous S&P chart back last year showing the S&P still had room to run until any major resistance. We're nearing that major resistance at 7577. Looks like it might hit around January 2026.
The trouble is this trend is heating up and we needed a pullback to 6295. With all the excitement from Nvidia and other major Hyperscalers I'm worried it's going to just go straight to Major resistance. *If it does* we could be looking at a decently large pullback next year (finishing around August) down to that 6295 area and back into the supporting trend line for the next big uptrend to start.
If however we slow down here and get a pullback back to 6295 then I think we're good to make it over the major resistance without that big pullback next year.
Either way once we hit the major resistance at 7577 we'll need to get close to that lower trend line at some point to begin a new bull run.
Good luck and take caution as we approach this resistance!
Trade ideas

SPX500: Trump's trip to East Asia shakes marketsHello Traders,
This is the Daily Chart!!
We had great bullish year! A bullish channel is crystal clear! we are about to be considered as overbought buyers! But since it's stocks and the channel is broken, we are till bullish!!
And this is the chart of recent 3M,
1- the break is powerful.
2- we need a correction, technically.
3- we are about the mid-term channel.
4- top of the long-term channel could also be firsthand support, they call it SL hunt, I don't.

SPX | Daily Analysis #9 - 30 October 2025Hello and welcome back to DP,
Market Review:
Well, yesterday was a significant day across global markets — from U.S. stock indexes to crypto assets — with investors digesting major developments from the Federal Reserve and the renewed U.S.–China trade dialogue. The yesterday’s market summery:
- Monetary policy / central bank: The Fed’s decision to cut interest rates by 25 basis points (as expected) was overshadowed by Powell’s cautious tone about future cuts. However, optimism was tempered by comments from Jerome Powell indicating that another rate cut in December is not guaranteed. That caused some caution in the market.
- S&P 500: 6,890.59 (down ~0.30 points). Dow Jones Industrial Average: 47,632.00 (down ~74.37 points, ~0.2%). Nasdaq Composite: 23,958.47 (up ~130.98 points, ~0.5%).One of the biggest drivers: Nvidia Corporation became the first public company to reach a roughly $5 trillion market valuation, boosting the tech segment.
- Trade & geopolitics: The U.S. signalled progress in trade and industrial policy with China: comments from Donald Trump hinted at easing of some tariffs (e.g., on fentanyl-related goods) and possible cooperation on rare-earth export controls. The U.S. will reduce some tariffs on Chinese goods: for example, tariff on certain chemicals tied to fentanyl production will go from 20 % down to 10 %, and overall U.S. duties on Chinese imports shift from ~57 % to ~47 %. China agreed to resume more agricultural purchases from the U.S. (e.g., soybeans, sorghum) and to postpone export restrictions on rare earth materials for about one year.
- And for watching ahead is earnings: Big names like Apple Inc. (AAPL) and Amazon .com Inc. (AMZN) are due after market close, which could influence the market.
- The overall crypto market cap held steady near $3.2 trillion, with sentiment described as “risk-on, but wary.”
1H – 4H Technical Analysis:
As observed on the chart, price has broken below the bullish trend line and moved through yesterday’s key demand zone, signaling a potential shift in short-term momentum.
Currently, the price is declining, approaching lower demand areas. As of this analysis, SPX is retracing and may find temporary support around the 6,842 level, where a short-term rebound toward 6,877 is possible before the next move unfolds.
However, if bullish momentum fails to hold above that level, a drop through the gap zone could follow, pushing price action toward the 6,810 support region, which aligns with the next major demand zone on the 4-hour chart. This zone may serve as a stronger accumulation area for potential medium-term buyers.
From a broader perspective, the recent U.S.–China trade truce provides a fundamental tailwind for the market — a bullish catalyst that could limit downside extensions and support sentiment in the coming sessions.
It’s also notable that the S&P 500’s annual return now stands near +16 %, compared with roughly +24 % two years ago. This suggests that while growth has moderated, there remains room for further upside if macro conditions stay supportive and earnings momentum continues.
Disclaimer:
This content is for informational purposes only and does not constitute financial or investment advice. © DIBAPRISM
Amir D.Kohn

Bull Run Stumbles: S&P 500 Heads Toward a Potential Correction After a rough day on Wall Street, the S&P 500 dropped about 1.2%, pulling U.S. markets lower. But there’s more behind this fall than just profit-taking.
What’s Really Happening?
Warning Signs from Wall Street
Two top banking leaders raised caution. Morgan Stanley’s Ted Pick expects a 10–15% correction, calling it a “healthy normalization.”
Goldman Sachs’ David Solomon warned that tech stocks are showing bubble-like behavior, with prices running much faster than earnings.
AI Boom Driving Market Concentration
The AI craze and tech optimism have made a few mega-cap companies dominate the market. In fact, just 10 big tech firms now make up nearly 40% of the S&P 500’s total value, making the market more fragile.
Fed Confusion Adds to Uncertainty
The Federal Reserve is sending mixed signals — some officials talk about possible rate cuts by December, while others say rates should stay high because the economy is still strong.
Adding to the mess, a partial U.S. government shutdown has delayed key data, leaving investors and the Fed guessing about what’s really happening in the economy.
What the Chart Reveals
From a technical standpoint, the U.S. market’s rally has been nothing short of extraordinary. Since the April bottom near 4,835, the index has soared nearly 42%, touching a recent peak around 6,920 — and even gained about 12–13% before the latest (April 2025) pullback began.
But now, the momentum seems to be fading. The chart is flashing early warning signals — RSI divergence suggests that while prices made new highs, the underlying strength (momentum) did not. That often hints at a potential trend reversal.
If this weakness deepens, the index could correct swiftly by around 10%, targeting the 6,200–6,100 zone. And if the “healthy normalization” predicted by Morgan Stanley’s Ted Pick (a 15% drop) plays out, the index might slide further to around 5,700 — a level that would reset valuations to more reasonable territory after the sharp run-up.
Valuation Check
Let’s set aside all the opinions and headlines for a moment and focus on the key valuation metrics that truly help us understand the real picture of the U.S. market.
The Price-to-Earnings (P/E) Ratio — The Market’s Mood Meter
P/E Ratio = Current Market Price/Earnings Per Share (EPS)
So, Current Market Price = P/E Ratio*EPS
Currently, the S&P 500’s P/E ratio stands at 30.8x, with an EPS of $222.5.
When you multiply the two — 30.8 × 222.5 = roughly $6,800 — it perfectly aligns with the index’s recent market level.
Now, to find out what the fair value of the market should be, let’s use the 5-year median P/E ratio, which is around 25.4x.
Fair Market Price = 25.4*222.5 = 6,650.
This aligns perfectly with the technical chart levels, suggesting that a 15% correction would be a healthy pullback to help cool down the overheated U.S. market.
The Buffett Indicator — Market Cap vs. GDP
One of Warren Buffett’s favorite valuation tools compares the total U.S. stock market capitalization to the country’s GDP — essentially measuring how large the market has grown relative to the real economy.
At present, this ratio stands at around 224%, far above the long-term fair value range of 100–120%. Even when compared to its 5-year median level of 192%, the market still appears significantly overvalued.
To return to its median level, the ratio would need to drop by roughly:
100 = 16.6%
That’s roughly a 15–16% correction, which again perfectly aligns with both the technical chart signals and Ted Pick’s projection of a healthy market normalization.
The Bottom Line
The U.S. market’s extraordinary rally has been built on a mix of AI optimism, liquidity hopes, and investor euphoria, but the fundamentals are starting to whisper caution.
Both valuation metrics and technical signals point to the same conclusion — the market is stretched, and a 10–15% correction wouldn’t be a disaster; it would be a return to balance.
History shows that every overheated bull run needs a pause — not to end the story, but to give it a stronger foundation.
So if the coming months bring some red on the screen, smart investors will see it not as fear, but as the market taking a deep breath before its next big move.

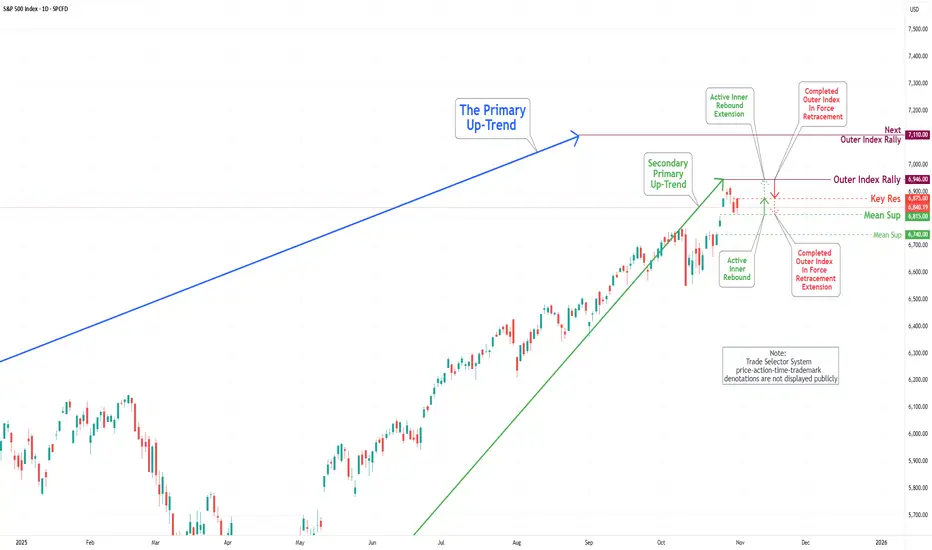
S&P 500 Daily Chart Analysis For Week of Oct 31, 2025Technical Analysis and Outlook:
During the recent trading session, the S&P 500 Index continued its wild ride, highlighting the importance of our key target, which stands as an Outer Index Rally at 6946. Fluctuations between the Mean Support at 6815 and the Key Resistance at 6875 serve as a crucial threshold for market participants. This positioning suggests the potential for further upward momentum, as the prevailing trend indicates a well-structured Active Inner Rebound extension toward the target stated above.
Nevertheless, it is essential to acknowledge the possibility of a sustained and gradual pullback within the current Active Inner Rebound zone. Such a pullback may retest the Mean Support at 6815 and could decline further to the Mean Support at 6740 before ultimately resuming an upward trajectory.
S&P500 pullback reaching pivotal zone at 6748The S&P 500 (+0.17%) eked out a small gain yesterday, but market breadth remained weak. The Magnificent 7 (+1.18%) continued to drive performance while the S&P 500 ex-Mag 7 (-0.30%) and equal-weighted index (-0.30%) both declined, highlighting the narrow leadership.
The main positive driver came from another AI-related deal—Amazon’s partnership with OpenAI, which boosted sentiment in large-cap tech. However, overall momentum was capped by soft economic data, hawkish Fed commentary, and concerns around a prolonged U.S. government shutdown, now matching the longest on record and set to surpass it by midnight.
Overnight sentiment turned weaker, with Palantir (-4% after hours) dragging tech sentiment lower after offering limited 2026 guidance despite solid results. Nasdaq and S&P futures are down -0.85% and -0.59%, respectively, and Asian markets are mostly lower, adding to the cautious tone.
Today’s focus:
Earnings: A busy session with results from AMD, Shopify, Uber, Pfizer, BP, and others, likely to shape sector moves.
Politics: U.S. state elections (New York mayoral, New Jersey and Virginia gubernatorial races) could test political sentiment but are unlikely to have major near-term market impact.
Outlook: Expect a softer start for the S&P 500 as tech momentum fades and macro uncertainty persists, with investor focus shifting to corporate earnings and central bank commentary for direction.
Key Support and Resistance Levels
Resistance Level 1: 6830
Resistance Level 2: 6857
Resistance Level 3: 6880
Support Level 1: 6748
Support Level 2: 6727
Support Level 3: 6707
This communication is for informational purposes only and should not be viewed as any form of recommendation as to a particular course of action or as investment advice. It is not intended as an offer or solicitation for the purchase or sale of any financial instrument or as an official confirmation of any transaction. Opinions, estimates and assumptions expressed herein are made as of the date of this communication and are subject to change without notice. This communication has been prepared based upon information, including market prices, data and other information, believed to be reliable; however, Trade Nation does not warrant its completeness or accuracy. All market prices and market data contained in or attached to this communication are indicative and subject to change without notice.

S&P 500 Technical & Fundamental Outlook — Week of Nov 3–7, 2025🧭 S&P 500 Technical & Fundamental Outlook — Week of Nov 3–7, 2025
Chart View:
Price is consolidating between 6,815 support and 6,921–6,940 resistance, holding just above the major ascending trend line from October.
This area marks a critical inflection: will buyers defend the trend, or will we finally break structure?
📊 Technical Breakdown
Primary Trend: Uptrend intact while above trend line support.
Key Support Zone: 6,800 – 6,815 (buyers last defended strongly).
Major Breakdown Level: Below 6,656 opens the door to 6,550 and new lower lows.
Resistance Zone: 6,921 – 6,940 (previous swing high & supply area).
Bias: Neutral-to-bullish while above 6,815; bearish momentum accelerates under 6,656.
🟢 Bullish Path: Use the trend line as a launchpad to retest 6,921+.
🔴 Bearish Path: Break and close below 6,815 → target 6,656 then 6,550.
🗓 Macro Calendar – Key Events to Watch
Mon (Nov 3) – ISM Manufacturing PMI (48.7 vs 49.4 prior)
→ Soft manufacturing data keeps Fed-cut expectations alive.
Tue (Nov 4) – ECB President Lagarde speaks (2 appearances)
→ Watch EUR/USD volatility; global equity tone may shift if dovish.
Wed (Nov 5) – ADP Employment (+31K expected after –32K prior); ISM Services PMI (50.7 exp)
→ Jobs rebound or slowdown will steer rate-cut bets and risk appetite.
Thu (Nov 6) – Bank of England rate decision (4.00% expected hold) + Governor Bailey speech; FOMC Member Waller speaks (2:30 PM ET)
→ Cross-market rate tone could affect bond yields → equity valuations.
Fri (Nov 7) – U.S. Non-Farm Payrolls + Unemployment + UoM Sentiment (53.0 exp)
→ This is the week’s main volatility catalyst. Strong jobs = hawkish pressure; weak jobs = bullish equities.
💬 Market Sentiment & Headlines
AI Mania Continues: Amazon hit a record after a $38 B OpenAI deal via AWS, fueling tech momentum.
Earnings Strength: 80% of S&P companies beat Q3 estimates; megacap tech remains the driver.
Breadth Concerns: 300+ S&P names closed red Monday — showing the rally is narrow and fragile.
Other Corporate Moves: Kimberly-Clark to acquire Kenvue ($48.7 B), Starbucks China JV announcement.
Macro Backdrop: Investors await clarity on Fed policy path and global rate decisions amid softening manufacturing data.
🧩 Trader’s Take
This week is all about trend-line defense vs breakdown.
Stay flexible:
Above 6,815 → trend continuation bias.
Below 6,656 → prepare for deeper retracement toward 6,550.
Macro data + AI headlines are creating a push-pull market: tech buoyancy vs broader weakness.
📅 Watch the reaction during ISM & NFP — these will likely decide direction for mid-November.
#SPX #SP500 #Futures #TradingView #PriceAction #Fundamentals #TechnicalAnalysis #StockMarket #AIStocks #MacroWeek #NFP #ISM #Fed #Equities #Amazon #OpenAI #NASDAQ #SPX500

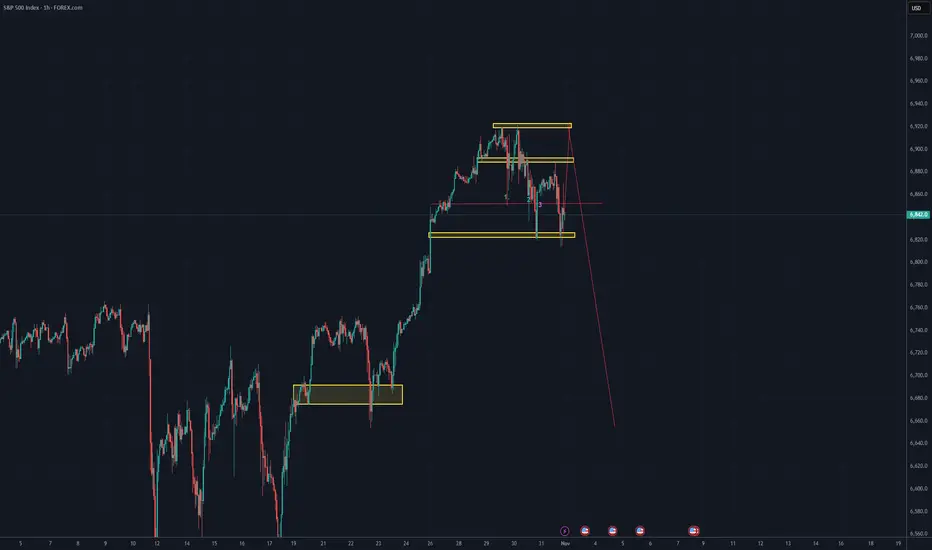
SPX | Daily Analysis #10 - 3 November 2025Hello and Welcome Back to DP,
Review & News Coverage:
Since our last SPX analysis, we mentioned that a broken trendline could open the door for downside movement. As we can see on the chart, the index fell toward the 1.68 Fibonacci zone before bouncing back.
This drop created about $44 of volatility — hopefully, you managed to catch that move! We had highlighted the 6811 area as a potential buy zone, and indeed, that level opened an opportunity for entries (I personally missed it since I needed more confirmation, but I hope some of you caught it).
From both the economic and political sides, several developments could shape SPX sentiment and direction:
Economic Calendar:
Monday: ISM Manufacturing PMI
Wednesday: ADP Non-Farm Employment Change & ISM Services PMI
Friday: Tentative Unemployment Rate
Stronger-than-expected data could strengthen the dollar and weigh on equities, while weaker readings may support a rebound if markets price in potential rate relief.
Political Landscape:
Watch for new announcements on funding negotiations or relief measures — any progress (or setback) in the government-shutdown talks could move markets.
The U.S. government shutdown remains a risk factor, with pressure building from expiring healthcare tax credits and food assistance programs.
And most importantly — keep an eye on “Trump’s Indicator” (his posts or tweets). His remarks often create sharp, short-term volatility across indices and sectors.
1H - 4H Technical Analysis:
On the charts, the SPX is struggling to regain upward momentum.
If price breaks the intraday trendline, room opens for a move down toward 6844 and 6829.
If those zones show strong volume and bullish candle patterns, we could look for buy entries around that range.
The key is to wait for confirmation — volume support and candle behavior will guide whether the market finds its footing or continues to slide.
Summary:
Short-term tone remains cautiously bullish while above 6811, but pressure remains from macro and political uncertainty.
Watch mid-week data and political headlines for volatility spikes.
Technical zones: Support 6829–6811, Resistance 6895–6920 (potential retest if sentiment turns).
Disclaimer:
This content is for informational purposes only and does not constitute financial or investment advice. © DIBAPRISM
Amir D.Kohn

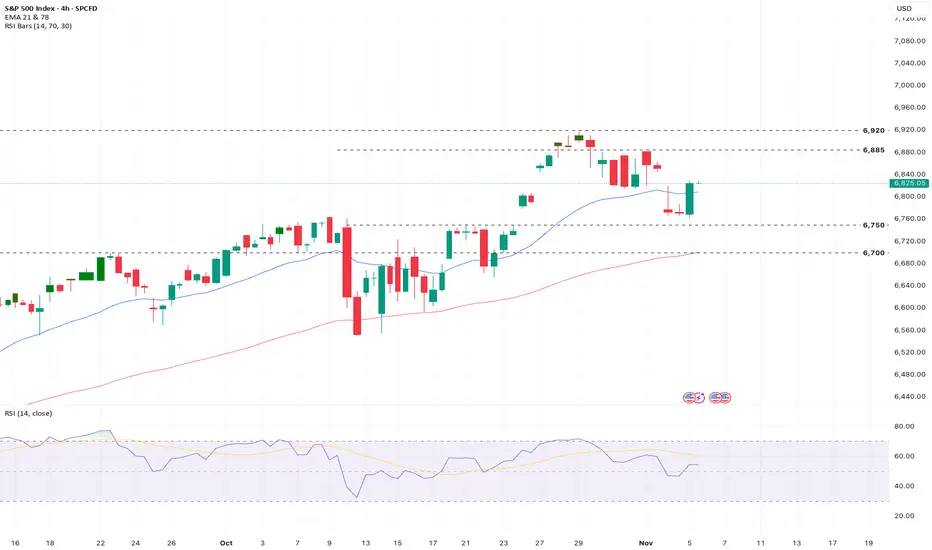
US500 maintains inherently bullish structureFundamental Analysis
US500 maintains an inherently bullish structure, trading above both EMAs. Q3 earnings were strong, with 83% of companies beating expectations and delivering 13.8% blended EPS growth, largely thanks to megacap tech/AI. However, the forward P/E ratio is high at 23.1x (above the 5-year average of 19.9x), signaling elevated valuations. The recent profit taking in high growth names like AMD and Nvidia due to margin concerns and macro headwinds (high rates/inflation) exposes this valuation sensitivity.
Technical Analysis
The index is currently pulling back from all time highs near 6,900, consolidating in a short term support zone of 6,750. Momentum is neutralizing with RSI approx 51.6, indicating a pause rather than a reversal. Key technical battleground: Resistance at 6,885 and 6,920 versus support at 6,750 and the EMA at 6,700. Consolidation is the most probable short term path.
Sentiment Analysis
Sentiment is cautious to slightly negative. The sharp correction in AI leaders (AMD, NVDA) has fueled "AI bubble" fears, overriding fundamentally strong earnings reports. There is a clear, broad sector rotation occurring as investors de-risk and take year end profits from high growth tech toward defensive/value plays. The market is currently driven by nervousness about sustaining premium valuations against persistent macro uncertainty.
Outlook
The near term outlook is moderately cautious. While the long term bullish trend remains supported by healthy corporate earnings, the market faces an inflection point driven by overvaluation concerns in the tech sector. Further short term volatility is expected as the market digests earnings nuances (like margin guidance) and awaits clearer signals on US monetary policy and inflation. A decisive break of the 6,750 support or 6,885 resistance will likely define the next directional move.
Analysis is by Terence Hove, Senior Financial Markets Strategist at Exness

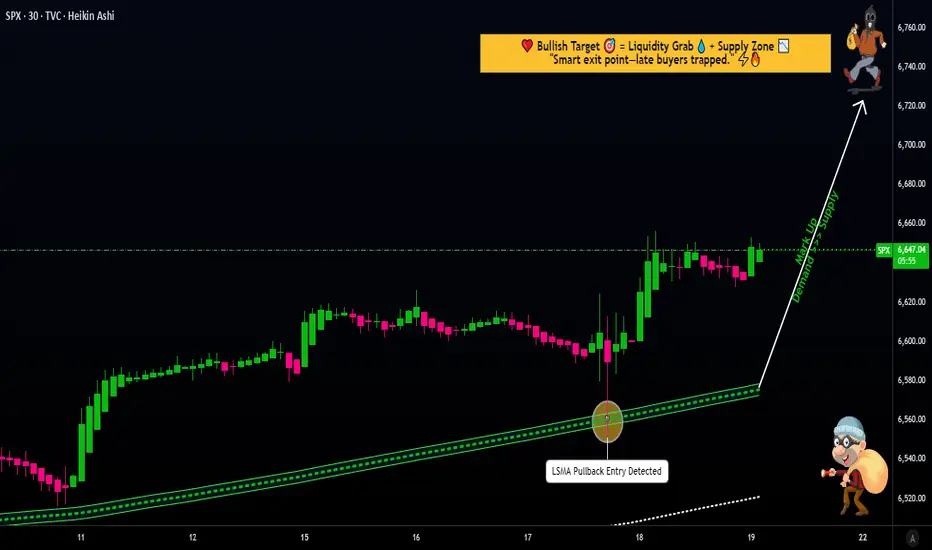
SPX500 Trading Strategy Explained: From Entry to Exit⚡ SPX500 “STANDARD & POOR” Indices Market Wealth Strategy Map ⚡
(Swing / Day Trade Plan – Thief OG Style)
🧭 Plan
📈 Bias: Bullish confirmed with 30m LSMA pullback + 0.786 Fibonacci-based MA confluence.
💡 Entry Approach (Thief Layering Strategy™):
Instead of one-shot entry, I place multiple buy-limit layers to average into strength. Example setup:
Buy limit: 6600
Buy limit: 6620
Buy limit: 6640
👉 You can extend or adjust the layering based on your own strategy.
🎯 Stop Loss (SL)
This is my Thief SL @6560.
⚠️ Note to Ladies & Gentlemen (Thief OG’s): This SL is not a recommendation. Use your own judgment — protect your loot at your own risk.
💰 Target (TP)
📌 6750 — sitting at strong resistance + overbought zone + possible bull-trap.
⚠️ Again, OG’s — this is not financial advice. Take profit when it fits your plan. Secure the bag, then enjoy the loot!
🔍 Related Pairs to Watch
Keep an eye on these correlated assets to confirm the SPX500’s move:
NASDAQ:NDX (Nasdaq 100): Tech-heavy index with strong correlation to SPX500. If tech stocks are pumping, it’s a bullish signal for our trade. 📊
TVC:DXY (US Dollar Index): A weaker dollar often boosts equities. Watch for inverse correlation—DXY dropping could mean SPX500 is ready to fly! 🚀
TVC:VIX (Volatility Index): Low VIX levels signal market calm, supporting our bullish setup. A spike in VIX could warn of trouble, so stay sharp! ⚡
Key Correlation Insight: SPX500 often moves in tandem with NASDAQ:NDX due to shared tech giants (think Apple, Microsoft). If NASDAQ:NDX is rallying, it’s a tailwind for our trade. Conversely, a rising TVC:DXY or TVC:VIX could signal caution.
📝 Thief Note
Dear Ladies & Gentlemen (Thief OG’s):
This map is my personal swing/day trade playbook — not a fixed recommendation. Layer entries, cut losers fast, and loot when you can. Market moves are wild; manage risk like a true OG.
✨ “If you find value in my analysis, a 👍 and 🚀 boost is much appreciated — it helps me share more setups with the community!”
⚠️ Disclaimer: This is a Thief-style trading strategy shared just for fun & educational vibes. Not financial advice. DYOR & trade responsibly.
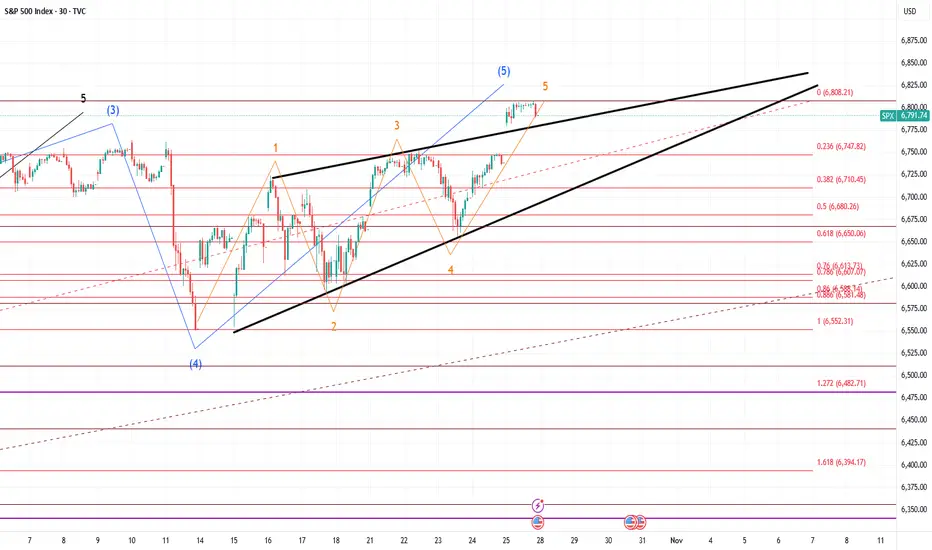
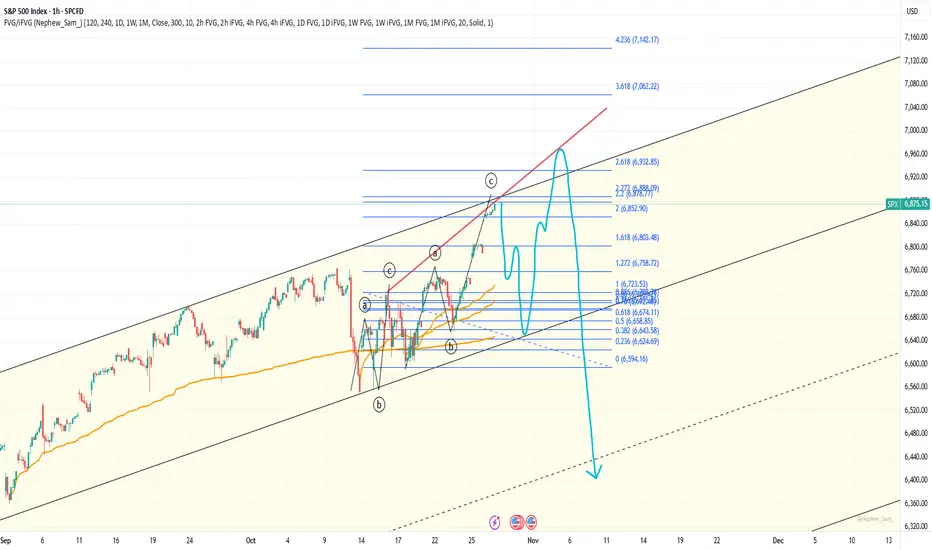
Ending expanding diagonal scenarioJust a possible scenario. If I'm right, wave 3 ends here, and wave 4 correction should start very soon.
SPX | Daily Analysis #8 - 29 October 2025Hello and welcome back to DP
Market Review:
Over the past two days, as mentioned in our #7 analysis, “a sustained move above 6,860 may signal further bullish momentum toward the upside.”
This scenario played out as expected, with price reaching the 6,900 area for the first time. However, short sellers are now stepping in, attempting to fade the rally and fill the gap.
Currently, all eyes are on the upcoming Federal Reserve interest rate decision and Chairman Powell’s comments. Both China and the U.S. have remained relatively quiet, keeping market attention focused on monetary policy.
Meanwhile, President Trump stated yesterday that he intends to replace Powell in the coming months. Powell has previously clarified that the President does not have direct authority to remove the Fed Chair, so this statement adds a layer of political uncertainty.
According to CME FedWatch, there is about a 95% probability of a 25 bps rate cut being announced.
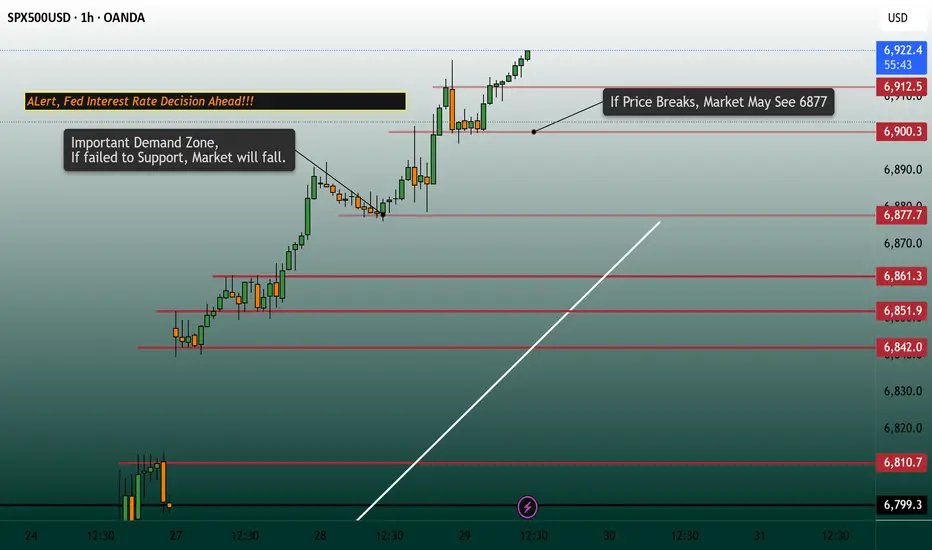
1H–4H Technical Analysis:
The 6,900 area is currently acting as a strong resistance zone, followed by the 6,878 support area.
• Bears have entered around 6,900–6,917, attempting to push prices lower.
• Bulls, however, are showing resilience and defending the zone.
If price fails to hold above 6,900, we could see a pullback toward 6,878.
Should 6,878 fail to hold, a sharper decline toward the gap zone could occur.
Given the interest rate decision, expect high volatility — with sharp moves both up and down before and after the announcement.
If you’re planning to trade this event, manage your stop loss carefully and avoid overexposure.
Disclaimer:
This content is for informational purposes only and does not constitute financial or investment advice. © DIBAPRISM
Amir D.Kohn
Trust and Release – 4 Times to LET Your Trade GoEvery trader knows the feeling.
You’ve done all the homework, lined up every signal, and double-checked your risk. It’s like preparing to jump out of a plane with your parachute strapped on – exhilarating, but just a little nerve-wracking.
When you’ve put in the work, planned the trade, and set it in motion, there’s only one thing left to do:
Let it go.
Trust the process and release the trade.
Here are four clear-cut signs it’s time to step back and trust your strategy.
SIGN #1: The System Lined Up Perfectly
You’ve got a strategy for a reason.
You trust it, you’ve backtested it, and it’s made it through countless simulations and reviews.
Whether you’re trading Forex, JSE Top 40 or even the Dow Jones Index.
When all the indicators in your system align, it’s time to act, not hesitate.
Remember, the market rewards action, not perfection.
If your system says “go,” then go. No second-guessing.
J.T.T.T – Just Take The Trade
SIGN #2: Your Entry Orders Are All in Place
You’ve placed your entry orders and planned each move with the same precision as a grandmaster in chess.
So why keep checking every tick?
If you’ve calculated your entry points and set them with intention, then you’ve done your job.
This is your chance to let the market do the rest.
Obsessing over every micro-move will only drag you into a rabbit hole of doubt.
Set it and step away.
SIGN #3: It Matches Your Risk & Reward Criteria
Your trade has a purpose, and you’ve defined it by setting your risk and reward limits.
When your setup meets these criteria, there’s no reason to stick around second-guessing the play.
You know your max loss, and you know your target profit. You’ve thought it through rationally, and now it’s time to trust that process.
You’re here to be a professional, not a perfectionist.
SIGN #4: You’ve Nailed Down Your Trade Size
Position sizing is a science in itself, and you’ve already done the math.
You’re not risking more than you’re willing to lose, and you’re confident in the upside.
If you’ve set your trade size according to your plan, you’ve already protected your capital.
The last thing you need is to add or subtract impulsively. Let the size stay as it is and let the market move.
Conclusion: Trust and Release
Trading is as much about discipline as it is about analysis.
If you’ve done the work, checked off every box, and know your limits, the best thing you can do is walk away and let your trade breathe.
Micromanaging won’t make you money; it’ll just wear you out.
The market is like a river – you can’t force it to flow your way. You can only guide your boat down the path you’ve chosen and let the current do its thing.
When you’ve planned the trade, trust yourself enough to leave it alone.
So let’s sum up the FOUR signs to let your trade go.
SIGN #1: The System Lined Up Perfectly
SIGN #2: Your Entry Orders Are All in Place
SIGN #3: It Matches Your Risk & Reward Criteria
SIGN #4: You’ve Nailed Down Your Trade Size

S&P 500 looks Bearish Correction But Fed is Coming...SPX500 – Technical & Fundamental Overview
The index remains under bullish momentum, but a short-term correction toward 6838 from the pivot line at 6889 is possible before the next directional move.
Technical Outlook:
A 1H close below 6839 would confirm a bearish reversal, targeting 6769 as the next support.
However, a 1H close above 6889 would reinforce the bullish trend, paving the way toward 6941 and 6991 — with potential for a momentum-driven continuation if sentiment stays positive.
Pivot Line: 6889
Support Levels: 6840 · 6800 · 6769
Resistance Levels: 6940 · 6991
Fundamental Context:
Traders are positioning cautiously ahead of this week’s Trump–Xi trade talks, which could shape near-term market sentiment. Optimism over a potential U.S.–China tariff framework and expectations that the Federal Reserve may cut rates again are supporting risk appetite.
However, with indices at record highs and AI-related stocks heavily concentrated, any disappointment in the trade outcome or earnings results could spark a sharper downside reaction.
In short, bullish while above 6889, but watch for volatility driven by trade headlines and Fed signals in the coming sessions.

SPX500 ShortElite analysis
2 Possibilities
Price reacted off 4h structural liquidity
targets, lower liquidity pools

SPX500 H4 | Potential Bearish ReversalS&P500 is reacting off the sell entry at 6,888.42, which aligns with the 100% Fibonacci projection and could reverse from this level to the take profit.
Stop loss is at 6,950, whic is a swing high resistance level.
Take profit is at 6,761.08, which is a pullback support that aligns with the 38.2% Fibonacci retracement.
Stratos Markets Limited (tradu.com ):
CFDs are complex instruments and come with a high risk of losing money rapidly due to leverage. 68% of retail investor accounts lose money when trading CFDs with this provider. You should consider whether you understand how CFDs work and whether you can afford to take the high risk of losing your money.
Stratos Europe Ltd (tradu.com ):
CFDs are complex instruments and come with a high risk of losing money rapidly due to leverage. 70% of retail investor accounts lose money when trading CFDs with this provider. You should consider whether you understand how CFDs work and whether you can afford to take the high risk of losing your money.

Reversal?Channel resistance reached
RSI resistance reached
Double 1D divergence on RSI
If something ugly is gonna happen, it's gonna happen now.
Fib levels to watch:
1.272 - likely bounce area
1.618 - classic reversal level for a correction after wave 5, but I don't see strong support there
2.0 - not a fib level, but February peak is there. Likely bounce area.
2.2 and 2.272 area - when 1.618 level breaks, price usually reaches it. They are all inside of 1M FVG. The correction can end there. Or not.
2.618 - the price can reach and overshot it. Another 1M FVG lies just below it.
All 2+ fibs match previous peaks very good. Sounds crazy, but a correction to 6000 area seems very probably now.

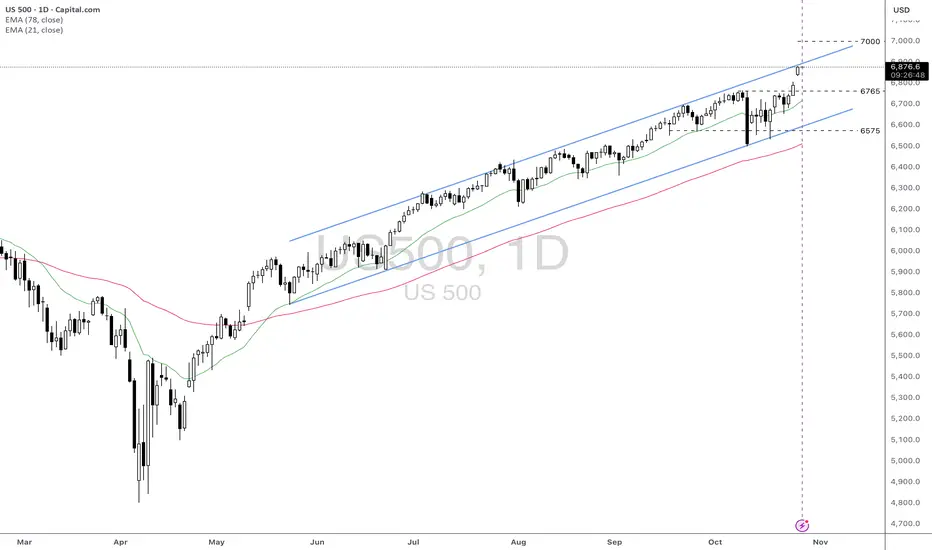
S&P 500 Analysis – 26 October 2025
- S&P 500 broke resistance level 6800.00
- Likely to rise to resistance level 7000.00
S&P 500 index opened today with the upward gap which broke the key resistance level 6800.00 (which stopped the previous impulse wave (3) at the start of October, as can be seen from the daily S&P 500 index chart below).
The breakout of the resistance level 6800.00 accelerated the active minor impulse wave 3 of the medium-term impulse sequence (5) from the start of this month.
Having just broken out of the daily up channel from August, S&P 500 index can be expected to rise to the next round resistance level 7000.00, target price for the completion of the active impulse wave 3.

SPX500 Eyes 7000 — Breakout or Bull Trap Ahead?🦸♂️ SPX 500 Heist: The 7K Bull Run Playbook (Swing Trade Setup) ✅
Alright, crew, listen up! The market is a vault, and we're here to make a strategic withdrawal. The SPX 500 is showing us the blueprints for a potential bullish breakout. This is our plan to ride the wave.
🎯 The Master Plan: BULLISH
We're looking for a classic breakout play. The gates are at 6780, and once they're open, we're going in.
⚡ Entry Signal (The "Go" Signal)
Action: Consider long positions ONLY AFTER a confirmed daily breakout and close above the key level of 🎯 6780.00.
Translation: Don't jump the gun. Wait for the market to show its hand.
🚨 Stop Loss (The "Escape Route")
Location: My suggested escape hatch is down at 🛡️ 6600.00. Place it after the breakout we talked about.
A Note from the OG: "Dear Ladies & Gentleman (Thief OG's), I am not recommending you set only my SL. It's your own choice. You can make money, then take money at your own risk." 😉
💰 Profit Target (The "Loot Bag")
Destination: We're aiming for the major resistance zone at 🎯 7000.00. This is a psychological magnet and a previous area where sellers stepped in.
Why Here? It's a zone of strong resistance, potential overbought conditions, and traps for the greedy. Be smart and escape with your profits!
Another OG Note: "Dear Ladies & Gentleman (Thief OG's), I am not recommending you set only my TP. It's your own choice. You can make money, then take money at your own risk." 😎
🔍 Market Intel: Pairs to Watch
A master thief always checks the surrounding area. Keep an eye on these correlated assets:
AMEX:SPY (SPDR S&P 500 ETF): The direct tracker. Moves almost tick-for-tick with the SPX.
NASDAQ:NDX (Nasdaq 100): Tech-heavy cousin. If NDX is strong, it often pulls SPX up with it.
TVC:DXY (U.S. Dollar Index): Our usual antagonist. A stronger dollar can be a headwind for large-cap stocks.
CME_MINI:ES1! (S&P 500 E-mini Futures): The real-time action. This is where the big moves often happen first.
✨ Community Boost
If you find value in my analysis, a 👍 and 🚀 boost is much appreciated — it helps me share more setups with the community!
#SPX500 #SP500 #SwingTrading #MarketPlaybook #PriceAction #ThiefTrader #IndexAnalysis #TechnicalAnalysis #TradingStrategy #US500 #Equities #BreakoutStrategy #TradingView #StockMarket #RiskManagement

US500: Strong Upward Momentum Approaching 7000 LevelFundamental approach:
- The US500 advanced this week, propelled by strong earnings momentum from tech giants and robust performance in select sectors. Among top movers, Qualcomm rose over 11% following upbeat earnings guidance, while Alphabet and Tesla also rallied ahead of their highly anticipated quarterly results. W.R. Berkley Corporation and Welltower Inc. were notable gainers, reflecting sector rotation and risk-on flows in the index.
- Earnings from the 'Magnificent Seven', including Microsoft, Alphabet, and Meta, drove sentiment, with over 86% of S&P 500 companies reporting results above consensus expectations so far this quarter. Tesla's performance was mixed, while Amazon is set to announce slightly lower profits, but the broader group is still outpacing the rest of the market in earnings growth.
- Tech earnings and the upcoming FOMC decision are key catalysts that may influence future US500 moves. Broad sector participation and ongoing AI investment could sustain upward momentum if macroeconomic conditions remain supportive.
Technical approach:
- US500 created a new all-time high this week after breaching the key level at around 6765. The index showed an urgency in moving upward, creating a gap that remains unfilled. US500 is well above the diverging EMAs, indicating a strong upward momentum. However, the index is approaching the upper bound of the ascending channel, which may limit the price movement.
- If the current gap remains unfilled, the US500 may continue to move upward and test the psychological resistance at 7000.
- On the contrary, rejecting the channel's upper bound may prompt a correction and fill the gap around 6790, retesting the broken level at 6765.
Analysis by: Dat Tong, Senior Financial Markets Strategist at Exness
This is the END(ing diagonal)The ending diagonal has formed. If you check RSI you will see a double daily and fresh WEEKLY divergence. It will crash hard next week. 6480 is the first target, but it can be just a bounce area. 1.618 level from low to top of the diagonal is at 6400 level on SPX and at 6300 level on US500 - I think we can get a flash-crash into this area next week. And if this is a reversal, it can trend down to February peak and lower according to fibs.