SPX - Is it topping or setting up a for another run up?I hang up my trader title this week as I have been whooped by poor decision making in a choppy market. But here are my scenarios I will watch as we go. I can't help to think we are topping, but also see we are still in a strong bull market; it just has been harder to swing trade the daily.
Scenarios I’m Watching
Upside Continuation:
Buyers hold above the shaded zone (6,440–6,481) and press higher along the uptrend. A clean push above 6,532 would open the door to new highs, with the trend remaining intact as long as higher lows continue.
Sideways Chop:
Price keeps oscillating above and below the 6,440–6,481 range. This would extend consolidation and could frustrate swing traders, but it would also allow moving averages to tighten then smooth out and set the stage for another leg higher.
Deeper Pullback:
If the shaded zone and uptrend line break, the next levels to watch are the 20 EMA (~6,430) and the 50 SMA (~6,355). A dip into this area could still be a normal pullback within an uptrend, especially if buyers step in quickly as they’ve done in recent weeks.
Bearish Roll-Over:
If neither the 20 EMA nor the 50 SMA hold, a breakdown toward ~6,200 is possible. While not a technical correction percentage-wise, it would feel significant for anyone who entered near recent highs.
Trade ideas

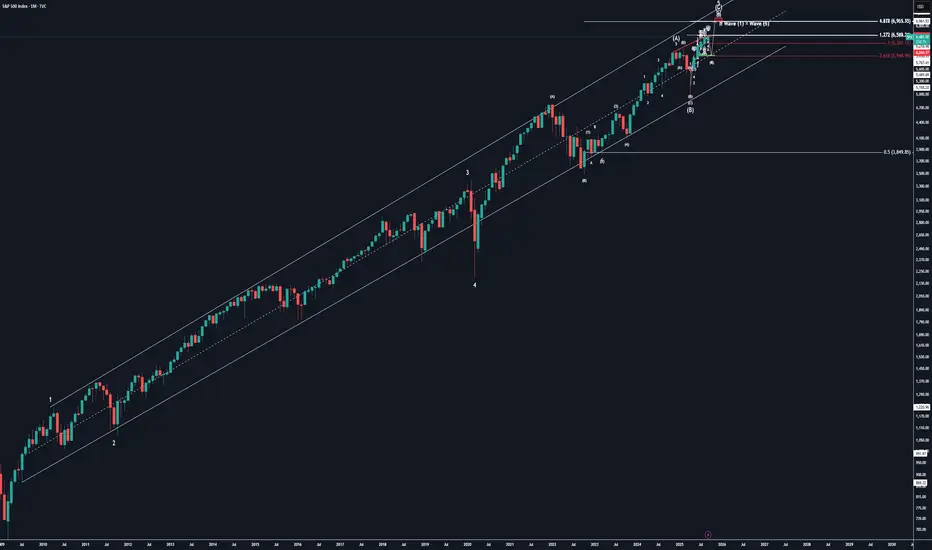
SPX 1M Since 2009 SimplifiedWe are currently in wave 5 of this supercycle which we anticipate completion of @ $6,960-$6,965
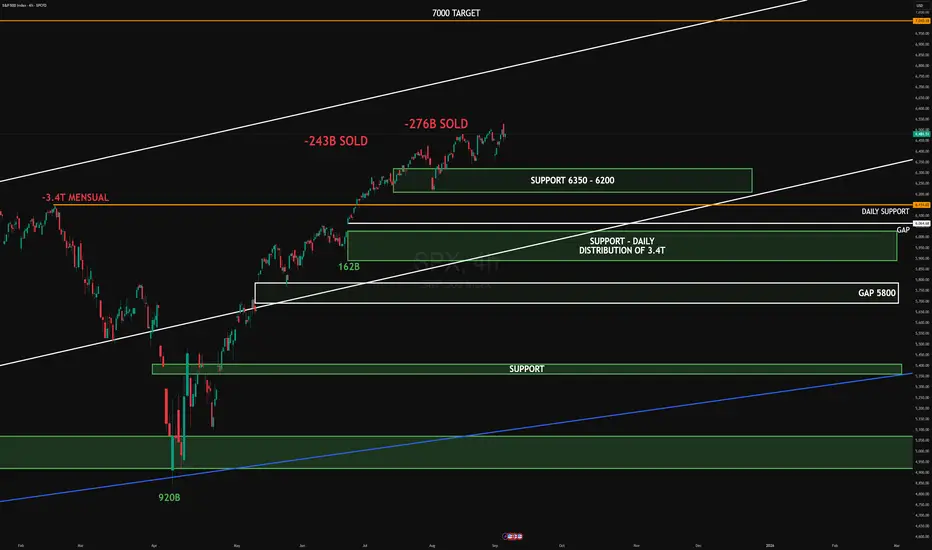
SPX DISTRIBUTION 2025SPX on the 4H chart is facing rejection near recent highs after notable sell volume (-243B and -276B).
Institutional absorption is visible, but upside momentum remains intact as long as the 6350–6200 support holds. Below that, the 3.4T daily distribution zone and the 5800 gap are key downside targets.
On the upside, the projected path points toward the 7000 area.
target: 7000
target: 5800
#SPX #globaltrade #investment #investing #stockmarket #wealth #realestate #markets #economy #finance #money #forex #trading #price #business #currency #blockchain #crypto #cryptocurrency #airdrop #btc #ethereum #ico #altcoin #cryptonews #Bitcoin #ipo
SPX into the coming weekA bit tricky because you dont know if the bears are going to get the strength.The chart has the message.No explanation needed.trendlines are derived from point and figure method.I have adapted them for bars/line charts.Your char might look different

SPX500USD is still going up slowlyHi traders,
Last week SPX500USD finished the correction (Flat) and went up again just as I've said in previous outlook.
Price is not very impulsive. It looks like it forms an ending diagonal.
So next week we could see this pair slowly going up some more.
Let's see what the market does and react.
Trade idea: Wait for a small pullback and a change in orderflow to bullish on a lower timeframe to trade longs.
If you want to learn more about trading FVG's & liquidity sweeps with Wave analysis, then please make sure to follow me.
This shared post is only my point of view on what could be the next move in this pair based on my technical analysis.
Don't be emotional, just trade your plan!
Eduwave

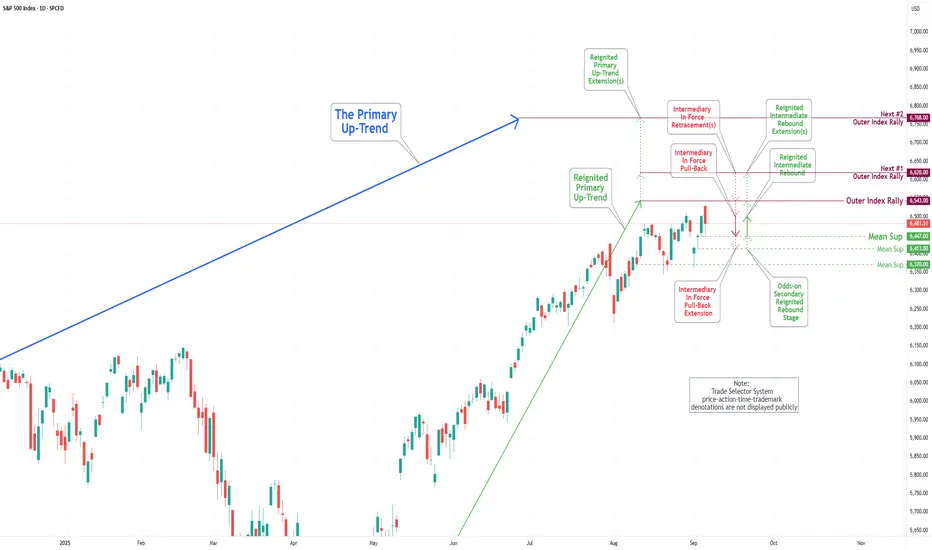
S&P 500 Daily Chart Analysis For Week of Sep 5, 2025Technical Analysis and Outlook:
During the trading sessions of the previous week, the S&P 500 Index exhibited a notable downward movement, reaching the Intermediary In Force Pullback Extension of 6370. An Odds-on Secondary Rebound subsequently followed this decline, as the index restored its upward trajectory by achieving the Mean Resistance level of 6502, although it subsequently settled below this benchmark.
It is essential to acknowledge that the current rebound from the Mean Support level of 6447 suggests a significant probability of a sustained upward movement toward the long-term objective, namely the Outer Index Rally at 6543, as detailed in the prior S&P 500 Daily Chart Analysis. Conversely, one must consider the potential for a substantial pullback to the Mean Support extension level of 6413, which would likely precede another rebound.
Moreover, it is critical to recognize that the ongoing price fluctuations may induce a considerable pullback after the fulfillment of the Outer Index Rally target at 6543. Following this anticipated downward adjustment, the index will likely resume its upward trend, targeting the completion of the Outer Index Rally at 6420.
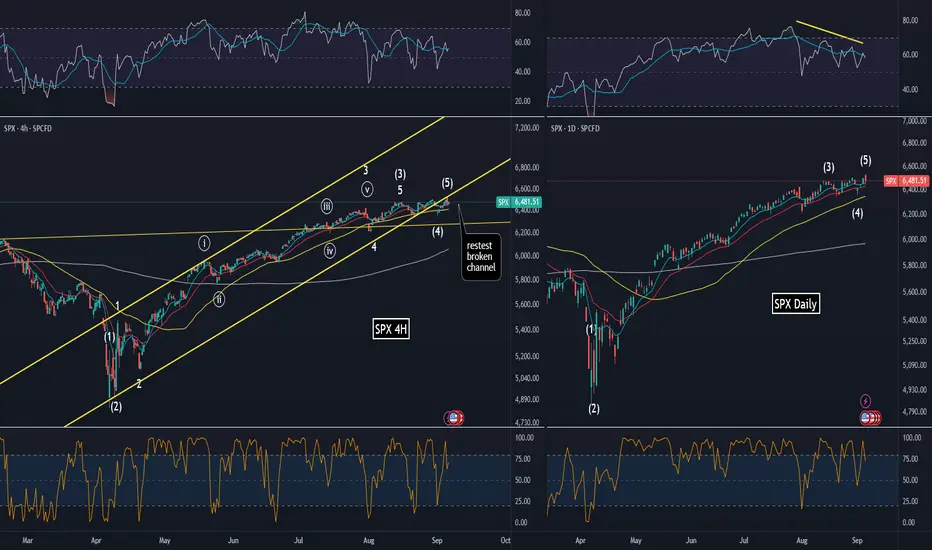
SPX topped on Sept 5I believe the Sept 5 Friday gap up and reversal at opening marked the top of the rally since Apr lows.
1. RSI div on Daily
2. Extreme chop and fading momentum since August which is typical for wave 4
3. Broken Apr trend channel and retested
4. Divergence between SPX and NDQ (which didn't make an ATH)
5. Risk-on assets like NASDAQ:SMH (e.g. NASDAQ:NVDA ), AMEX:XLK (e.g. NASDAQ:MSFT ), and BITSTAMP:BTCUSD are all breaking down
Even though there is more upside, it would be limited and we are in the late stage rally since April. Sept seasonality is real.
Weekly insighta EUR/USD S&P500 NVDA METAThis video is a weekly insights report from a financial trader on TradingView. I amdiscussing my analysis and predictions for several financial instruments based on technical and fundamental indicators.
Key Points:
Market Overview: The speaker talks about the impact of recent US unemployment data on the market, which led to a "parabolic" rise in the Euro dollar.
Euro Dollar: Based on a technical analysis of an "expanding diagonal" and an old trend line, the speaker believes a false breakout is likely. They plan to avoid trading USD pairs for the next 11 days, waiting for the Fed's interest rate decision.
S&P 500: The speaker notes a five-wave Elliot wave pattern with an expanding diagonal. They are waiting for the price to break below a trend line and a red confirmation line before considering a short position. They anticipate a "choppy" market for the coming week.
Nvidia: The speaker received "hate comments" for their previous analysis of Nvidia. They stand by their short position, citing a break below the exponential moving average, a "huge" divergence on the monthly chart, and a "shooting star" candle pattern. They note that Nvidia is the heaviest stock in the S&P 500, representing 7.5% of the index.
Bitcoin: The speaker points out that Bitcoin's price has crossed and retested two moving averages, which they see as a bearish sign. They will consider a short position if the price breaks below the previous low. They also expect Bitcoin to be stagnant in the coming week while the market waits for the Fed's decision.
Call to Action : The video concludes with a plea for viewers to subscribe to the speaker's TradingView channel for more trading insights and short-trade opportunities.

S&P 500 At Critical Juncture - 6,500 Breakout or Major RejectionUS500 Technical Analysis: 🎯 At Critical Juncture - 6,500 Breakout or Major Rejection? ⚖️
Asset: US500 (S&P 500 CFD)
Analysis Date: September 5, 2025
Current Closing Price: 6,480.0 (as of 12:59 AM UTC+4)
Timeframes Analyzed: 1H, 4H, D, W
Executive Summary & Market Outlook 🧐
The US500 is knocking on the door of a historic milestone, trading within striking distance of the 6,500 level. 🚪 This represents a massive psychological and technical barrier. The index is in a strong bullish trend but is displaying classic signs of short-term exhaustion and overextension. The price action here is critical: a decisive breakout could unleash a new wave of buying towards 6,600+, while a rejection could trigger the most significant pullback in weeks. This analysis provides a clear roadmap for intraday traders 🎯 and swing traders 📈 navigating this pivotal moment.
Multi-Timeframe Technical Analysis 🔍
1. Trend Analysis (Daily & 4-Hour Chart):
Primary Trend: 🟢 Bullish. Price is well above all major Daily Moving Averages, which are sloping upwards in bullish alignment.
Short-Term Trend: 🟡 Bullish but Fragile. The rally has been relentless, leaving the price extended and vulnerable to a sharp, news-driven correction.
2. Key Chart Patterns & Theories:
Ascending Wedge / Bull Flag? 🤔: The recent consolidation near the highs could be interpreted as a small bull flag (pausing before breakout) or the end of an ascending wedge (bearish reversal). The next major candle will likely resolve this.
Elliott Wave Theory 🌊: The rally from the last major low is a clear five-wave impulse. We are likely in the final stages of Wave 5. This suggests the completion of a cycle and warns that a larger corrective phase (Wave 4 or A-B-C) is the next probable move. A typical retracement target is the 38.2% Fibonacci level of the entire Wave 3 move.
Ichimoku Cloud (H4/D1) ☁️: Price is trading far above the Cloud on daily charts, confirming the strong bullish trend. However, this also signals a significant over-extension from mean support, increasing mean reversion risk.
Gann Theory ⏳: The 6,500 level is a key psychological and mathematical resistance. A decisive break and close above it could open the path to the next Gann angle target.
3. Critical Support & Resistance Levels:
Resistance (R1): 6,500 - 6,520 (Key Psychological & Technical Ceiling) 🚨
Resistance (R2): 6,600 (Projected Target)
Current Closing Price: ~6,480
Support (S1): 6,400 - 6,420 (Immediate Support & Prior Breakout Zone) ✅
Support (S2) : 6,300 - 6,320 (Major Support - 38.2% Fib & 21-day EMA) 🛡️
Support (S3): 6,200 (50-day EMA & 50% Fib Retracement)
4. Indicator Consensus:
RSI (14-period on 4H/D): Reading is between 68 and 72, signaling overbought conditions. 📛 This warns of weakening momentum and increased downside vulnerability. A bearish divergence on the 4H chart would be a strong short-term sell signal.
Bollinger Bands (4H) 📏: Price is hugging the upper band, a sign of strong momentum. A move back to the middle band (~6,400) would be a healthy and expected development.
Moving Averages: The bullish alignment (EMA8 > EMA21 > EMA50) is perfect. The EMA 21 on the 4H chart acts as dynamic support and is a key level for the bullish thesis.
Volume & VWAP : Volume has been inconsistent on the most recent push higher, a potential bearish divergence 📉 suggesting a lack of strong conviction from large players at these exact levels.
Trading Strategy & Forecast 🎯
A. Intraday Trading Strategy (5M - 1H Charts):
Bearish Scenario (Rejection Play) ⬇️: Given overbought conditions, this is a high-probability setup. Watch for bearish reversal candlestick patterns (e.g., Bearish Engulfing, Evening Star 🌟, Doji) at or near the 6,500 resistance.
Entry: On confirmation of rejection (e.g., a break below a 1H support low).
Stop Loss : Tight, above 6,520.
Target: 6,420 (TP1), 6,400 (TP2).
Bullish Scenario (Breakout Play) ⬆️: If buyers break through with force, wait for a pullback to the breakout level for a better entry.
Entry: On a re-test of 6,500 as new support.
Stop Loss: Below 6,480.
Target: 6,550 (TP1), 6,600 (TP2).
B. Swing Trading Strategy (4H - D Charts):
Strategy: PATIENCE IS KEY. The risk/reward for new long entries at this resistance is poor. 🚫
Ideal Long Zones: A pullback to 6,320 would be an optimal entry to add long positions for the next leg up in the primary bull trend. A shallower pullback to 6,400 could also offer an opportunity. ✅
Bearish Risk: A daily close below 6,300 would signal a deeper correction is underway, potentially targeting the 6,200 support zone.
Risk Management & Conclusion ⚠️
Key Risk Events: High-impact US data (CPI, PPI, NFP) and Fed commentary are paramount. 🔥 The market is highly sensitive to any hint of a shift in monetary policy.
Geopolitical events can also trigger flight-to-safety flows.
Position Sizing: Due to the potential for explosive volatility at this key level, conservative position sizing is non-negotiable. Risk no more than 1% of capital per trade.
Conclusion: The US500 is at a critical inflection point. ⚖️ The bullish trend is intact, but price is exhausted. This is a low-risk-taking zone. Swing traders should be patient for a better entry. Intraday traders can play the range between 6,400 and 6,500 until a decisive break occurs. The most probable outcome is a pullback to recharge before the next major directional move. 📊
Overall Bias: 🟢 Bullish above 6,320 | 🟡 Neutral/Bearish between 6,480-6,500
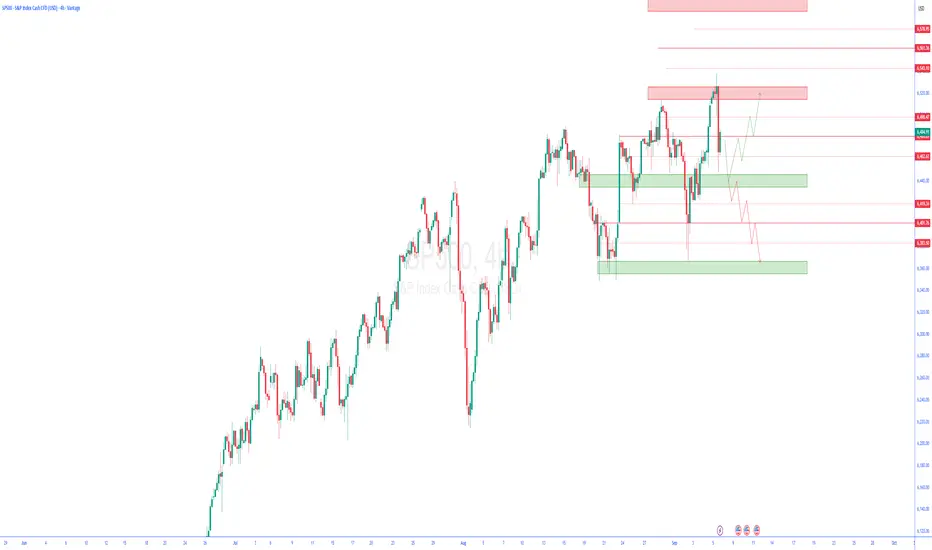
Sp500 4H Trading Outlook for the Upcoming Week
In this series of analyses, we review trading perspectives and short-term outlooks.
As can be seen, in each analysis there is a key support/resistance zone near the current price of the asset. The market’s reaction to—or breakout from—this zone will determine the next price movement toward the specified levels.
Important Note: The purpose of these trading outlooks is to highlight key levels ahead of the price and the market’s potential reactions to them. The analyses provided are by no means trading signals!
SPX at verge of breaking down?SP:SPX is treading dangerously in a bearish wedge formation with multiple bearish divergences in RSI.
A breakdown from here could send it around 6200 zone. And that might just be beginning of the fall everyone is waiting for, on account of excessive debt and inflation situation.

Signals Align for an S&P 500 PullbackThe VANTAGE:SP500 has broken below the EMA 200/100/50/20 while forming a bearish rising wedge and completing an Elliott 5-wave sequence. A MACD bearish crossover and an RSI near 40 further confirm downside momentum. However, this sets the stage for attractive buying opportunities in the near term.


I believe the daily supply zone will be respected. I am shorting
ENTRY 6510.6
SL 6533.0
TP 6488.2
Also, the asset is currently overvalued versus the dollar and U.S bond.

SPX500 | Indexes Rise Ahead of JOLTS Data – Key Pivot 6,438S&P 500 & Nasdaq Futures – Update
Futures tied to the S&P 500 and Nasdaq rebounded on Wednesday, led by gains in Alphabet after its antitrust ruling. Dow futures edged slightly lower as traders await fresh labor market data. The focus today is the JOLTS report (10 a.m. ET), the first of several key releases this week, with nonfarm payrolls on Friday being the most important.
Technical Outlook (SPX500):
🔼 Price reversed from the 6,366 support mentioned in yesterday’s update and has now stabilized above the pivot line at 6,438.
As long as price holds above 6,438, upside momentum is expected toward 6,469 → 6,489, with extended resistance at 6,528.
🔻 On the downside, a confirmed 1H close below 6,420 would shift momentum bearish, exposing 6,389 → 6,361.
Key Levels:
Resistance: 6,469 – 6,489 – 6,528
Support: 6,420 – 6,389 – 6,361
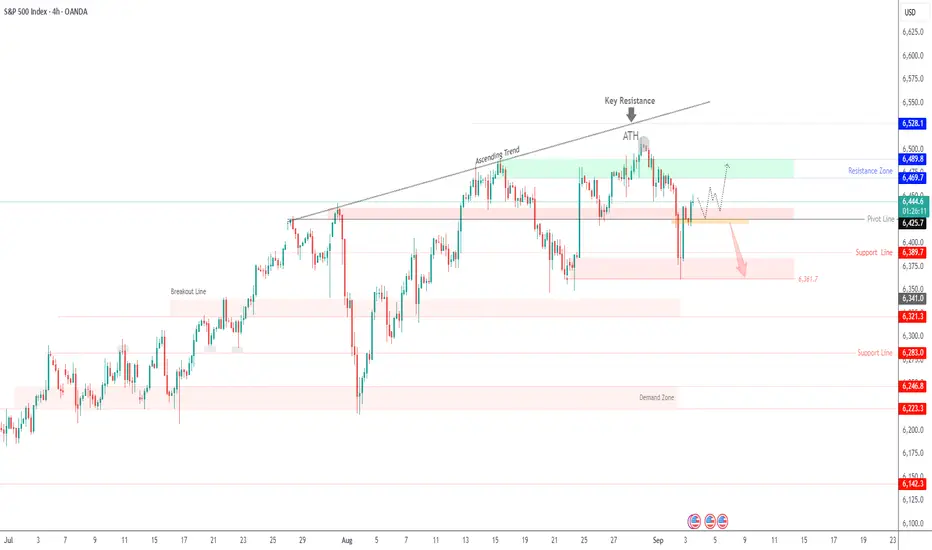
In September, the S&P 500 Index Reached a New All-Time HighIn September, the S&P 500 Index Reached a New All-Time High
September is a month that statistically has the worst reputation for the S&P 500. However, in 2025 things may be different, as today the index hit a record high, rising above 6,520 points.
Bullish sentiment is being driven by:
→ expectations of an interest rate cut in September, which is believed will give the US economy a positive boost (and increase corporate profits);
→ yesterday’s release of the ISM Services PMI (actual = 52.0, forecast = 50.9), which pointed to industrial growth;
→ strong corporate results – for example, Broadcom (AVGO) published a solid report yesterday.
Technical Analysis of the S&P 500 Chart
Analysing the 4-hour chart of the S&P 500 on 28 August, we:
→ identified a support zone below 6,370;
→ noted several bearish signals and suggested that 6,500 could act as psychological resistance (with a potential false bullish breakout).
Indeed, since then (as shown by the blue arrows):
→ the price made a false breakout above 6,500;
→ then dropped to 6,370 to test the support zone;
→ after which it turned upwards again, forming a broad bullish engulfing pattern.
New data allows us to refine the position of the short-term channel (marked in blue), with the following perspectives:
→ Bearish view: the price is close to the upper boundary of the channel, which already showed resistance this morning (highlighted by the red arrow) – the candlestick has a long upper shadow.
→ Bullish view: yesterday’s rally demonstrated signs of imbalance in favour of buyers (as detailed in the description of the Fair Value Gap pattern), and the breakout above 6,500 looks genuine (since the price is consolidating above it).
Both viewpoints seem to be well-reasoned, but the market is unlikely to remain in balance, as today (15:30 GMT+3) the release of US labour market data is scheduled – arguably the key event of the week in the economic calendar.
Depending on the figures, the S&P 500 might:
→ attempt to break through the upper boundary;
→ or retreat towards the median of the blue channel.
Be prepared for volatility spikes.
This article represents the opinion of the Companies operating under the FXOpen brand only. It is not to be construed as an offer, solicitation, or recommendation with respect to products and services provided by the Companies operating under the FXOpen brand, nor is it to be considered financial advice.

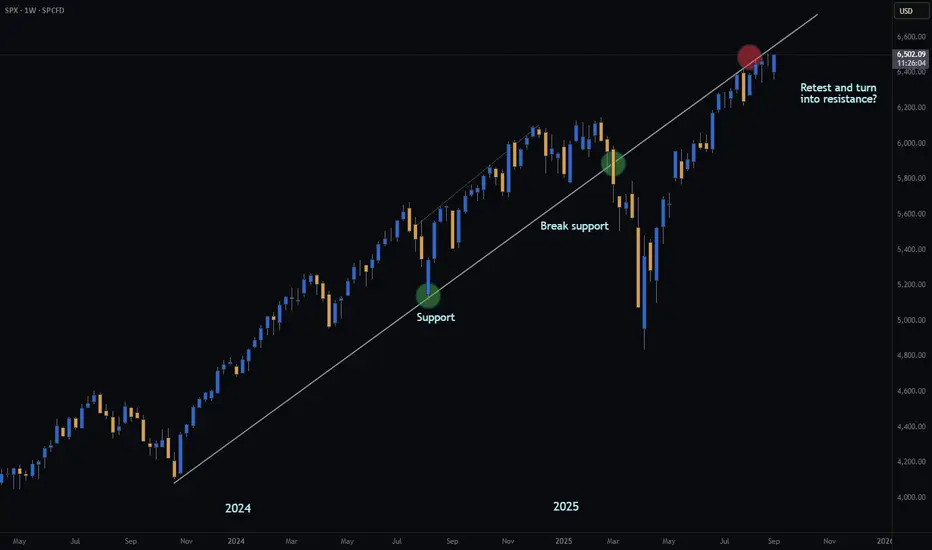
S&P | KEY RESISTANCE | GTradingMethodHello traders!
Has the S&P finally met its match?
Is this just a retest… or the beginning of a much deeper move?
- Broke diagonal support earlier this year
- Retesting previous support now
- Potential daily double top forming
If the retest holds, it’s a long way down… 📉
What are your thoughts? Keen to hear them :)
Signing off
G
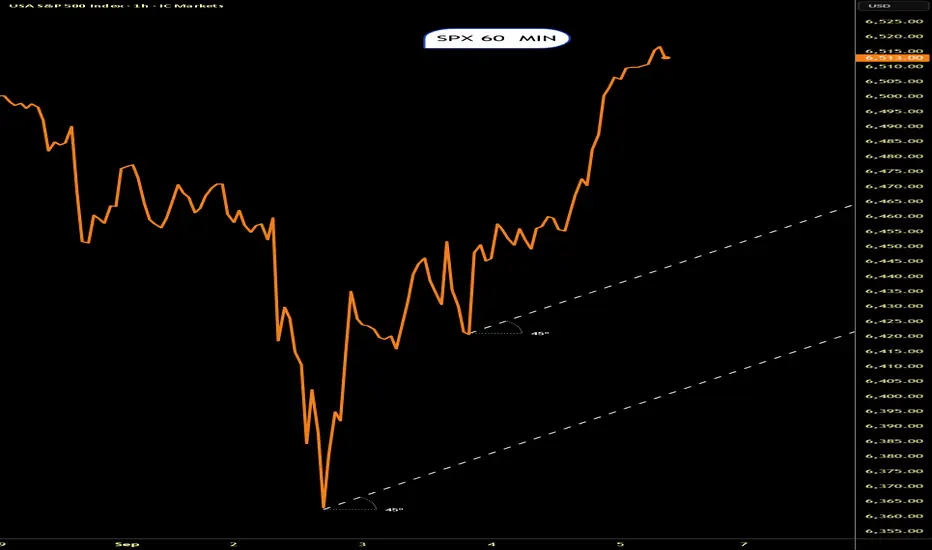
SPX.Latest Move looking a tad overdoneThe chart says it all.No real comment needed.Lets see if this trend can be maintained.?
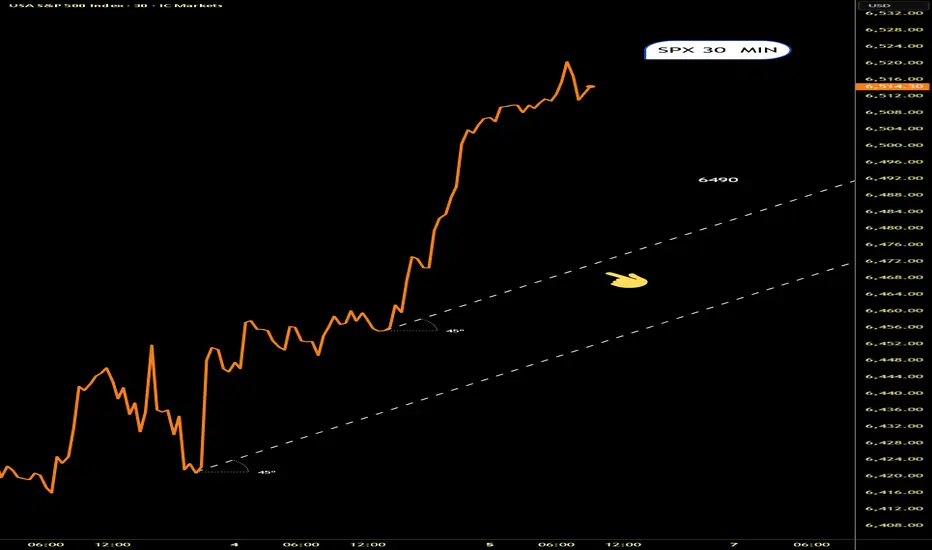
SPX. A fair bit of deviation from the trendlineSome would say its overbought.A fair bit of deviation.Can it continue like that without pulling back..?Very little commentary from me.The chart conveys the message
S&P500 | Daily Double Top | GTradingMethodHello Traders.
Welcome to today's trade idea by GTradingMethod.
🧐 Market Overview:
I’ve opened a short on the cash500 (S&P 500) at 6521. All GTradingMethod variables have been met, which means this trade setup qualifies under my system.
Additional confluences suggesting weaker buying strength include:
- RSI making lower highs while price pushed higher highs.
- Volume tapering off toward the latter part of the rally.
- MACD on sell signal
The only hesitation is that money flows have not decreased in the later stages of this move — but rules are rules. My edge is probability-based, so when my variables align, I must take the trade consistently.
📊 Trade Plan:
Risk/reward = 9.2
Entry price = 6520
Stop loss price = 6544
Take profit level 1 (50%) = 6370
Take profit level 2 (50%) = 6215
💡 GTradingMethod Tip:
A high RR doesn’t make a trade safer — it simply reflects how far the market could move relative to your risk. Always focus on process and probability, not just the potential payout.
🙏 Thanks for checking out my post!
Make sure to follow me to catch the next idea and please share your thoughts - I would like to hear them.
📌 Please note:
This is not financial advice. This content is to track my trading journey and for educational purposes only.

Exchange Rate Dynamics & FluctuationsPart 1: What Are Exchange Rates?
An exchange rate is essentially the price of one currency in terms of another. For example:
Direct quote: 1 USD = 83 INR → How many rupees per dollar.
Indirect quote: 1 INR = 0.012 USD → How many dollars per rupee.
Functions of Exchange Rates
Facilitate international trade – exporters and importers settle payments.
Enable cross-border investment – FDI, FIIs, bonds, equity markets.
Act as indicators of competitiveness – strong vs weak currency matters for exports.
Transmit global shocks – inflation, oil prices, interest rate changes often flow through currency movements.
Part 2: Exchange Rate Systems
Countries adopt different systems to manage their currencies:
Fixed Exchange Rate System
Currency pegged to gold or another currency (e.g., Bretton Woods system).
Provides stability but reduces flexibility.
Floating Exchange Rate System
Currency value determined purely by demand and supply in forex markets.
More volatile but allows automatic adjustment.
Managed Floating (Dirty Float)
Combination of both: central banks intervene occasionally to prevent extreme volatility.
Example: India’s rupee is a managed float.
Currency Pegs & Boards
Some countries peg their currencies to the US dollar or euro (e.g., Hong Kong dollar).
Offers stability but imports inflation/monetary policy from the anchor country.
Part 3: Theories of Exchange Rate Determination
Economists have proposed several models to explain exchange rate movements:
Purchasing Power Parity (PPP)
Currencies adjust to equalize the purchasing power of different countries.
Example: If a burger costs $5 in the US and ₹400 in India, then PPP exchange rate = 400/5 = 80.
Interest Rate Parity (IRP)
Interest rate differences between countries affect forward exchange rates.
Higher interest rates attract capital inflows, strengthening the currency.
Balance of Payments Approach
Exchange rate depends on trade balance (exports-imports) and capital flows.
Trade surplus strengthens currency; deficit weakens it.
Monetary Approach
Currency value linked to money supply and inflation.
Higher inflation depreciates a currency.
Asset Market Approach
Exchange rate determined by demand and supply of financial assets across countries.
Part 4: Key Drivers of Exchange Rate Fluctuations
1. Demand and Supply of Currencies
Like any commodity, exchange rates are influenced by demand and supply. If more people want dollars (for oil imports, for example), the dollar strengthens.
2. Interest Rates
High domestic interest rates attract foreign capital → appreciation of the local currency.
Low interest rates cause outflows → depreciation.
3. Inflation Rates
Countries with lower inflation rates tend to see currency appreciation, as purchasing power is preserved.
4. Trade Balance
Export surplus → stronger currency.
Import-heavy economy → weaker currency.
5. Foreign Direct Investment (FDI) and Portfolio Flows
When investors buy stocks, bonds, or companies in a country, they demand that country’s currency → appreciation.
6. Speculation and Market Sentiment
Traders often buy or sell currencies based on expectations. If markets expect the rupee to fall, speculative selling accelerates the decline.
7. Central Bank Intervention
Central banks sometimes buy/sell foreign currencies to stabilize their domestic currency.
Example: RBI selling dollars to support the rupee.
8. Geopolitical Events and Political Stability
Wars, elections, coups, and policy changes can trigger sharp movements.
9. Commodity Prices
Oil-exporting nations’ currencies (like Russia’s ruble) rise when oil prices rise.
Oil-importing countries (like India) see their currency weaken when oil becomes expensive.
10. Global Risk Appetite
During crises, investors flock to “safe haven” currencies (USD, CHF, JPY), causing them to appreciate.
Part 5: Types of Exchange Rate Fluctuations
Appreciation – Currency value rises (e.g., USD/INR falls from 83 → 80).
Depreciation – Currency value falls (e.g., USD/INR rises from 83 → 86).
Devaluation – Government/central bank officially reduces the currency’s value under fixed system.
Revaluation – Official increase in value.
Volatility – Short-term fluctuations due to speculative trading, news, or shocks.
Part 6: Real-World Examples
Asian Financial Crisis (1997)
Thai baht collapse spread across Asia.
Triggered by excessive borrowing and weak reserves.
Eurozone Debt Crisis (2010–12)
Euro weakened due to fears of Greek and other sovereign defaults.
COVID-19 Pandemic (2020)
Investors rushed into the dollar as a safe haven.
Emerging market currencies depreciated sharply.
Russia-Ukraine War (2022)
Ruble crashed initially, then recovered after capital controls and oil exports.
Indian Rupee Movements
1991 crisis forced devaluation.
2008 crisis → rupee fell due to capital outflows.
Recent years: rupee under pressure due to oil imports and strong US dollar.
Part 7: Implications of Exchange Rate Fluctuations
1. On Trade
A weaker currency makes exports cheaper, boosting demand abroad.
But it makes imports more expensive, adding inflationary pressure.
2. On Inflation
Import-dependent economies (like India with oil) see higher inflation when their currency depreciates.
3. On Investment
FIIs gain/loss depends on both stock performance and currency movement.
Currency depreciation can wipe out returns.
4. On Government Policy
Central banks adjust interest rates, intervene in forex markets, and build reserves.
5. On Common People
Travelers, students abroad, NRIs, and businesses all feel the effect of currency changes.
Part 8: Managing Exchange Rate Risk
Hedging with Derivatives
Forwards, futures, options, and swaps help companies lock in exchange rates.
Natural Hedging
Matching foreign currency revenues with expenses.
Diversification
Spreading trade and investments across multiple currencies.
Government Policies
Building forex reserves, imposing capital controls, or adjusting interest rates.
Part 9: The Future of Exchange Rate Dynamics
Digital Currencies
Central Bank Digital Currencies (CBDCs) may change cross-border payments.
Geopolitical Realignment
De-dollarization attempts by BRICS could alter forex dynamics.
Climate & Commodity Shocks
Weather events affecting agriculture and energy may impact currencies.
AI & Algorithmic Trading
High-frequency forex trading will increase volatility.
Conclusion
Exchange rate dynamics and fluctuations are at the heart of the global economy. They result from a complex interplay of trade, investment, inflation, interest rates, speculation, and geopolitics. No single factor explains all movements—currencies reflect the combined pulse of global markets.
For policymakers, managing exchange rates is a balancing act between stability and flexibility. For businesses, it’s a constant risk to hedge against. For investors, it’s both a challenge and an opportunity.
Ultimately, exchange rates are more than numbers—they represent the relative strength, stability, and future expectations of nations in the interconnected global system.
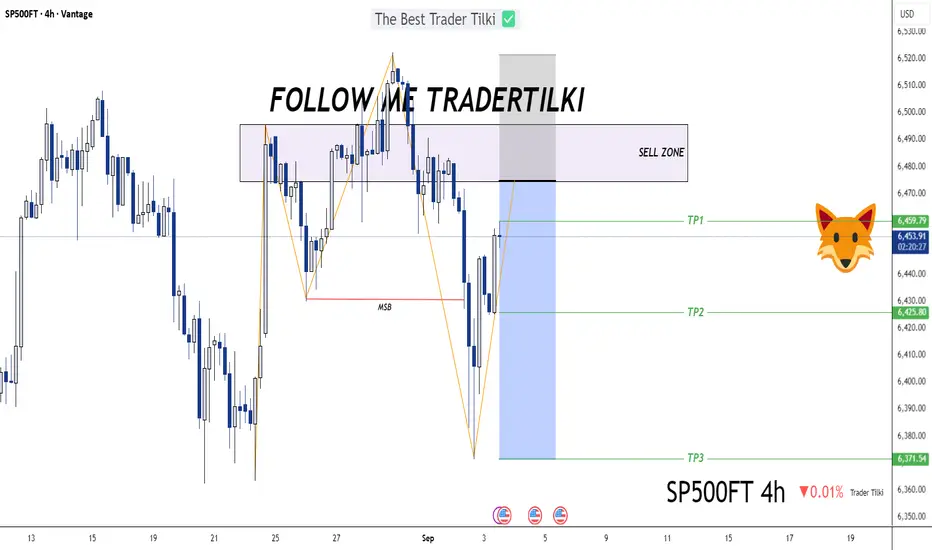
SP500 Structure Shift: Sell Zone ActivatedHey Guys 👋
I’ve prepared an SP500 analysis for you. Since the market structure has shifted, I’ll be opening a sell position from my designated sell zone.
📌 Entry: 6,474.90
📌 Stop: 6,522.12
🎯 TP1: 6,459.79
🎯 TP2: 6,425.80
🎯 TP3: 6,371.54
RISK REWARD - 2,21
Every single like you send my way is a huge source of motivation for me to keep sharing these analyses. Big thanks to everyone supporting with a like 🙏