BTC market snapshotWe’ve reached a new high, and there’s still some room to grow — maybe up to 130K — but I’m maintaining a bearish bias and skipping long entries.
😱 Monthly timeframe divergence is getting stronger, signaling that the overall momentum is fading and the market is overheated.
😱 A rising wedge has formed — a classic trend reversal pattern.
😱 Recent data shows that smart money is selling while retail is buying (judging by gold charts, big players seem to be positioning there in anticipation of a dump).
😱 Social media sentiment is overheated, full of euphoria and belief in endless growth.
😱 The real chaos in the U.S. hasn’t even started yet — the economy is in trouble.
😱 There’s a strong imbalance in open interest.
USTBTC trade ideas

Bitcoin 130,000 – Correction AheadBitcoin
Around the $130,000 level, there is a possibility of a deep correction toward the $74,000 zone.
Do not panic, and do not get carried away by emotions.
This is the market — it plays with your psychology.
The market is geometric. BYBIT:BTCUSDT

Very important Bitcoin will soon reach the 41k areaVery important Bitcoin will soon reach the 41k area

BTC Bullish Targets 150k & beyond
Since downward manipulation/support testing leg in April of this year, BTC had shown strength and crossed Weekly swing high.
Targets from that manipulation leg have reached halfway already, and now looking forward to 4th deviation.
2nd dev= $117,340 upto $124,480
4th dev = $145,900 upto 153,000
chart also shows potential targets in case we go higher. upto 190k and 243k.

BITCOIN BITCOIN ,THE CURRENT structure shows no slowing down by buyers, if they break 124k they will head straight into 135k-145k zone .my goal is to see what buyer will do on the supply roof of the bullish channel.
layer by layer

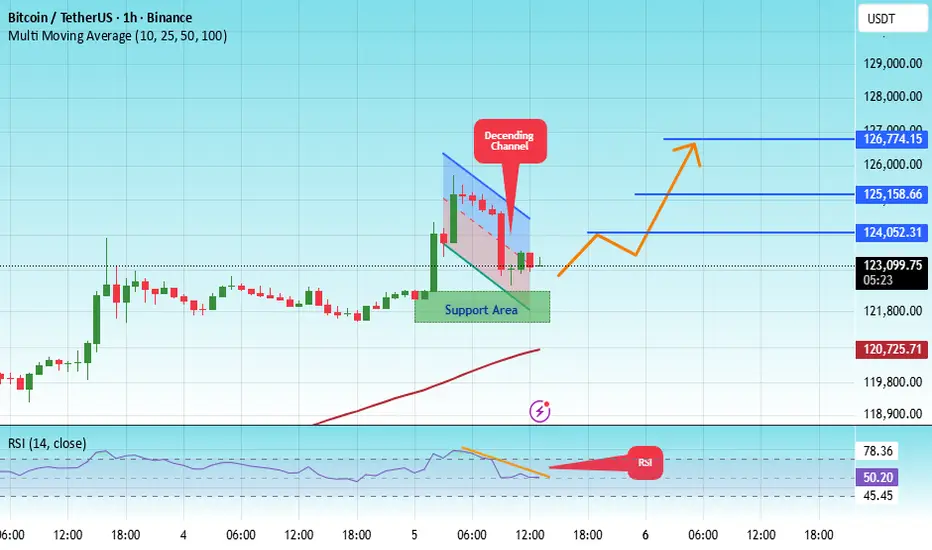
#BTC/USDT Let Bitcoin make a new ATH#BTC
The price is moving within a descending channel on the 1-hour frame, adhering well to it, and is heading for a strong breakout and retest.
We have a bearish trend on the RSI indicator that is about to be broken and retested, which supports the upward move.
There is a major support area in green at 121900, which represents a strong support point.
We are heading for consolidation above the 100 moving average.
Entry price: 123300.
First target: 124050.
Second target: 125160.
Third target: 126774.
Don't forget a simple matter: capital management.
When you reach the first target, save some money and then change your stop-loss order to an entry order.
For inquiries, please leave a comment.
Thank you.
BTC “Blow-off” confirmed, what’s next?Newest chart (H&S with RS near 118.7k, high 124.5k, supports 110.9k / 108.7k / 95.1k / 96.5k / 77.3–74.5k) shows we did get the blow-off extension I had at 13%. We now re-weight the next path conditional on a completed blow-off.
🎯 Short to $73K — plan, gates, and guardrails
It’s feasible only after losing: $110.9K → $108.7K → $103–101K → $96–95K
Risk guardrails (objective invalidations) 🚧
Primary invalidation: Daily close > 118.7K (your RS/supply).
Hard invalidation: Momentum HH > 120.5K and sustained bid above; expect squeeze back to 123–125K.
Trailing logic:
After 110.9K breaks → trail to entry.
After 108.7K breaks → trail to 111.0–111.5K.
After 101K breaks → trail to 105–106K.
After 95K breaks → trail to 99–100K.
Position management 🔧
Scale targets: 108.7K, 103–101K, 96–95K, 90–88K, 83–78K, 75–73K.
What would help the $73K path 📉
Clean acceptance below 95K (no immediate reclaim).
ETF flow cool-off (you’ve been tracking this) + weak spot bid during futures-led dumps.
CME term structure flattening/inversion into breakdowns.
OBV / CVD making lower lows as price ranges (distribution tells).
What would hurt it 📈
Swift 118.7K reclaim on strong spot-led buying.
Persistent positive ETF net inflows on down days.
Perp funding resetting positive while price refuses to break 108.7K.
Aligned with the post–blow-off distribution thesis. Hold the short only as long as 118.7K isn’t reclaimed and the market accepts below 110.9K → 108.7K. The hinge zone is 96–95K; lose it cleanly and $83–78K → $75–73K opens up. Manage via staged profits and a rising trailing stop so the trade can breathe on the way to $73K objective.

Bitcoin overall: likely retracement soon then continuationNow that we’ve made another all-time high, I think it’s most likely for bitcoin, that we have some retracement before our continuation higher. Of course, if we do happen to make a new local low before continuation, there are levels of support immediately below the recent Lows. Regardless, I do think higher prices are most likely Even though this bull run should be nearing the final stages.

TradeCityPro | Bitcoin Daily Analysis #183👋 Welcome to TradeCity Pro!
Let's dive into today's Bitcoin analysis. The market has had an upward movement. Let's see what's ahead in the market.
⏳ 1-Hour Timeframe
Yesterday, I mentioned that there was a high probability of movement and that it would be a good idea to keep an eye on the chart during the New York session as the market could move.
📊 With the start of the New York session, good buying volume entered the market, and after breaking 109890, Bitcoin started an upward wave.
🔑 The first area where the price could have faced resistance was 111605, which was broken on the first attempt. After a pullback, the next leg started.
🚀 The break of 109890, along with RSI entering Overbuy and the entry of buying volume, was a good trigger for a long position, and we could have opened a position with it.
⭐ Now, the price has reached a very important resistance zone, and the probability of a correction starting is high. For taking profit, I suggest you lock in profits whenever RSI exits the Overbuy zone, as this will reduce the upward momentum and increase the chances of a correction.
📈 For new positions, no triggers are available yet, and it's better to wait until the market gives us a clearer structure. However, if the price reacts several times to the level, we can open a long position in subsequent attempts if it breaks.
❌ Disclaimer ❌
Trading futures is highly risky and dangerous. If you're not an expert, these triggers may not be suitable for you. You should first learn risk and capital management. You can also use the educational content from this channel.
Finally, these triggers reflect my personal opinions on price action, and the market may move completely against this analysis. So, do your own research before opening any position.

Bitcoin Channel Analysis - Breakout or Breakdown Incoming?Bitcoin has been trading within a pristine ascending channel for nearly a year and is now at a critical decision point after rejecting from key resistance.
The Setup:
📊 Pattern Formation: Year-Long Ascending Channel
- Clean parallel channel structure established since early 2024
- Lower boundary providing consistent support with multiple successful tests
- Upper boundary acting as strong resistance, most recently at $121,682
- Mid-channel support zone around $115,000-$117,000 has been reliable
- Current price: $122,205, consolidating after rejection from upper resistance
🎯 Potential Targets:
Bullish Scenario: $130,000-$135,000 zone
- Measured move from channel breakout above $122,500
- Continuation of the established uptrend structure
- Next major psychological level at $130K
Bearish Scenario: $105,000-$108,000 zone
- Drop to lower channel boundary if current support fails
- Would still maintain channel integrity
- Critical support at $100,000 - breakdown below invalidates entire structure
What to Watch For Validation:
✅ Decisive Close Above $122,500
- Need a strong 4-hour or daily candle close above this level to confirm breakout
- Not just a wick testing - require solid body close with conviction
- Previous resistance at $121,682 must flip to support
✅ Volume Surge
- Breakout must occur with significantly elevated volume
- Recent volume has been declining during consolidation (visible in lower panel)
- Need at least 2-3x average volume to confirm genuine buying pressure
✅ Support Hold at Mid-Channel
- Current pullback testing $115,000-$117,000 zone
- This area has provided multiple bounces throughout the channel
- Strong bounce with increasing volume = bullish continuation signal
✅ Follow-Through Above $125,000
- After confirming breakout, price should push toward $130K relatively quickly
- Hesitation or immediate rejection would suggest weak momentum
- Watch for sustained trade above previous resistance
Key Levels:
🔸 Resistance: $121,682 (recent rejection) → $122,500 (breakout confirmation) → $130,000 (target)
🔸 Support: $115,000-$117,000 (mid-channel) → $105,000-$108,000 (lower channel) → $100,000 (invalidation level)
🔸 Volume Context Declining volume during pullback is actually bullish - suggests lack of seller aggression
Pattern Context:
Ascending channels represent sustained bullish momentum with well-defined risk parameters. The current consolidation near the upper boundary, combined with declining volume, suggests coiling energy for the next significant move. The 9-day pullback of -7.55% is healthy profit-taking, not distribution.
Invalidation Signals:
❌ Break and close below $112,000 with volume
❌ Breakdown through lower channel boundary (~$105K)
❌ Multiple failed attempts at $122,500 with declining volume
❌ Close below $100,000 = trend reversal confirmed
The channel must resolve. Bitcoin is compressing near resistance after a year of respecting this structure. A breakout above $122,500 with volume opens the door to $130K+. However, failure to hold mid-channel support could send us to test the lower boundary around $105K.
Watch for that decisive move - volume will tell the story.
Not financial advice - DYOR.

BTC (LONG)BINANCE:BTCUSDT
Entry range (111600- 113000)
SL 109977
T1 124 900
T2 131 600
Extra Target is optional 139000
_______________________________________________________
Golden Advices.
********************
* collect the coin slowly in the entry range.
* Please calculate your losses before the entry.
* Do not enter any trade you find it not suitable for you.
* No FOMO - No Rush , it is a long journey.

Bitcoin - October 4th '25This is what I see.
Includes:
50% rule implementation
Sentiment Evaluation (Personal)
Candle Patterning Evaluation (Personal)
FVG Structure
Local Support
Price Percentage Change
Enjoy!
Mr. Storm

BTC Continuation Going to risk some at range low as continuation setup of bullish order flow.
the Q, is : Are they will hit ATH before new week start?
if yes , money made.
if no, into the next.

BTCUSD BITCOIN ADVANCED STRUCTURE BITCOIN OVERSIGHT AND CORRECTIONS FOR EDUCATIONAL PURPOSE ONLY
(1)DEMAND FLOOR AT 109,060.77 was a retest to the neckline of double bottom a bullish price action signal on daily candle close as illustrated from our line chart and it came with another confluence from an ascending trendline to add more impetus to the buy rally and many missed and lost money too.
(2) SUPPLY ROOF 117,383.70 a previous demand floor on daily after break of structure it became supply roof and stopped upswing twice ,but due to buy rally that key level is broken after 2 retested attempt ,on technical a broken supply roof is now our demand floor except the sell order exceed buy order that zone 117,383.70 holds support on daily candle close .
(3) 123,387-124,478.66-125k daily supply roof and our current all time high .
this zone has an ascending trendline connecting the two highs and on technical the next high should be 127,071-128k for sell in the direction of the previous two all time highs(123,387-124,478.66)
my ideal zone to attempt sell should be 127,071-128k zone
note ;you can avoid selling and wait for buy zone 117,383.70 and its possible tat price wont return to this level.
trading is 100% a game of probability.(win/loss) comes with it.
No holy gril,nothing like best strategy.
what we have is masters in RISK MANAGEMENT,THE BEST TRADERS ARE EXPERTS IN RISK MANAGEMENT,THEY ALL HAVE ZERO EMOTION,THEY DONT CHASE WHAT IS LOST.
GOODLUCK
#BITCOIN #BTCUSDT #BTC #CRYTO

Bitcoin: Healthy Corrections vs. Overextended RalliesIn my view, a truly healthy trend must include both upward moves and corrections. When Bitcoin rises too quickly without proper pullbacks, it often leads to sudden selling pressure.
For the update to my previous analysis, the new key support has formed at 119,613. If this level breaks, the next major support zone lies between 114,145 and 115,723.
⚠️ Keep in mind: this does not guarantee that Bitcoin will only find support in that zone—it could bounce earlier. However, this is the most important area to watch.
To maintain the overall bullish structure, Bitcoin must hold above 112,817.
On the other hand, if the price doesn’t fall below 119,613, it could signal strong buying power in the market. In that case, a period of consolidation (range-building) could provide the base for the next rally.
📈 A long setup above 122,799 would look attractive—but not at this moment. Waiting for confirmation is key.

BTCUSDT Long – Strong Reversal from Support, Trendline HoldingI’ve entered a long position on Bitcoin around 122,947, based on a clean technical reversal from the intraday support zone.
Reasoning:
🔹 Trendline Support Holding: BTC respected the ascending trendline and quickly reversed after dipping below 122,669, showing that buyers are still in control.
🔹 False Breakdown & Recovery: The quick bounce back above the breakdown level indicates a liquidity grab followed by strong bullish pressure.
🔹 Overall Bullish Structure: On higher timeframes, Bitcoin continues to make higher highs and higher lows — confirming an ongoing uptrend.
Trade Setup:
📍 Entry: 122,947
⛔ Stop Loss: 122,235
🎯 Target: 125,000 and above
As long as BTC holds above 122,600, I’ll maintain a bullish bias with expectations of a move toward 125K+.
A strong breakout above 125K could open the next leg higher.

#BTC heavy resistance zone!Cautious callback📊#BTC heavy resistance zone!Cautious callback📉
🧠From a structural perspective, we're currently near an overlapping resistance zone, raising the probability of a pullback. Therefore, proceed with caution when buying higher!
➡️A break below the uptrend support line would further strengthen the bearish outlook. At that point, look for shorting opportunities after a rebound.
⚠️If we continue to reach new all-time highs, the bearish outlook would be invalidated!
🤜If you like my analysis, please like 💖 and share 💬
BITGET:BTCUSDT.P

Will US Gov Shutdown Continue to Support Bitcoin Prices?Fundamental approach:
- Bitcoin prices this week have been driven by renewed risk appetite and positive spot ETF inflows, with sentiment supported by the US government shutdown’s data blackout and expectations of further Fed easing as labor market signals soften. The institutional demand narrative strengthened as US spot ETFs returned to inflows, with assets under management remaining elevated, thereby bolstering dip-buying interest.
- Drivers included a modest uptick in the ISM manufacturing PMI, which is still in contraction, and ADP private payrolls showing job losses, reinforcing the view that looser policy could persist and liquidity conditions may remain supportive for the crypto beta. The shutdown has curtailed government data releases, prompting markets to rely on private indicators and amplifying sensitivity to risk sentiment and ETF flow headlines throughout the week.
- Bitcoin prices could sustain momentum if ETF inflows remain positive and macro uncertainty keeps rate-cut expectations intact, though volatility may rise with limited official data.
Technical approach:
- BTCUSD broke the triangle pattern and rose higher, positioning itself above both EMAs, indicating an upward momentum.
- If BTCUSD remains above 117000, the price may retest the previous swing high at around 123000.
- On the contrary, closing below 117,000 may prompt BTCUSD to retest the broken triangle pattern and the area between both EMAs.
Analysis by: Dat Tong, Senior Financial Markets Strategist at Exness


BTC/USDT Update
📊 BTC/USDT Update
⚔️ This level is the battle line between Bulls 🐂 and Bears 🐻.
✅ Bullish as long as price holds above support.
❌ If this support breaks, expect BTC to dive below $90K 📉.
🔎 Stay alert — this zone will decide the next big move 🚀.

BITCOIN SUPPORTHello friends
Well, as you can see, we have entered a correction and I have found important support areas for you, if buyers support the price in these areas, the price can move to the specified targets.
*Trade safely with us*

The day will come which No one would believe BTC towards 222222Here I am expressing my Thought about BTC
if we look at the Previous Data
( TOP 10540 LOW 3621)
(LOW 3621 TOP 69198)
(TOP 69198 LOW 15443)
(LOW 15443 TOP would be 222222) by March 2026
From there we would be having two year downtrend and the LOW would be $76000 around December January 2028.
Those who believe and know this assets from the beginning they will certainly believe this possibilities .
This is not a financial advice so take your decision on your own
However everything is Possible in this world as more and more institutions are getting into it and everyday the tech is improving.
Remember me if this wild Prediction is going to be True.
Thanks,

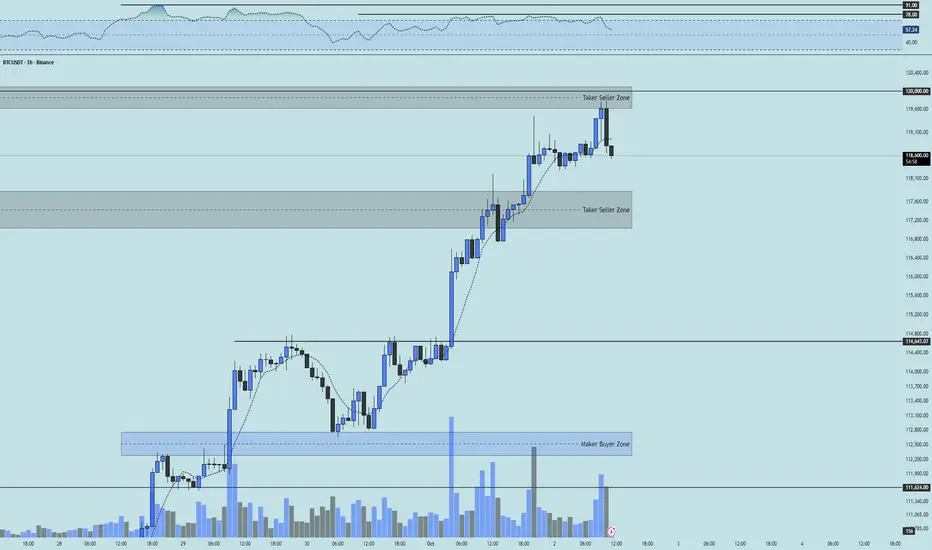
BTC 1H Analysis - Key Triggers Ahead | Day 50☃️ Welcome to the cryptos winter , I hope you’ve started your day well.
⏰ We’re analyzing BTC on the 1-Hour timeframe .
👀 On the 1H timeframe for Bitcoin, after breaking through the taker-seller zone around $117,550, price pushed up toward its resistance area near $120,000. From there, we’ve started to see early signs of rejection. With a 1H candle close rejecting this zone, we can say that after such a strong rally, Bitcoin is now entering its corrective phase, moving back toward its key support levels. Let’s break it down deeper.
🧮 The RSI oscillator, after consolidating for about 1 day and 6 hours around the overbuy boundary, has now started to exit that zone. This suggests potential downside momentum toward its key swing supports. Keep in mind, a static swing resistance formed at the 78 level in overbuy territory. If that breaks — along with the taker-seller zone — long trades could push RSI up toward 91 before facing a possible rejection (a less likely scenario for now). At this stage, I don’t have a clear key support zone to highlight, but with corrective structure forming, I’ll point out the levels to watch in future updates.
🕯 Today’s buying candles expanded slightly in size and volume following the weaker USD news. However, because the move up has been sharp and the number of selling candles limited, hitting the taker-seller zone increases the probability of a pullback. A strong close with solid selling volume would confirm corrective pressure for Bitcoin.
🧠 I believe the smarter approach is to wait for the corrective structure to play out first. Once the new resistance levels are defined and broken, we can look for setups. Keep in mind, shorting here isn’t ideal — the broader trend is still strongly bullish and momentum is very powerful. The goal is to position for the next high-probability move, not fight the trend.
↗️ Long scenario: A Bitcoin long could be considered on a clean break above RSI 78 combined with a strong candle close above the marked taker-seller zone, ideally supported by increasing buy volume. Multi-timeframe candle setups would give stronger confirmation for entry.
📉 Short scenario: At the moment, I don’t see a high-probability short setup. Long positions are simply carrying more edge (and dopamine).
❤️ Disclaimer : This analysis is purely based on my personal opinion and I only trade if the stated triggers are activated .