Bitcoin’s Next Big Move: Buy the Dip Before $138K!Hello guys!
Bitcoin is once again at a critical stage, and the chart is giving us a clear roadmap for the next move. Let’s break it down:
Current Setup
Price is holding above $108K–109K and has shown strength around the $103K support zone.
The structure remains bullish as long as BTC trades above $100K.
Strategy
1- Entry zones for buying:
Current market price (~$109K)
Support zone around $103K (a good second chance for buyers).
2- Stop-loss: Around $99K, just below the psychological and structural support of $100K.
3- Target: Upside potential points toward $138K , which aligns with the next major resistance zone.
⚠️ Risk Factor
If BTC breaks below $100K, the bullish phase ends, and we should expect a bearish shift in momentum. In that case, caution and defensive trading will be the smarter play.
📌 Conclusion
For now, the play is simple:
👉 Stay bullish and buy dips while BTC is above $100K.
👉 Watch the $103K zone for re-entries.
👉 Protect your capital with a $99K stop-loss.
👉 Aim high-> the next big target sits around $138K.
USTBTC trade ideas

#BTC/USDT Analysis: Key Level to Watch#BTC
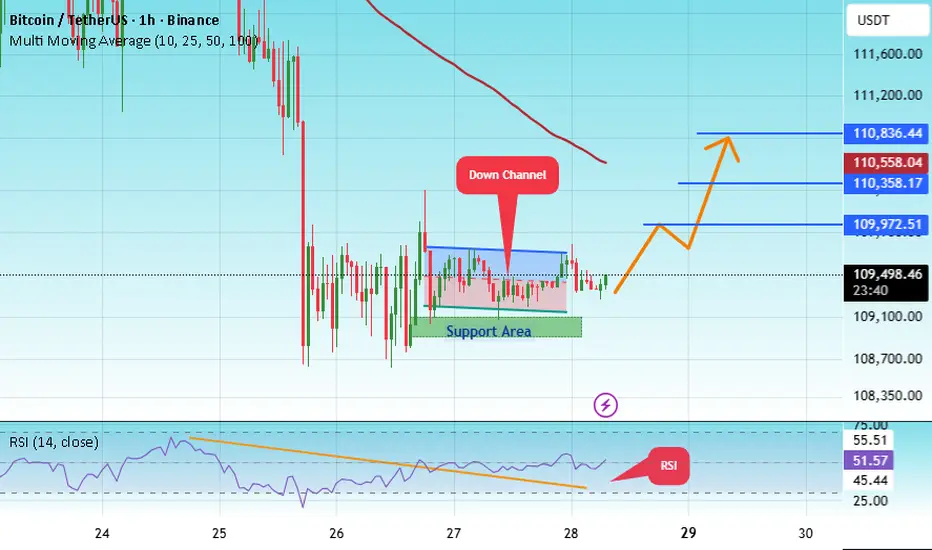
The price is moving within a descending channel on the 1-hour frame, adhering well to it, and is heading for a strong breakout and retest.
We have a bearish trend on the RSI indicator that is about to be broken and retested, which supports the upward breakout.
There is a major support area in green at 109100, representing a strong support point.
We are heading for consolidation above the 100 moving average.
Entry price: 109470.
First target: 109900.
Second target: 110360.
Third target: 110836.
Don't forget a simple matter: capital management.
When you reach the first target, save some money and then change your stop-loss order to an entry order.
For inquiries, please leave a comment.
Thank you.
BTC STILL IN TREND FOR MORE.. UPDATE 04-10-2025📊 Market Update
Bitcoin (BTC):
Bitcoin is maintaining its main upward trend, which continues to define the overall bullish structure. At the moment, BTC is trading in a new lower time-frame zone and needs to hold above $121.6K to confirm a green (bullish) structure on the lower time frame.
Bitcoin is positive until now

#BTCUSDT Let Bitcoin make a new ATH#BTC
The price is moving in a descending channel on the 1-hour frame and is expected to break and continue upward.
We have a trend to stabilize above the 100 moving average once again.
We have a downtrend on the RSI indicator that supports the upward move with a breakout.
We have a major support area in green that pushed the price higher at 121,500.
Entry price: 122,200.
First target: 122,800.
Second target: 123,400.
Third target: 124,200.
To manage risk, don't forget stop loss and capital management.
When you reach the first target, save some profits and then change your stop order to an entry order.
For inquiries, please comment.
Thank you.

bitcoin BITCOIN ,THE CURRENT structure shows no slowing down by buyers, if they break 124k they will head straight into 135k-145k zone .my goal is to see what buyer will do on the supply roof of the bullish channel.
layer by layer


BTCUSDT LongBullish points
1. Support area
2. Daily breaker block
3. Tested 0.68 fib level of last
aggresive buy leg
4. Hidden bullish divergence
5. Price above Bull market
support band

BTC OutlookI strongly believe BTC reached the ultimate top. Sell the Top!
I predicted the 2022 BTC bottom, now I predict the 2025 top.

BTC ANALYSIS🔮 #BTC Analysis 🚀🚀
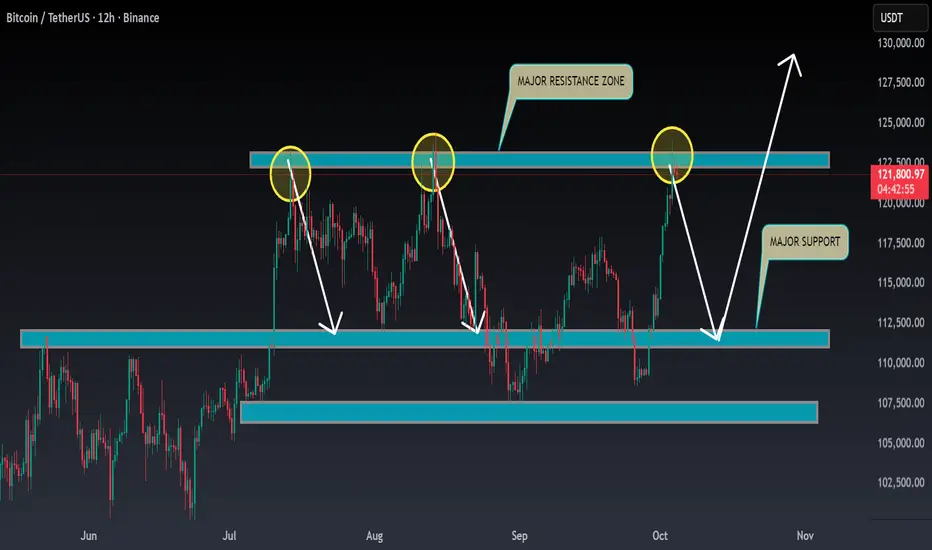
💲💲 #BTC is trading between support and resistance area. There is a potential rejection again from its resistance zone and pullback from support zone. If #BTC breaks the major resistance zone then we would see a bullish move or else we will get a downfall towards its major support zone
💸Current Price -- $1,21,800
⁉️ What to do?
- We have marked crucial levels in the chart . We can trade according to the chart and make some profits. 🚀💸
#BTC #Cryptocurrency #DYOR
[SeoVereign] BITCOIN BEARISH Outlook – October, 03 2025The core basis for presenting a bearish perspective in this idea consists of two main points.
First, within the Double Zigzag pattern, each zigzag forms a 1:1 length ratio.
WAVE.Y1=WAVE.Z1
For easier identification, I have illustrated this section in the chart below.
The second is ZIF.
ZIF (Zone of Interpretive Freedom) is a concept I devised myself, and it refers to the price range between the 1.0 ratio and the 1.414 ratio when Fibonacci retracement is drawn.
This range serves as a critical zone for determining the validity of the idea, and as long as the range is not breached, the strategy is considered to remain valid. Also, the closing basis of ZIF is the daily candle’s closing price.
Simply moving outside of ZIF does not immediately invalidate the perspective.
Although the high of September 18 has been broken upward as of the current point in time, I regard this upward breakout as a false breakout (whipsaw).
The reason is that leading altcoins are moving sideways, failing to follow Bitcoin’s movement, and are showing declining momentum.
Accordingly, the average target price is set around 112.970 USDT.
Additional briefings will be continuously updated to this idea as the chart develops.

Bitcoin looks bullish. Bitcoin broke out of the falling channel with a high volume candlestick. If the 1 D candle closes above the 118,000 resistance, Bitcoin will reach a new ath. A small retest after breaking the 118,000 level could be an opportunity to buy Bitcoin. However, it is still beneficial to consider the fundamental risks.

BTC - Testing Key LevelHere is an update to my last post:
In my last post I was outlining how BTC was trying to hold the support of the trendline. For a brief period of time, price did breakdown to create a "false break" of the trendline.
However this still created a higher low in the trend still representing bullish momentum.
Once price reclaimed the green trendline we have seen a large rally back to the upside.
Now, BTC is testing our key level of resistance "Mid Term Resistance". This red box has acted as a great sell zone before price made a move back to the downside. So what's next?
If BTC can start closing candles above our red box then watch for these level to the upside.
Level 1: $120,000-120,400 (Key daily level)
Level 2: $123,200-124,400 (ATH)
Level 3: $129,000-$130,000 (first 1.618)
Level 4: $135,400 (predictive 1.618 top)
However, if price get rejected again from the red box, we want to see either the green trendline or green box hold to create another higher low. If we fail to create a higher low that could represent the start of the next bear market, but for now the trend is intact!

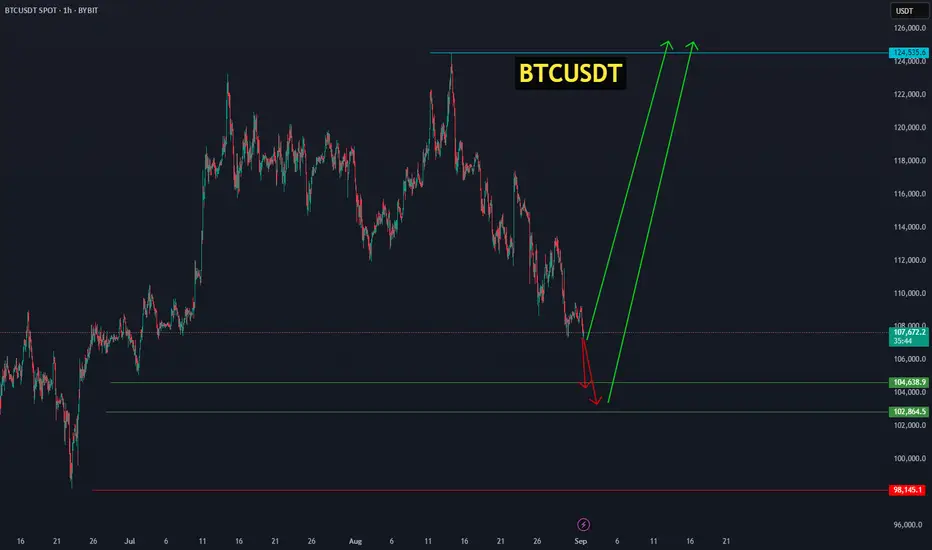
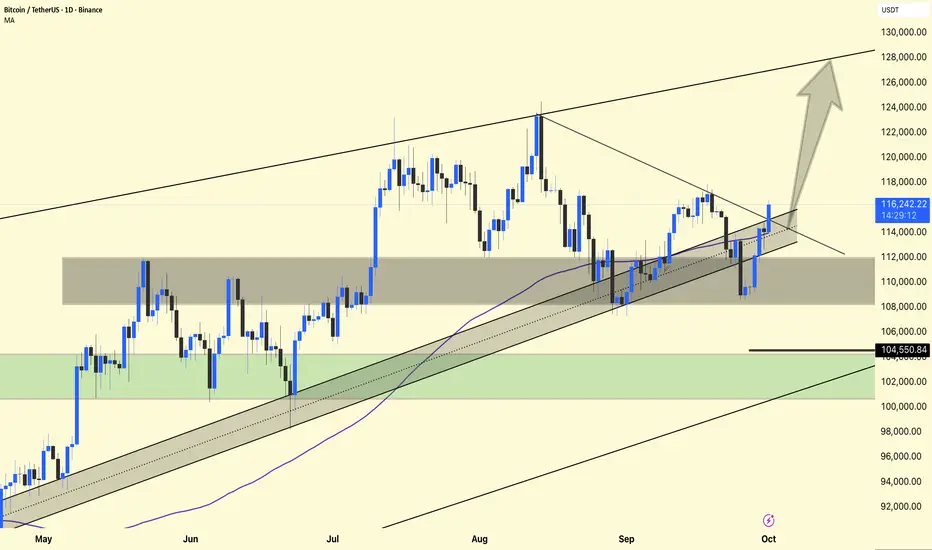
Bitcoin from the 102,864 zone is set to ignite its next bullish Bitcoin will either start its upward move from the current price or from the range of 104,638.9 – 102,864.5, aiming for targets between 118,000 and 124,535. BINANCE:BTCUSDT
$BTC SURPRISED $123K PROFIT DONE ($111K-$122K)CRYPTOCAP:BTC SURPRISED STEP BY STEP
$111K $115K $122K
2026 WILL MORE SURPRISED 2028 OF FUTURE
$122K $133K $144K $155K $166K $177K $188K $199K $211K
Bitcoin (BTC) to Hit Standard Chartered Predicts
At press time, it is trading within striking distance of a neW record high at $123,646.
The cryptocurrency's current record high of $124,517 was logged on Aug. 14 on Bitsamp. tandard Chartered believes that a prolonged shutdown will be bullish for Bitcoin. Kendrick has noted that Bitcoin has a positive correlation with U.S.
Treasury term premiums, which represent the extra yield that comes with holding longer-term bonds. They are currently on the rise due to significant uncertainty caused by the U.S. government shutdown.
Polymarket odds
According to Polymarket bettors, Bitcoin currently has a 7% chance of surpassing $200,000. At the same time, the odds of Bitcoin surpassing $135,000 as early as this October currently stand at 32%.
Meanwhile, there is also a 5% chance of Bitcoin dropping back below $100,000 this October.
#Write2Earn #BinanceSquareFamily #Binance #BTC☀ #SUBROOFFICIAL
Disclaimer: This article is for informational purposes only and does not constitute financial advice. Always conduct your own research before making any investment decisions. Digital asset prices are subject to high market risk and price volatility. The value of your investment may go down or up, and you may not get back the amount invested. You are solely responsible for your investment decisions and Binance is not available for any losses you may incur. Past performance is not a reliable predictor of future performance. You should only invest in products you are familiar with and where you understand the risks. You should carefully consider your investment experience, financial situation, investment objectives and risk tolerance and consult an independent financial adviser prior to making any investment.

BTC market snapshotThe U.S. government has gone into a shutdown, and crypto reacted with growth on the dollar’s weakness. HOWEVER, the short signal is strengthening. The monthly close reinforced the short signal for me personally, which doesn’t mean it will play out tomorrow. From current levels, there’s still a chance to update the highs if we break out above the 116K–117K zone.

Is Bitcoin ready to go parabolic?If you see us restart posting trading ideas, you know the news must be good. Bitcoin has once again crossed $120k. Interest rates are going down, liquidity is rising. The pathway to a new Bitcoin All-Time-High seems firmly in sight. Even Altcoins, not a source of great joy so far this cycle, have seen momentum. Ethereum, Solana and other large-cap Alts are hovering near all-time-highs. The 'meta' of Perp Dexes has propelled HYPE, the currency of Hyperliquid, into the Top 20 Market Cap coins. The 'catchup trade' for other Perp Dex tokens such as Aster saw tokens jump 100%+ in a matter of hours. The animal spirits are back.
In each crypto-cycle there are multiple simultaneous trends. Some of the are purely speculation, others are actual technical innovations, others are on the political front. This cycle so far has seen the by-far most positive political breakthroughs for the industry. Stablecoin bills and regulation in jurisdictions such as the US and Europe allowed stablecoin use-cases to reach breakout velocity. In line with that comes accessible yield, as stablecoins are often backed by US bond yields, and payments. On the scalability front, rollups, extremely fast chains, zero-knowledge scaling technology and next-gen chains such as Monad or MegaETH have become available and at least somewhat battle-tested. There is still no solution to the Blockchain trilemma of how to achieve scalability, speed and decentralization. Yet it is obvious that we are on the road to a solution. That is extremely bullish for the promise of Blockchains to eventually become the backbone for large parts of finance.
In the meantime, this cycle's crypto price action has not managed to keep up with stock markets. The boom of AI has led to ever higher highs for the largest benefactors such as Google or Nvidia. The proliferation of ETFs that give exposure to new 'hot' topics, from modular nuclear to data centers, has made stock investing extremely accessible to retail investors. Many of these retail investors have previous first-hand knowledge of crypto markets' volatility and have so far refused to re-enter in the same numbers as last seen during the 2021 Bull market.
Will a new Bitcoin all-time-high change this and lure traders back into crypto markets? The probability of this happening remains but the pathway is less obvious. First and foremost, Crypto needs to see 'large new winners'. Nothing gets a retail trader back like watching their friend earn significant returns from a 100x on a new coin. But too many retail traders lost out in this cycle's launches due to insiders, overvalued market caps and a general lack of demand. Too few genuine retail participants have 'won'. For now though, Bitcoin continues to rise higher. The cycle continues. We ride on.
Ichimuko talks againAccording to BTC price action based on ichimuko clouds we can see that the last time BTC have crossed the red cloud it leaded to a new Ath
Today is the first day of breaking it again
We expect a new ATH as soon as possible
Stop loss under the cloud around 11k
Tp at least 128k
Dyor

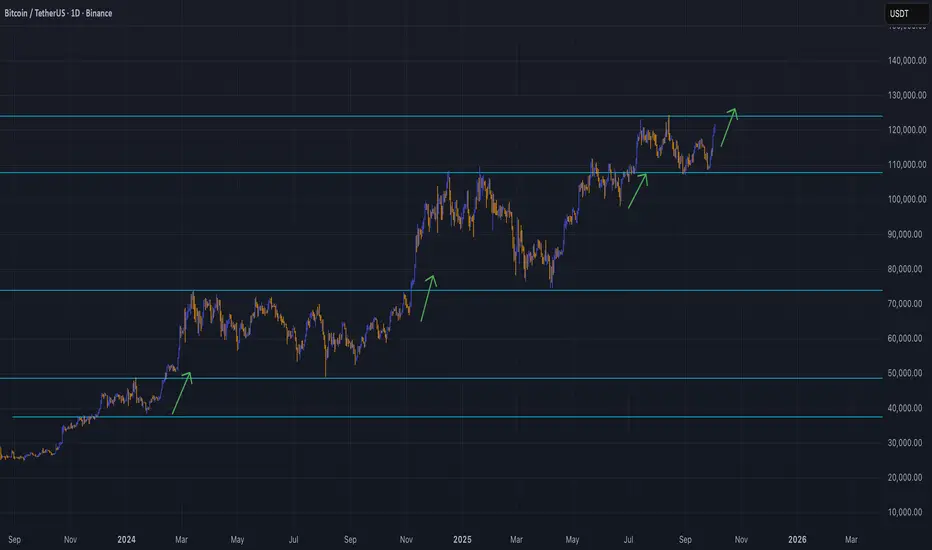
#BTC/USDT 1DAY CHART UPDATE !!BTC Trend Context: The price is within an ascending channel – overall, this suggests an upward trend in the market.
Support Testing: The lower boundary or support zone is being tested – this is a critical "decisive" area.
Rejection/Bounce Potential: If support holds and the price reacts upwards, we could see a further move upwards towards resistance.
Breakdown Risk: If the price breaks decisively below support, this could lead to a deeper decline or a trend reversal.
Btcusdt As long as btc stays below 124k the wyckoff distribution idea we saw in featured is still valid , with no OBV this pump is fake . Taker buy/sell ratio in binance is 1< meaning more selling pressure than buying . This pump is getting absorbed by the short term supply .. if etf inflows slows down a bit it will crash Btc . historically the market usually tops in Q4 each cycle and October is the month .. Goverment shot down will probably last 2 weeks no economic data will be released I don’t think the market will still be bullish with so much uncertainty I expect the markets to crash soon . Just my idea

First Major Bounce 81.1kThe last Short was clearly premature, and was based purely on a technical level. Volume bust through it. Had I have waited for a stall and confirmed Distribution, the situation would have been better.
Now that Shorts have been wiped, and the majority of the market is in a Long, I believe we can now drop to the first major bounce at 81.1k.
When one side starts winning for an extended period of time, the losing side becomes "Unfavourable". Many who opened a Short and lost, fear opening another.

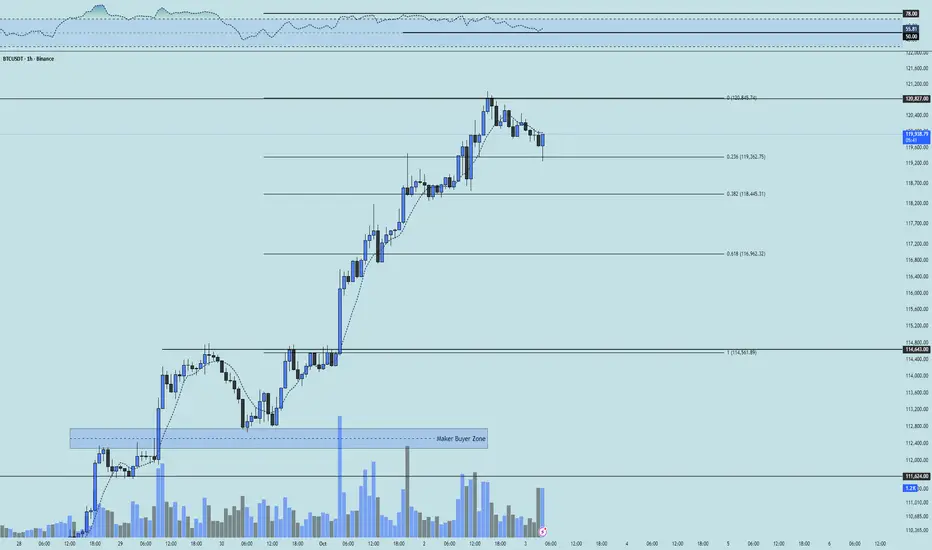
BTC 1H Analysis - Key Triggers Ahead | Day 51☃️ Welcome to the cryptos winter , I hope you’ve started your day well.
⏰ We’re analyzing BTC on the 1-Hour timeframe .
👀 On the 1-hour timeframe for Bitcoin, we can see that after this recent bullish leg, price has now reached its resistance at $120,827. If this resistance breaks — a zone packed with short orders — Bitcoin could start an extremely sharp and powerful upward leg, essentially triggering a short squeeze. At the moment, Bitcoin is entering a corrective phase; with the start of this correction, price could head down toward its Fibonacci retracement supports, bounce from one of those levels, and then form a new trading structure.
🧮 Looking at the RSI oscillator, price has been ranging around the 70 zone and briefly entered overbuy. It is now moving toward the 50 area, its oscillation mean. A break below 50 could deepen the correction, but if support holds, RSI could again head toward the resistance zone near 70 and re-test the overbought boundary.
🎮 The Fibonacci retracement drawn from the breakout at $114,562 to $120,827 highlights several strong support areas. The most important zones for Bitcoin are the 0.236 and 0.382 retracement levels. Support here, followed by a fresh structure, could set up strong trading opportunities.
🕯 The size and volume of buy candles have been exceptionally strong and increasing — something rarely seen in Bitcoin with such a one-sided move to the upside. Now, during this corrective phase, even as selling pressure appears, roughly 70% of that sell volume is being absorbed by buyers. What we must watch closely is how buyers decide to allocate capital from here. If the key Fibonacci levels are lost, we respect the market’s decision and only then consider new trades.
🧠 For a Bitcoin position If you don’t have an open position, I recommend waiting for a new structure to form at critical Fibonacci levels, and only enter after a breakout of that structure.
If you already hold a position, consider partial profit-taking, since USDT dominance has also reached an important support zone.
❤️ Disclaimer : This analysis is purely based on my personal opinion and I only trade if the stated triggers are activated .
Dominant Trend Chart Says - UPAfter identifying the Double Bottom, it appears we are heading UP
Today or Monday I'll add the AI's take on the market and get more refinement of what Bitcoin is trying to do

What if the bear market starts tomorrow 4th October 2025?Timeline Comparison. Unpopular opinion. According to previous trends of the last 2 cycles of Bitcoin.
