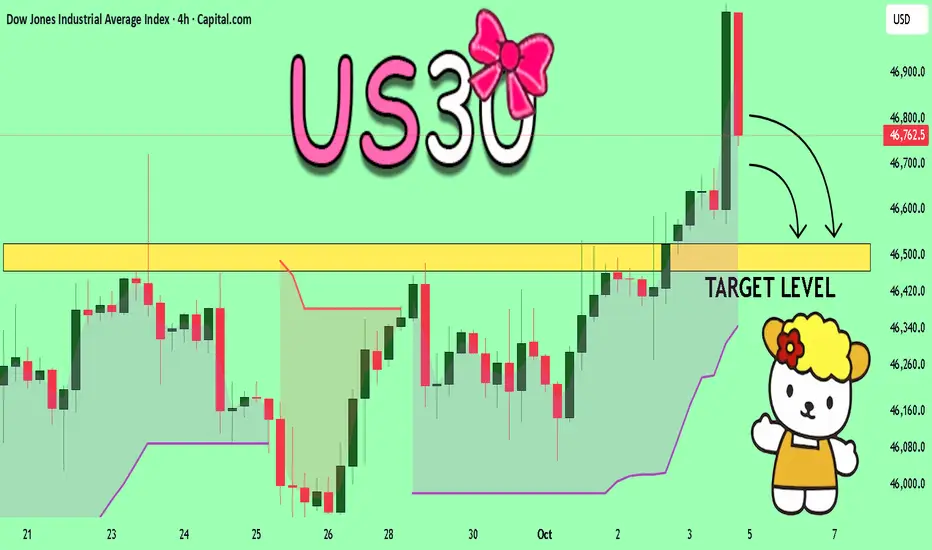
Dow Jones (US30) Analysis:The Dow Jones index continues to move in a short-term bearish trend, currently testing a key support level around 46,300.
🔻 Bearish Scenario:
If the price breaks below 46,300 and holds, it may head toward the liquidity zone near 46,100.
🔺 Bullish Scenario:
If the index rebounds from the current support and breaks above 46,490, it could push higher toward 46,650.
📌 Best Buy Zones: On a rebound from 46,300 or 46,100
📍 Best Sell Zone: Below 46,300
Trade ideas

DOW JonesUS 30 - DJI Dow Jones
- Bullish Channel as an corrective pattern in Short Time Frame
- Break of Structure
- Demand Zone
- Completed " 1234 " Impulsive Waves
- RSI - Divergence


Believe or not, it's not TrumpThis is where all your dollars are about to be made or lost depending on your faith. Watch and learn.

US30: Consecutive breakouts signal an emerging downtrend
SPREADEX:DJI – When price rejects the high, the market begins to shift
On the 30-minute chart, price action is clearly signaling a loss of bullish momentum and a transition toward a bearish structure.
________________________________________
🧠 Price Action Analysis
1. First Failed Breakout
Price initially broke above the ascending trendline that had held since early October — but failed to hold the breakout.
➤ A classic early warning of buyer exhaustion, often seen during distribution phases.
2. Multi-Layered Resistance Zone
The 46,725 – 46,779 region has become a clustered resistance zone, rejecting price repeatedly.
➤ Multiple rejections here suggest dominant selling pressure, with strong supply overhead.
3. Second False Breakout
A more subtle second breakout attempt followed — but again, price was swiftly rejected.
➤ Consecutive failed breakouts typically indicate a lack of conviction and precede sharp reversals.
________________________________________
📉 Trend Structure Has Shifted Bearish
• Lower highs and lower lows now visible
• Price broke below the previous trendline
• Pullback attempts failed to reclaim broken support
• Market is respecting resistance instead of support
➡ These are clear signs of a short-term downtrend emerging.
________________________________________
🔻 Trading Strategy: Favoring Sell Setups in the New Bearish Context
✴️ Scenario 1: Sell at Retest of Proven Resistance Zone
• Optimal Sell Zone: 46,700 – 46,750
• This area has already triggered two failed breakouts — a third touch could be the ideal trap for late buyers
• Watch for bearish rejection candles (pin bars, bearish engulfing, etc.)
Suggested Sell Limit Order:
→ Entry: 46,730
→ Stop Loss: 46,830 (above prior swing high)
→ TP1: 46,500
→ TP2: 46,300
→ Risk-Reward: At least 1:2
_______________________________________
✴️ Scenario 2: Momentum Sell on Breakdown of Local Support
• Trigger Level: 46,580 — if price breaks below with strong momentum (long red candle, increased volume)
• Confirms trend continuation after consolidation
Suggested Sell Breakout Order:
→ Entry: 46,580
→ Stop Loss: 46,680
→ Target: 46,350 – 46,200
→ Tip: Use smaller position size if breakout appears weak to avoid getting trapped in a fakeout
________________________________________
🎯 Trade Management
• Only enter trades with clear price rejection or momentum confirmation
• Move SL to breakeven after TP1 is hit to lock in safety
• Exit the trade if price closes above 46,830 — that would invalidate the bearish thesis
________________________________________
False breakouts leave a trail — for those who know how to read it. It's not a failure. It’s the market whispering that direction has changed.
Please like and comment below to support our traders. Your reactions will motivate us to do more analysis in the future 🙏✨
Harry Andrew @ ZuperView

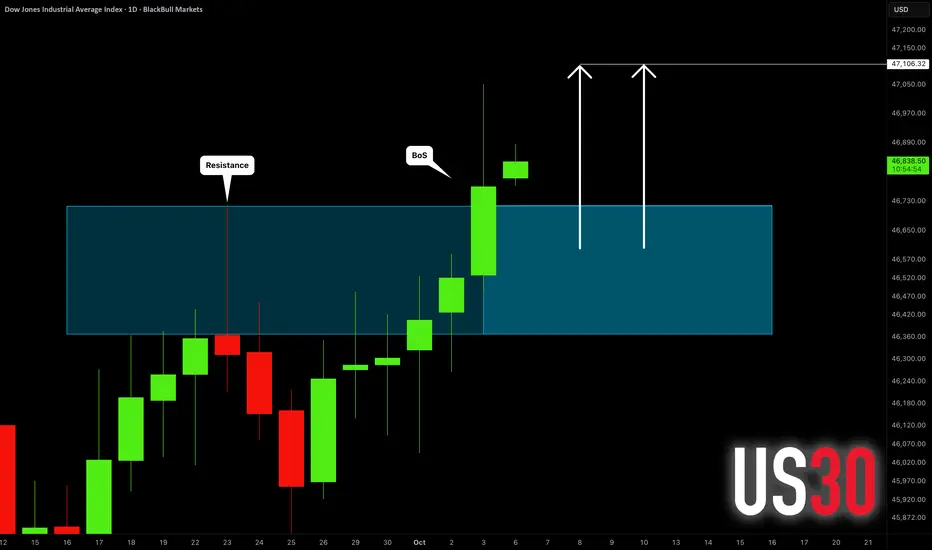
DOW JONES INDEX (US30): Another BoS Confirmed
US30 updated the all-time high on Friday, breaking and closing
above a major daily horizontal resistance cluster.
It opens a potential for more growth now.
Next resistance is 47100.
❤️Please, support my work with like, thank you!❤️
I am part of Trade Nation's Influencer program and receive a monthly fee for using their TradingView charts in my analysis.

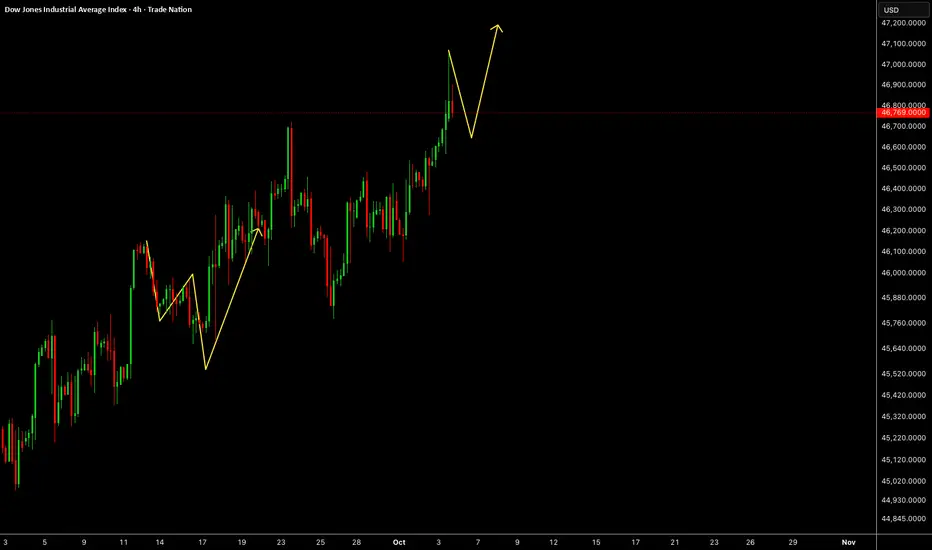
US30 LongDow is in a bullish trend and the current wedge has given a fakeout, therefore going long on US30, aiming for higher highs and higher lows.

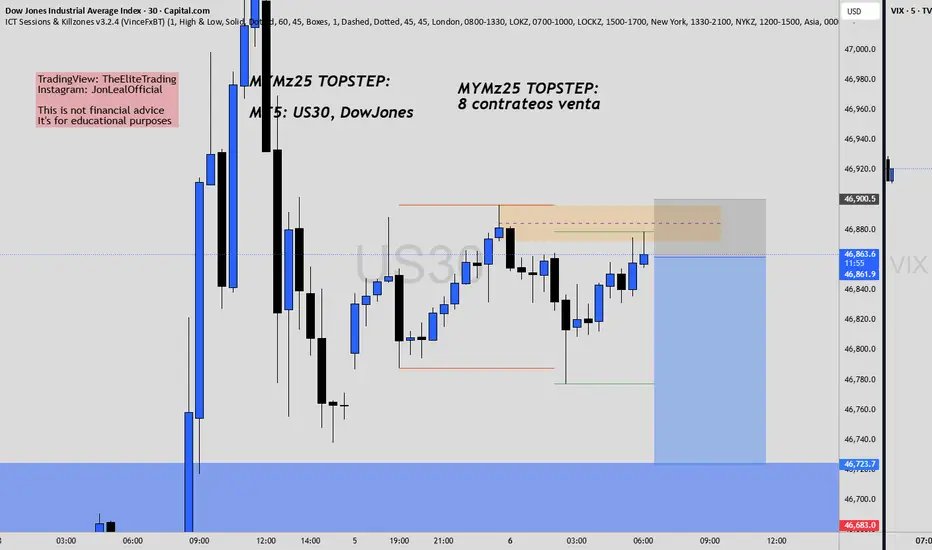
Buy at the weekly low to target the weekly opening price.The market has been forming two accumulations — a monthly one of buyers and a weekly one of sellers. This week, we can see the market holding at a price level that is generating seller accumulation. In my view, the price has the potential to break the bullish trend to sweep out the buyers involved in it and then create an institutional buy in this weekly liquidity zone, aiming again for the price level where the market opened this Monday.
Price action tends to seek equilibrium between Monday’s opening and Friday’s closing, often closing and opening within the same zone. Therefore, if the price drops, we could look for a buying opportunity. Let’s wait for the setup to form in the coming hours or tomorrow.

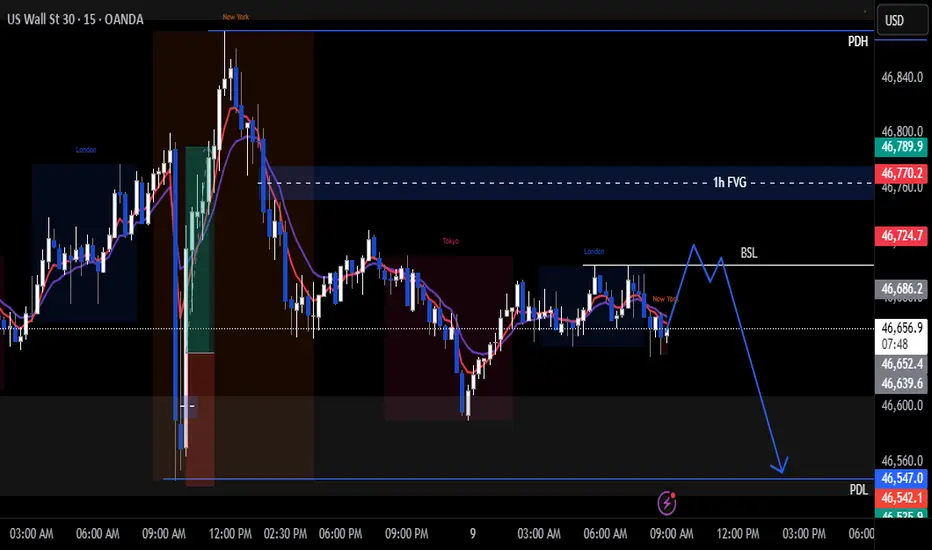
Us30 Trade Set Up Oct 9 2025overall i am bearish so i will be looking for sells after BSL/London highs get swept or the 1h FVG gets tapped to target PDL
www.tradingview.com
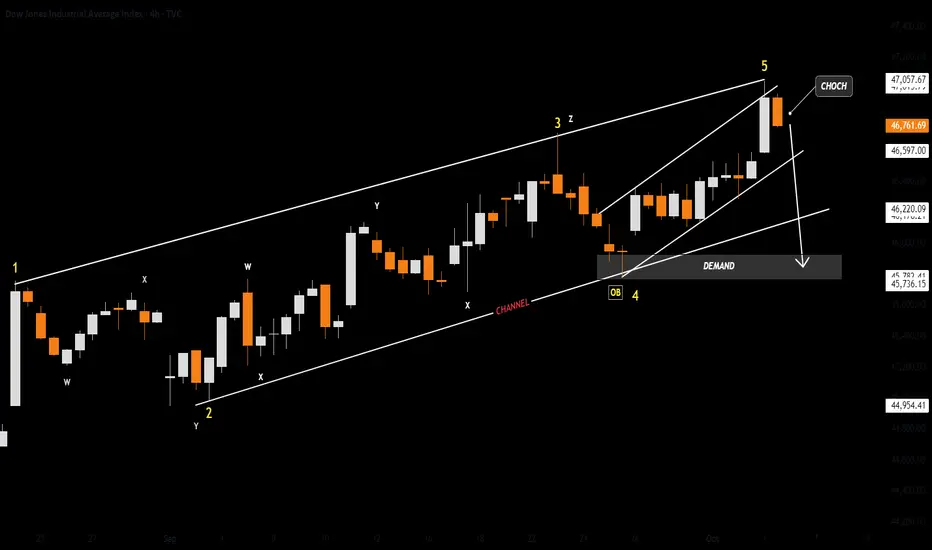
US30DJI - Dow Jones
- Break of Structure
- Bullish Channel as an corrective pattern in Short Time Frame
- Completed " 12345 " Impulsive Waves
- Change of Characteristics
- Order Block
US30 Will Collapse! SELL!
My dear followers,
This is my opinion on the US30 next move:
The asset is approaching an important pivot point 46.762
Bias - Bearish
Technical Indicators: Supper Trend generates a clear short signal while Pivot Point HL is currently determining the overall Bearish trend of the market.
Goal - 46.525
About Used Indicators:
For more efficient signals, super-trend is used in combination with other indicators like Pivot Points.
Disclosure: I am part of Trade Nation's Influencer program and receive a monthly fee for using their TradingView charts in my analysis.
———————————
WISH YOU ALL LUCK
US30 - Potential BuyHi traders,
We are looking to BUY CMCMARKETS:US30
Stay tuned :)
Price Action:
Short-term sell bias toward 41,700 zone based on lower high and projected weakness.
Watch reaction at 41,700—if buyers return strong with a new higher low, it resumes uptrend.
Invalidation: If price breaks above 42,800 with strength and closes above, sellers are overwhelmed—trend continues.
Good Luck :)
Study, Study, Study! Lorenzo Tarati

DowJones pre US Open key trading levelsKey Support and Resistance Levels
Resistance Level 1: 46908
Resistance Level 2: 47014
Resistance Level 3: 47210
Support Level 1: 46493
Support Level 2: 46409
Support Level 3: 46270
This communication is for informational purposes only and should not be viewed as any form of recommendation as to a particular course of action or as investment advice. It is not intended as an offer or solicitation for the purchase or sale of any financial instrument or as an official confirmation of any transaction. Opinions, estimates and assumptions expressed herein are made as of the date of this communication and are subject to change without notice. This communication has been prepared based upon information, including market prices, data and other information, believed to be reliable; however, Trade Nation does not warrant its completeness or accuracy. All market prices and market data contained in or attached to this communication are indicative and subject to change without notice.

Watch the Dow Industrial TrendlinesNext week 10/06/25 to 10/10/25 could see the convergence of two long- term Dow Jones Industrial Average (DJI) trendlines.
The trendline connecting the DJI January 2022 and December 2024 peaks is near the current DJI level.
Sometime prior support trendlines can become resistance.
The trendline connecting the bottoms made in October 2023, August 2024, and January 2025 converges with the peaks trendline next week!
The area of DJI 47,200 to 47,400 could be important resitance.
Watch the DJI trendlines!

Dow Jones US30 Analysis: Bullish Trend, Trade Plan📊 The US30 (Dow Jones) remains in a strong bullish trend, showing a clear sequence of higher highs and higher lows on the 4-hour chart 📈. However, when viewed on the daily timeframe, price now appears somewhat overextended ⚠️.
🔎 Dropping down to the lower timeframes and applying the Anchored VWAP (AVWAP) indicator, it’s evident that price is trading well above VWAP, signaling a premium zone. The risk here is that traders may continue buying into strength without acknowledging that price could easily retrace back into VWAP.
💡 Remember — smart money buys at a discount, not at a premium. In bullish trends like this, patience is crucial.
📹 In the video, I outline my trade plan, which focuses on waiting for a healthy pullback and then looking for a bullish setup if the structure aligns in our favor. I’m not interested in chasing price when it’s this extended — instead, I prefer to wait for the retracement and enter at better value, reducing risk and improving trade quality 🎯.
⚠️ Disclaimer: This analysis is for educational purposes only and not financial advice. Always trade responsibly and manage risk carefully.

US30US30 needs some more correction before pushing up.
Disclosure: We are part of Trade Nation's Influencer program and receive a monthly fee for using their TradingView charts in our analysis.
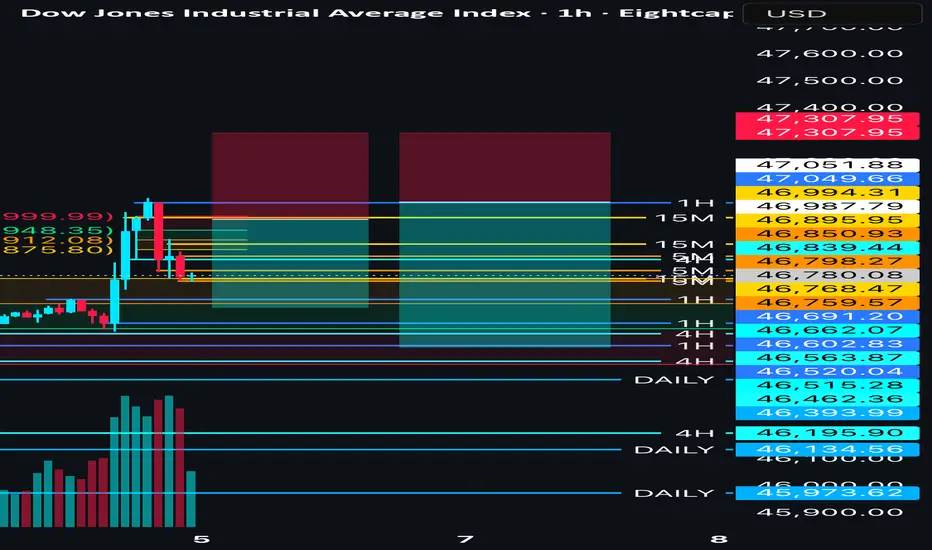
US30 1H🔹 Overall Outlook and Potential Price Movements
In the charts above, we have outlined the overall outlook and possible price movement paths.
As shown, each analysis highlights a key support or resistance zone near the current market price. The market’s reaction to these zones — whether a breakout or rejection — will likely determine the next direction of the price toward the specified levels.
⚠️ Important Note:
The purpose of these trading perspectives is to identify key upcoming price levels and assess potential market reactions. The provided analyses are not trading signals in any way.
✅ Recommendation for Use:
To make effective use of these analyses, it is advised to manually draw the marked zones on your chart. Then, on the 15-minute time frame, monitor the candlestick behavior and look for valid entry triggers before making any trading decisions.

US30Trading set up for Monday, us30 is that all-time high, potential short set ups, but then there could be possible longs if bounce off any of these levels?
US30 - High Volume Control & Liquidity🚨My personal view:
➡️The Low Season/3rd Quarter is behind us.
➡️Liquidity is crucial for fresh acceleration in the High Season/Last quarter.
------------------------------------------------------------------------------------------------------------
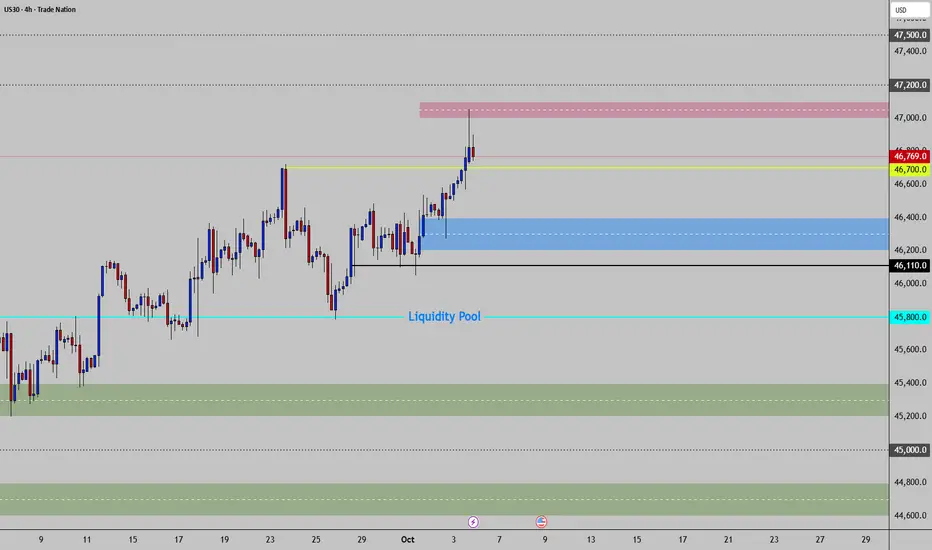
🎯 KEY PIVOT
📍 Zone Type: DEMAND
📊 Price Range: 46,200-46,400
📏 Distance: 569 points below current price with strong support history
📊 MAIN BIAS
🔵 Bias: BULLISH
📌 Context: Strong uptrend near all-time highs
💎 DIAMOND EDGE - Primary Setup
🎲 Direction: Long from current levels targeting 47,000-47,100
🔍 Confirmations:
✅Bullish momentum continuation above 46,700
✅Bullish momentum continuation above KEY PIVOT @ 46,200-46,400
✅Break above 47,000 with strong volume
⚠️ NOTE:
✅Price 231 points from resistance. Watch for rejection at 47,000-47,100.
🎯 Bullish Extension Targets - Discovery
T1: 47,200
T2: 47,500
-------------------------------------------------------------------------------------------------------------
🔄 BIAS FLIP SETUP- BEARISH🔴
💡 46,100-46,400 critical support - break changes structure.
⚡ Triggers:
➡️Multiple Rejection @ 47,000-47,100 Confirming Resistance as Supply Zone.
➡️Then Clear and decisive break below 46,200
🎲 Direction: Short from 46,100
🔍 Confirmations:
🟧Bearish rejection wicks at 47,000-47,100
🟧Break and close below 46,200
🎯 Targets:
T1: 45,600 - 45,800 ➡️➡️LIQUIDITY
T2: 45,200-45,400
T3: 44,600-44,800
⚠️ SESSION RULES
❌Avoid chasing between levels.
✅Use your 50% markers as targets in-between key high-volume areas.
🕐 Trade only NYSE - US session (9:30am-4pm EST)
📰 Monitor Fed policy, economic data
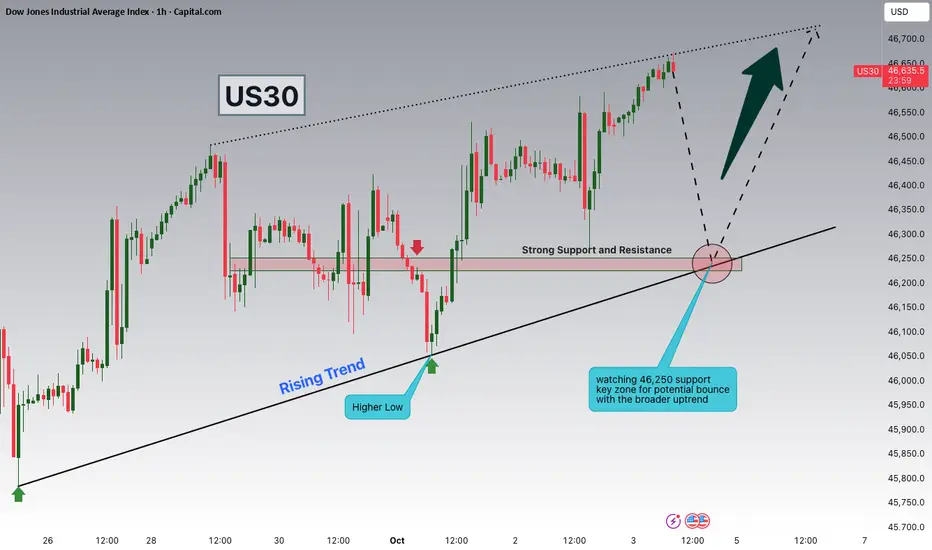
Dow Jones Watching 46,250 Support for Potential ContinuationHey Traders, in today’s trading session we are monitoring US30 for a potential buying opportunity around the 46,250 zone. The Dow Jones is trading in an uptrend and currently in a correction phase, with price moving toward this key support/resistance level.
Structure: The broader trend remains bullish, with pullbacks serving as corrections within the uptrend.
Key level in focus: 46,250 — an important support zone where price could stabilize and attract buyers.
Next move: Holding above 46,250 could open the door for continuation toward higher highs, while a breakdown would suggest a deeper retracement.
Trade safe,
Joe.
Wyckoff Distribution schematicsThis count is based on my assumptions so anything can happen not a trading or financial advice just for educational purposes only kindly do your own ta thanks trade with care good luck.
