Nasdaq Eyes Resistance: Pullback Before Year-End Highs?The Nasdaq posted another strong 2% rally yesterday, even after New York’s opening session swept liquidity by hunting early long positions before reversing higher. This behavior suggests that smart money continues to accumulate positions on dips. Currently, price is pressing into a key resistance zone, which has historically triggered short-term pullbacks. For today, a reasonable scenario would be a final tap into this resistance, followed by a retracement toward the Previous Day’s High (PDH)—a level that may now act as fresh support for bullish continuation.
From a fundamental perspective, investors remain optimistic as the market increasingly prices in the likelihood of a Federal Reserve rate cut in December, which historically boosts tech-heavy indices like the Nasdaq. Additionally, overall risk sentiment has improved, supported by strong corporate earnings and stabilizing inflation trends. If momentum continues, the Nasdaq could be setting up for a push toward new highs into year-end.
Trade ideas

NAS100 - Buy SetupTimeframes Used: Monthly → Weekly → Daily → 4H
Current Market Condition:
XAUUSD is a valid trade according to my system rules:
Monthly: Price is above the Cloud → Bullish
Weekly: Price is above the Cloud → Bullish
Daily: Price is above the Cloud → Bullish
----------------------------------------------------------------------------------------------------------------
Currently in trade on 4hr timeframe:
Entry: 25,072.29
Stoploss: 24,736.54

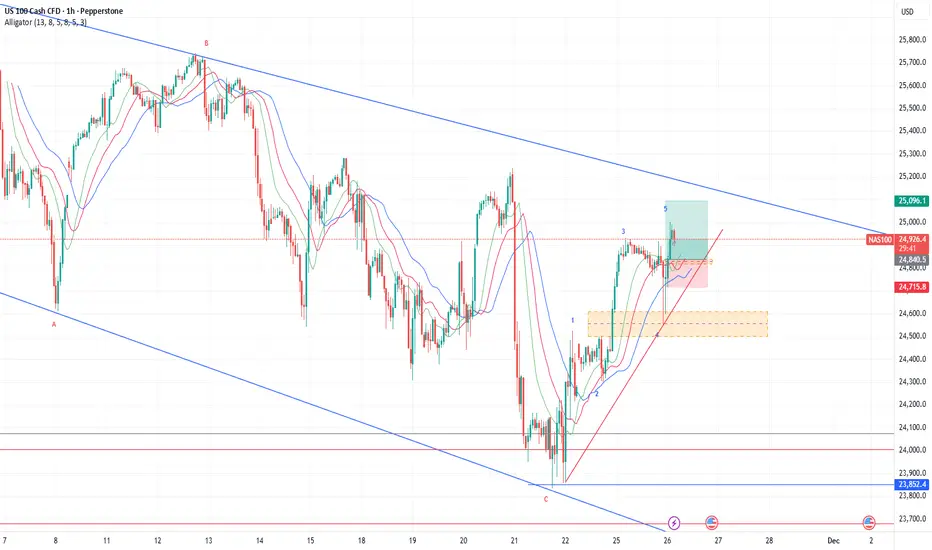
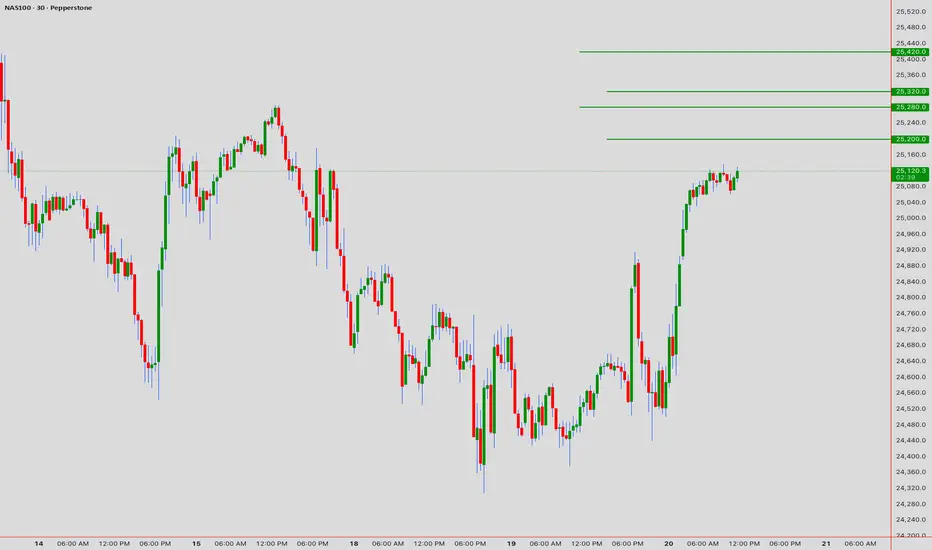
NQ1) Daily Bias: Buy
reason:
a) D1- above green line (bottom)
b) H4- above green line (top)
c) H1- above green line (top)
2) Setup: EW + ICT
reason:
a) D1- Correction Wave ( Wave C)
b) H4- Impulsive Wave ( Wave 5)
c) H1- Impulsive Wave ( Wave 5)
3) Confirmation entry:
a) H4/H1-trendline & above green line
b) H4/H1-fvg
c) Momentum Candle
4) Minimum Risk : Reward= 1:2
Bulls taking back control? I am definitely late to the part, missed entry at the dip. But if price holds above 24700. I believe we might reach those highs.

Nas 100 buy . Full Target already been done Nas 100 buy . Full Target already been done , I publish it in 1 minutes time frime, but not published 🤔

A down triangle is forming, tipical consolidation.A down triangle is forming, typical consolidation style, wait for it to break.
Nas100 RetraceThese combined technical factors typically precede price appreciation in the Nasdaq 100 , suggesting the index will likely continue to rise shortly based on trend-following and momentum-based trading strategies with limited immediate overbought risk

NAS100 Trade Set Up Nov 24 2025Price is making bullish structure on the 1h so i want to see an internal sweep of SSL followed by 1m-5m IFVG/CISD to target PDH and higher BSL

Next Nas100 GainThese combined technical factors typically precede price appreciation in the Nasdaq 100 , suggesting the index will likely continue to rise shortly based on trend-following and momentum-based trading strategies with limited immediate overbought risk

NASDAQ DEC 2025, Next week will unveil it all.I often like to use this approach, where I start from the most generic timeframe that still carries importance, moving into smaller timeframes narrowing the timeframe at each step, finally concluding with a short-term trade opportunity.
This post focuses solely on technical analysis, price action and trend behavior on the NDX. No fundamental expectations or macroeconomic interpretations are included.
I will be updating this post as trade opportunities develop.
A summary of this idea is provided at the end.
--- Long-Term Behavior ---
Long term outlook indicates that NDX had a strong bullish momentum until now, it pushed above the almost 5 year bullish trend marked with orange lines.
However, before it pushed above, NDX experienced a sharp decline. (marked with yellow circle)
But price carried back up with the yellow trend and created a much stronger bullish movement which managed to push further.
Now that stronger bullish movement is also over, NDX should be falling back for a retest. The last monthly candle was possibly the beginning of that retest movement.
After the retest two scenarios are possible, either it continues the bullish movement with a much higher pace or price fails to hold the retest and falls back toward the lower boundary of the previous long-term trend.
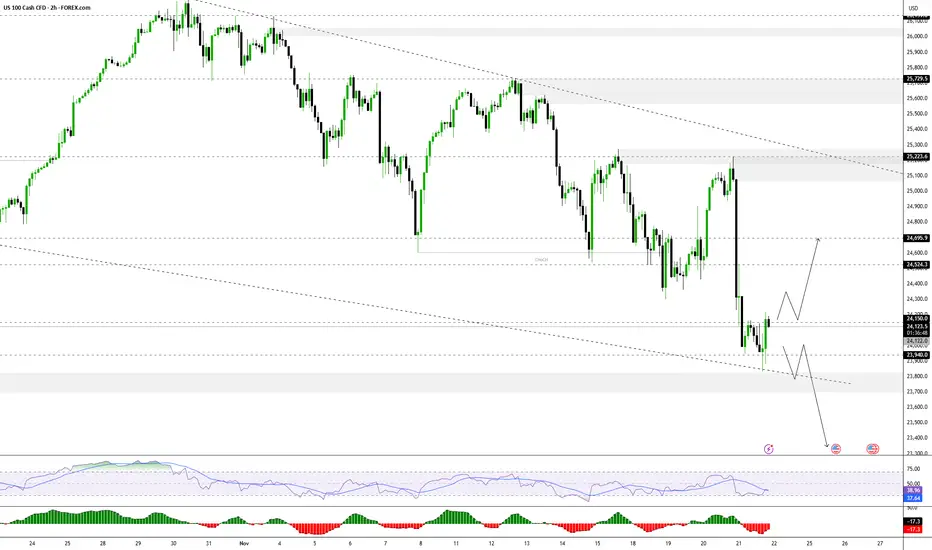
-- Short-Term Behavior --
In this section, I will be investigating the short-term movements to better predict a possible trade opportunity.
If we zoom into the yellow trend, the price was following a path estimated with the purple lines. Which also justifies the last months harsh fallback.
I expect NDX to start moving towards the lower boundary of the trend marked with yellow. (also, weekly RSI shows clear decrease in bullish momentum, indicating the yellow trend is coming to an end)
With all these in mind, to further predict the next 2-3 weeks movement, zooming into the last couple of months. NDX's last bearish movement, which I have shown with blue trend, can go two ways which the next weeks price movement will unveil. If the next week starts up bullish and the price fails to go down further NDX may rapidly rise. On the other hand, If it forms a steeper downtrend which I have shown in the second snapshot, it may possibly keep moving down for the long-term retest.
note that the trend drawings are estimations and may not be totally accurate.
-- Summary and Final Verdict --
Next week, we should see a clear directional bias for NDX
Bearish scenario: If price continues downward and establishes a steeper trend (as shown in the image), NDX is likely heading toward a full retest of the long-term breakout area.
Target: ~22,000
Bullish scenario: If the index shows clear signs of reversal and rejects further downside, a swift recovery toward previous highs is possible.
Target: ~26,500
I will be updating the post as we get a clearer image...

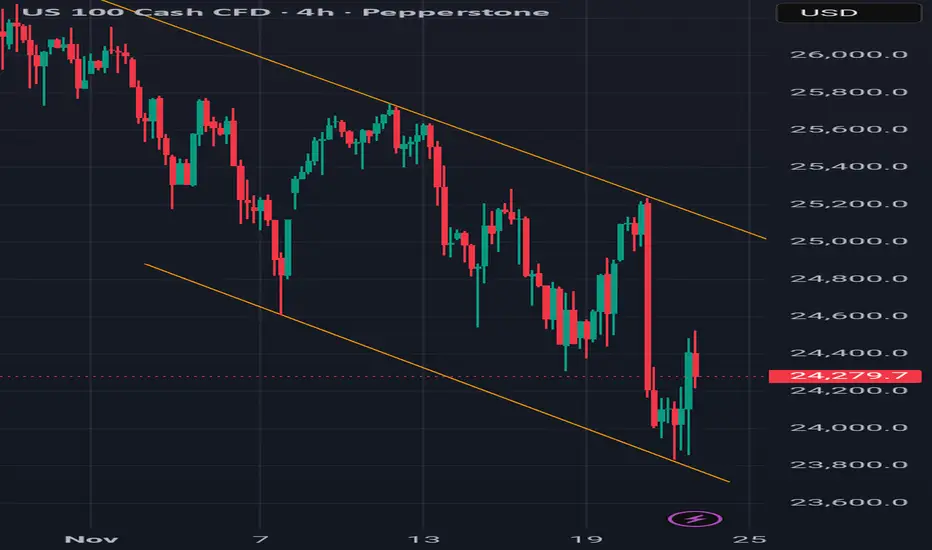
Momentum meets structure - Asset: US 100 Cash CFD
- Timeframe: 4H
- Structure: Descending channel (bearish trend)
- Momentum: Stochastic RSI (14,3,3) rising from oversold
- Event: Price bounced off lower trend line with stochastic confirming upward momentum
1. Trend Line Structure
- The descending channel defines a bearish environment.
- Price touches the lower boundary → potential support zone.
- This is a structural signal: price may bounce within the channel.
2. Stochastic Confirmation
- Stochastic RSI was in the oversold zone (<20).
- Lines are now crossing upward, signaling momentum shift.
- This is a momentum signal: buyers are stepping in.
3. Confluence = High-Probability Setup
- Structure (trendline support) + Momentum (stochastic reversal) = confluence.
- This increases the probability of a short-term bullish move toward the upper trend line.
-Price action within a descending channel shows a bounce off support. Stochastic RSI confirms momentum shift from oversold. This confluence offers a textbook example of how structure and momentum combine for a high-probability setup.
This setup teaches traders to:
- Wait for confluence, not isolated signals.
- Use stochastic to confirm trend line reactions.
- Respect the channel boundaries for targeting and risk.
NAS100 Trade Set Up Nov 21 2025Price is still under strong bearish pressure to i will look for internal 1m-5m structure to take sells to lower SSL levels

NASDAQ | Potential for Upside if Positive Tone is MaintainedNASDAQ Market Outlook | Potential for Upside if Positive Tone is Maintained
Currently, the NAS index remains under bearish pressure. Concerns about an AI bubble continue to weigh on technology stocks, even though Nvidia recently reported its highest revenue ever of $57 billion with strong growth guidance.
However, investors remain cautious due to the massive increase in spending on AI, perceived overvaluation of stocks, and the market's reliance on a few mega-cap companies.
Under these conditions, selling pressure in the technology sector continues and is affecting the movement of the USNAS100 index.
Price movement direction based on key levels:
As long as the price is below 23,940 → the trend remains bearish.
If the decline continues, the gradual decline target is in the following areas:
🔻 23,700 → 23,340 → 23,050
If the price rises and closes above 24,150 on the H1 timeframe → potential bullish correction
The corrective upward trend has the potential to move towards:
🔺 24,350 → 24,570
Analysis Conclusion
USNAS100 remains in a bearish trend as long as the price is unable to break through and maintain above the 23,940 level. Selling pressure is expected to intensify if the 23,700 support level is broken, opening the opportunity for a decline towards the 23,340 to 23,050 area.
NAS100 Trade Set Up Nov 20 2025Overall still bearish but first i want see a sweep of BSL and test for fib levels to then look for internal 5m-15m engulfing and IFVG/CISD to sell down to SSL/PDL

My thoughts on NAS100my thoughts on NAS100 .... Lets see if I am correct or, there's always a room for correction.

US Stock Market Danger SignalThere are more and more bearish signals coming in for Nasdaq and S&P 500. Big names started selling, more reports about possible correction, FED staying instead of cutting, market breadth is worse and close to previous correction and now the price is below the trendline.
I will go short with a close stop, do not want to risk too much.

NASDAQNASDAQ Analysis – Possible Early Pullback Before New York Session
The Nasdaq may experience a short-term correction during the London session and pre–New York, especially after yesterday’s explosive 550-point rally driven by Nvidia’s strong earnings.
Price is currently sitting on the 0.786 Fibonacci level, which is acting as a strong support and has been respected multiple times. At the same time, the index is positioned just below the descending trendline formed from the recent highs.
The fractal structure has now been completed, suggesting we could see a small bearish move before the New York session potentially resumes the bullish trend.
If price fails to break below the 0.786 support and instead breaks above the descending trendline, we could see continuation to the upside, targeting 25,300 in the next impulsive leg.

NAS100 Breakout Watch: Compression Before Expansion
The Nasdaq-100 index is trading at 25,130 , and the intraday price action is setting up what could be a high-probability move. Multiple technical frameworks are converging at a critical decision point. Let's dissect what's unfolding across the timeframes. 💹
Market Context & Structure
We're observing a Symmetrical Triangle pattern on the 1H chart that's been coiling for the past several hours. This compression zone between 25,080-25,185 represents a battleground between bulls and bears. The apex is approaching, which historically precedes volatility expansion.
From a Dow Theory lens, the intermediate trend remains bullish with higher highs and higher lows intact on the 4H timeframe. The recent pullback appears corrective rather than impulsive, suggesting the broader uptrend is still in play.
Wyckoff Analysis 📉
The overnight action exhibits classic Wyckoff accumulation characteristics within our consolidation range. We've seen:
Spring action down to 25,050 (stop hunt below support)
Absorption of selling pressure with diminishing volume
A Last Point of Support (LPS) forming around 25,090
This accumulation schematic suggests smart money positioning for the next markup phase.
Wave Count Perspective 🌊
Elliott Wave structure indicates we're likely completing a wave (4) triangle correction within a larger impulse. The internal labeling suggests:
Wave A-B-C-D-E triangle pattern nearing completion
Wave (5) target zone: 25,350-25,450
Invalidation level: Break below 25,020
The alternation principle supports this count, as wave (2) was a sharp zigzag, making a triangle for wave (4) textbook behavior.
Critical Levels & Zones 🎯
Upside Targets:
T1: 25,245 (initial resistance + prior pivot)
T2: 25,380 (Fibonacci extension 1.618)
T3: 25,525 (measured move from triangle)
Support Foundation:
S1: 25,085 (triangle baseline + EMA cluster)
S2: 25,020 (swing low + psychological)
S3: 24,890 (major demand zone)
Indicator Dashboard ⚡
RSI (1H): 52.4 - neutral, coiling with price
Stochastic: Curling up from 35, bullish crossover forming
VWAP: Currently at 25,118 acting as dynamic pivot
Ichimoku: Price inside the cloud (equilibrium), Tenkan/Kijun bullish twist imminent
Volume: Declining in range (typical pre-breakout behavior)
Harmonic Setup Recognition
A Gartley pattern completed at the 25,050 level with:
- X: 24,890
- A: 25,280
- B: 25,050 (0.618 retracement)
- D: PRZ achieved
This harmonic structure aligns perfectly with our Elliott wave count, adding confluence to the bullish thesis.
Actionable Trading Strategies 💼
Strategy 1 - Triangle Breakout:
Entry: 25,190 (break above triangle resistance + retest)
Target 1: 25,280
Target 2: 25,420
Stop: 25,080
Strategy 2 - Support Zone Buy:
Entry Zone: 25,085-25,095 (limit orders)
Target 1: 25,200
Target 2: 25,320
Stop: 25,035
Multi-Timeframe Sync 🕐
- 5M: Micro pullback entries and exits
- 15M: Trend confirmation via EMA alignment
- 1H: Primary pattern and trade direction
- 4H: Structural bias verification
The Bottom Line
NAS100 is coiled like a spring at 25,130. The technical evidence suggests accumulation is wrapping up, with multiple methodologies pointing toward upside resolution. The 25,190 breakout level is your line in the sand—above it, the path opens to 25,400+. Below 25,080 invalidates the immediate bullish setup.
Stay alert for the breakout, but don't force trades inside the range. Patience now equals profits later. ⚡
---
Risk Disclosure: Trading derivatives carries substantial risk. This analysis is educational only and not financial advice. Trade responsibly.
US100 shortlooks like that the market wants to "fight" against the liquidity that has been built yesterday... NY-opening I love u <3 xD

NSDQ100 under pressure ahead o Nvidia earningsThe tech-led selloff continues to intensify, with the S&P 500 logging a 4th straight decline and NASDAQ-100 futures under pressure again this morning. The core drag remains AI valuation fatigue, with the Magnificent 7 down nearly 8% from their October highs and edging toward correction territory. Weak macro data and disappointing earnings added to the risk-off tone, pushing the VIX up to 24.7, its highest in weeks, signaling elevated demand for downside protection in mega-cap tech.
Global equities are sitting at one-month lows as investors reassess whether the massive AI capex cycle will truly deliver near-term returns. That leaves Nvidia’s earnings after the bell as the pivotal catalyst: analysts expect >50% revenue growth, but with stretched positioning and fragile sentiment, the reaction may hinge more on guidance and sustainability of data-center demand rather than headline beats.
Political noise is also picking up but has limited direct intraday impact on NDX for now. Trump’s White House meeting with Saudi Arabia and hints about his shortlist for the next Fed Chair add background uncertainty, though markets will focus more on how the Fed leadership outlook may influence the 2025–26 rate path.
Bottom line for NDX traders:
Sentiment remains fragile, volatility is elevated, and the near-term direction will heavily depend on Nvidia earnings. A strong print could stabilize AI/tech momentum; a miss or cautious outlook risks accelerating the correction in the mega-cap complex.
Key Support and Resistance Levels
Resistance Level 1: 25093
Resistance Level 2: 25290
Resistance Level 3: 25510
Support Level 1: 24278
Support Level 2: 24095
Support Level 3: 23910
This communication is for informational purposes only and should not be viewed as any form of recommendation as to a particular course of action or as investment advice. It is not intended as an offer or solicitation for the purchase or sale of any financial instrument or as an official confirmation of any transaction. Opinions, estimates and assumptions expressed herein are made as of the date of this communication and are subject to change without notice. This communication has been prepared based upon information, including market prices, data and other information, believed to be reliable; however, Trade Nation does not warrant its completeness or accuracy. All market prices and market data contained in or attached to this communication are indicative and subject to change without notice.

NASDAQ 100
Sells
The market is showing clear signs of bearishness, evidenced by consecutive breaks of previous lows and sustained higher-timeframe downside momentum. With the daily timeframe continuing to push lower—breaking both the previous weekly low and the current daily low—the broader structure supports further selling pressure.
On the 4-hour (240) timeframe, momentum remains bearish, and price continues to form lower highs, reinforcing the downside bias. Although the market is currently ranging, this consolidation appears corrective rather than reversal-based. Because of this, I anticipate the market will likely continue selling, targeting lower pricing levels on the asset.

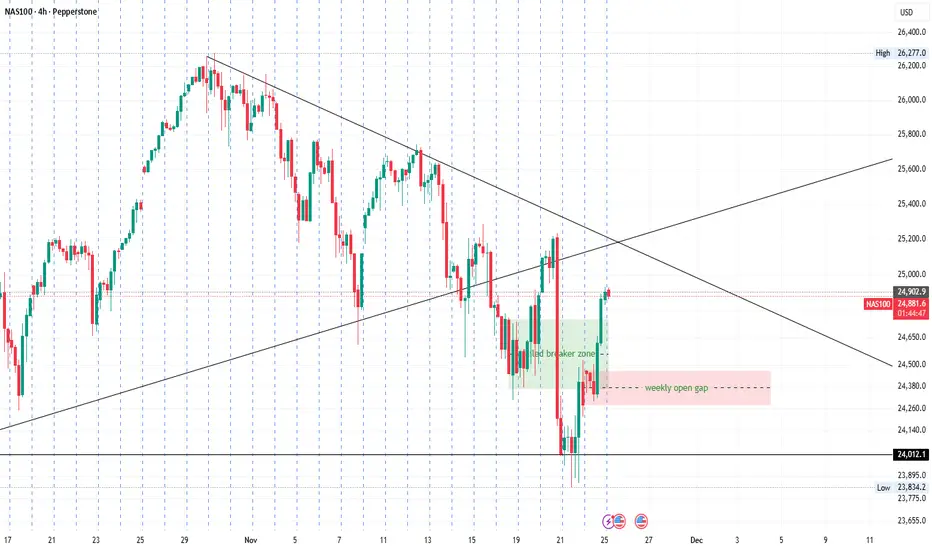
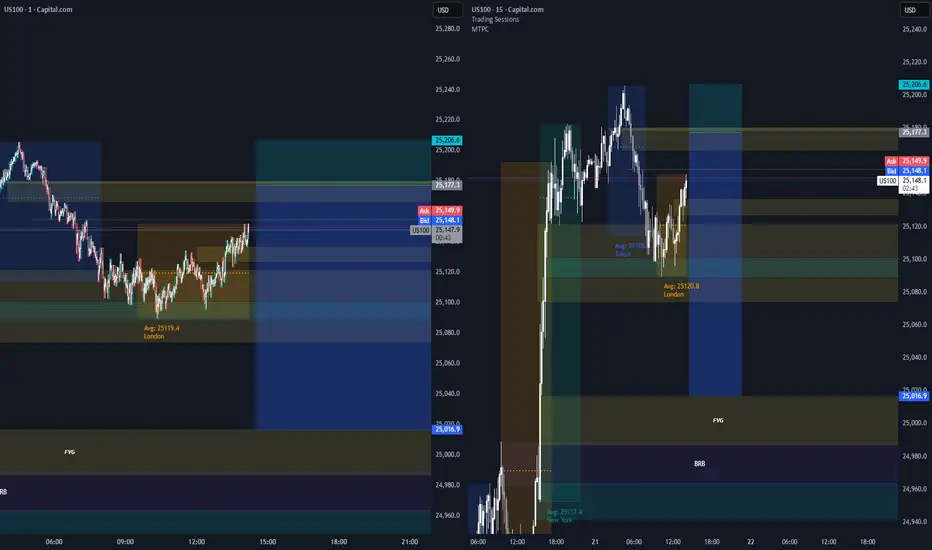
US100 – Missed Entry, but the Structure Was Perfect. Market Structure
The overall trend remains bearish. Price broke strongly below the previous Order Block, confirming sellers are still in control.
2. Order Block + Volume
The bearish OB was formed by a strong impulsive candle with high volume — a clear footprint of smart money. Price retraced but missed the entry zone by just a few points.
3. Liquidity
Before the major drop, price swept the liquidity above and instantly reversed. A classic pattern: liquidity grab → OB retest → sell-off.
4. Retest Logic
Even though the entry was missed, the V-Shark OB structure remained perfectly valid. When you follow the right logic, another opportunity always comes — no need to FOMO.
Conclusion
A missed entry doesn’t mean a bad analysis. It simply means the market didn’t offer the exact fill. Discipline over impulse — always.
Disclaimer
For educational purposes only. Not financial advice.
#VNShark #VSharkOB #OrderBlock #SmartMoneyConcept #PriceAction #Volume #Liquidity #US100 #NASDAQ #TradingView
