vbl chart end Analysis
Primary (Long-term) Trend
Downtrend / Distribution phase
Price peaked near ₹680 and has been making lower highs & lower lows
Long-term investors are still selling into rallies
Structure = Bearish to sideways, not a fresh bull trend yet
👉 Long-term trend has NOT reversed.
Intermediate /
Varun Beverages Ltd.
No trades
Next report date
—
Report period
—
EPS estimate
—
Revenue estimate
—
8.95 INR
30.36 B INR
216.85 B INR
1.31 B
About Varun Beverages Ltd.
Sector
Industry
Website
Headquarters
Gurugram
Founded
1995
IPO date
Nov 8, 2016
Identifiers
2
ISIN INE200M01039
Varun Beverages Ltd. engages in the manufacture and sale of beverages. The company products include carbonated soft drinks, non-carbonated beverages and packaged drinking water. It operates through the India and Outside India geographical segments. The company was founded by Ravi Kant Jaipuria on June 16, 1995 and is headquartered in Gurugram, India.
Related stocks

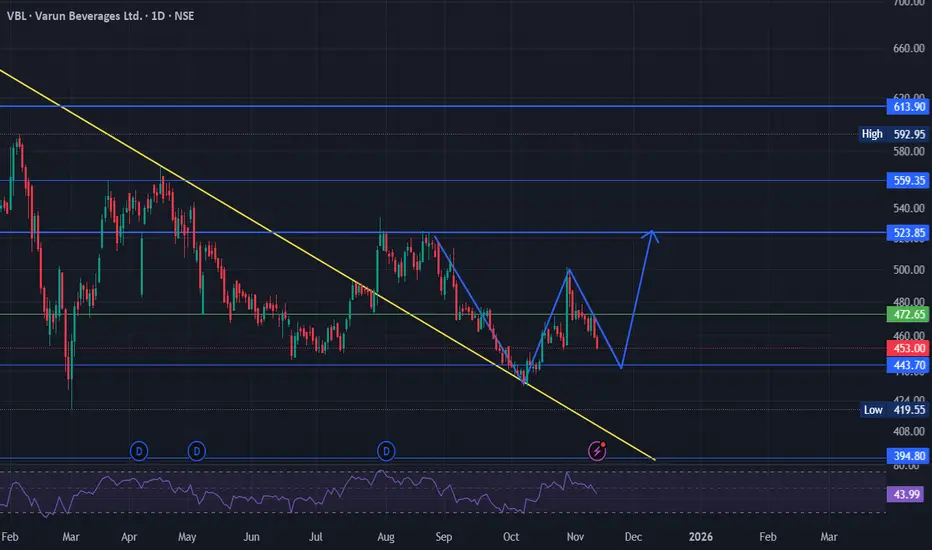
Varun Beverages Limited (VBL) Reedy to explode ? VBL has faced resistance by the 200 EMA 7 times in the past year and also basing out around 430-440 levels, a picture perfect wedge. The break is coming soon and with it an overdue bull run.
Fundamentals also look great, this can be a portfolio stock as well.
Personally i will be treating it as a

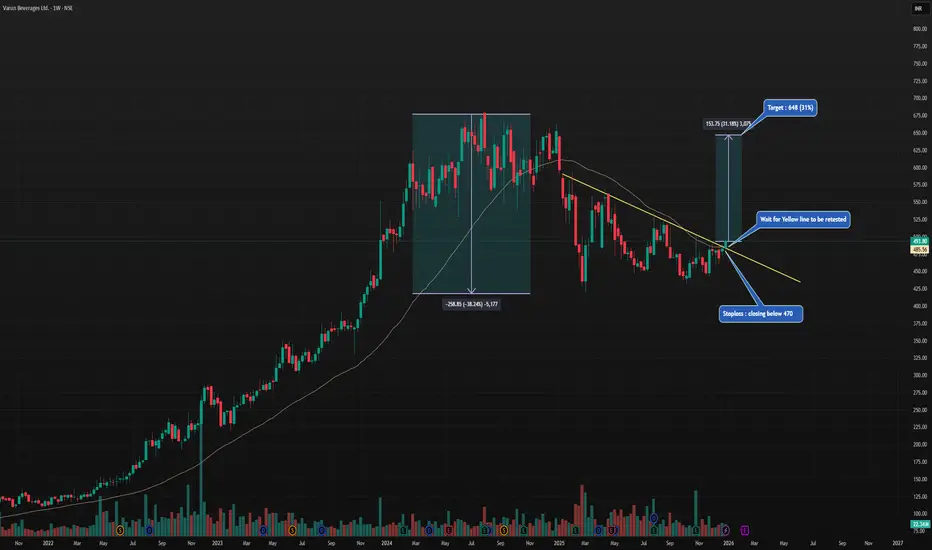
VBL : Ready to give you 30% within 06 MonthsHi Friends,
VBL looks promising now & ready for ~30% (648) upward journey. I am anticipating the stock to start its upward journey.
Targets, Stoploss & Entry are mentioned in the chart .
Please feel free to share your views regarding this chart & analysis .
Note : I am not a SEBI registered ad
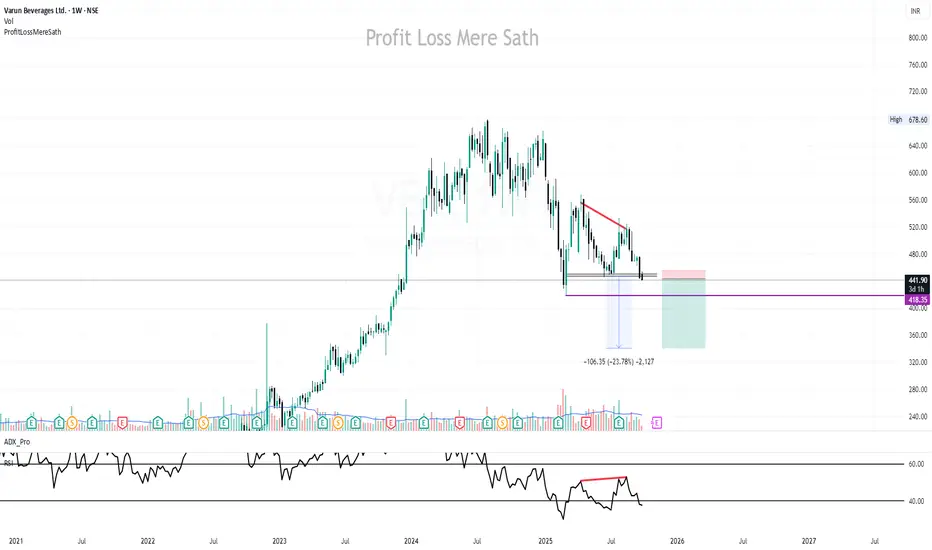
Varun Beverages Rebound Setup from Strong Weekly Demand ZoneThe price is respecting a major weekly demand zone around 440–460, showing multiple rejection wicks and a positive bounce, indicating buyer accumulation. As long as the price holds above this zone, the structure favors a potential upside toward the previous supply / resistance area near 620–640. A w

vblTarget Scenarios
Given the above, I lay out two plausible scenarios: a bullish rebound and a more conservative sideways/weak outcome. These are not predictions; they are what-if frameworks based on chart behaviour and risk.
Scenario A – Bullish Rebound
Assumptions: The support near ₹ 434-436 hold

VBL Vbl is breaks this trend line , target is high ,
Quarterly results, yearly result increasing, revenue,PAT increasing, new partnership with carlsberg in south africa , p a potential multibagger
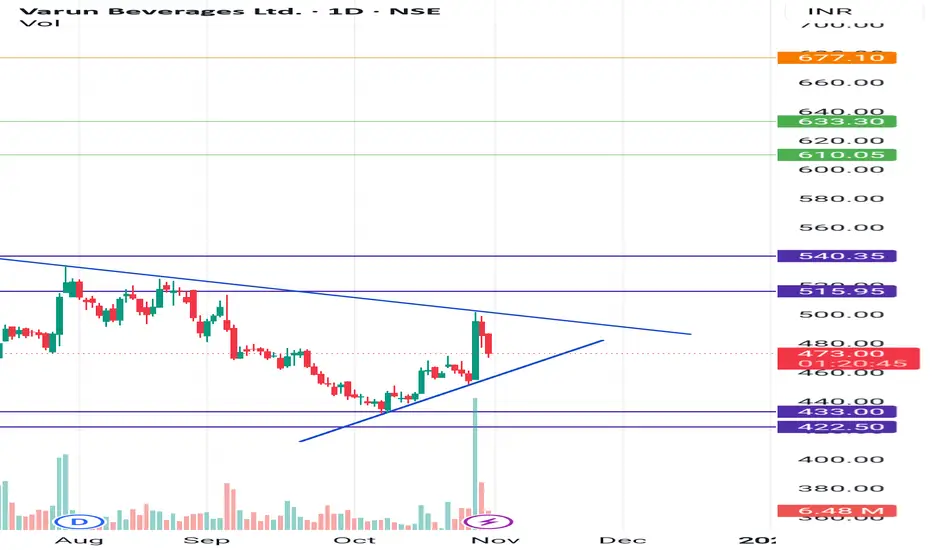
Varun Beverages Ltd for 30th Oct #VBLVarun Beverages Ltd for 30th Oct #VBL
Resistance 498 Watching above 498 for upside momentum.
Support area 491-492 Below 493 gnoring upside momentum for intraday
Watching below 491 for downside movement...
Above 498 ignoring downside move for intraday
Charts for Educational purposes only.
Please

Varun Beverages - Descending Channel Near Major Demand ZoneVarun Beverages (NSE: VBL) has been trading within a descending channel since April, consistently forming lower highs under a downward-sloping resistance line. The stock recently approached a major demand zone around ₹435–₹440, which has previously acted as a strong accumulation area.
Currently, pr

VBL | Short - based on dbl TOP | SL above 455 | Targets 418,340Disclaimer:
This is not financial advice. Please do your own research or consult with a financial advisor before making any investment decisions. Investments in stocks can be risky and may result in loss of capital.
See all ideas
Summarizing what the indicators are suggesting.
Neutral
SellBuy
Strong sellStrong buy
Strong sellSellNeutralBuyStrong buy
Neutral
SellBuy
Strong sellStrong buy
Strong sellSellNeutralBuyStrong buy
Neutral
SellBuy
Strong sellStrong buy
Strong sellSellNeutralBuyStrong buy
An aggregate view of professional's ratings.
Neutral
SellBuy
Strong sellStrong buy
Strong sellSellNeutralBuyStrong buy
Neutral
SellBuy
Strong sellStrong buy
Strong sellSellNeutralBuyStrong buy
Neutral
SellBuy
Strong sellStrong buy
Strong sellSellNeutralBuyStrong buy
Displays a symbol's price movements over previous years to identify recurring trends.
Frequently Asked Questions
The current price of VBL is 456.50 INR — it has increased by 4.17% in the past 24 hours. Watch Varun Beverages Ltd. stock price performance more closely on the chart.
Depending on the exchange, the stock ticker may vary. For instance, on NSE exchange Varun Beverages Ltd. stocks are traded under the ticker VBL.
VBL stock has fallen by −2.28% compared to the previous week, the month change is a −7.79% fall, over the last year Varun Beverages Ltd. has showed a −18.25% decrease.
We've gathered analysts' opinions on Varun Beverages Ltd. future price: according to them, VBL price has a max estimate of 716.00 INR and a min estimate of 470.00 INR. Watch VBL chart and read a more detailed Varun Beverages Ltd. stock forecast: see what analysts think of Varun Beverages Ltd. and suggest that you do with its stocks.
VBL stock is 1.76% volatile and has beta coefficient of 1.23. Track Varun Beverages Ltd. stock price on the chart and check out the list of the most volatile stocks — is Varun Beverages Ltd. there?
Today Varun Beverages Ltd. has the market capitalization of 1.55 T, it has decreased by −5.89% over the last week.
Yes, you can track Varun Beverages Ltd. financials in yearly and quarterly reports right on TradingView.
Varun Beverages Ltd. is going to release the next earnings report on May 5, 2026. Keep track of upcoming events with our Earnings Calendar.
VBL earnings for the last quarter are 0.74 INR per share, whereas the estimation was 1.08 INR resulting in a −31.40% surprise. The estimated earnings for the next quarter are 2.48 INR per share. See more details about Varun Beverages Ltd. earnings.
Varun Beverages Ltd. revenue for the last quarter amounts to 42.04 B INR, despite the estimated figure of 40.25 B INR. In the next quarter, revenue is expected to reach 61.54 B INR.
VBL net income for the last quarter is 2.52 B INR, while the quarter before that showed 7.41 B INR of net income which accounts for −66.03% change. Track more Varun Beverages Ltd. financial stats to get the full picture.
EBITDA measures a company's operating performance, its growth signifies an improvement in the efficiency of a company. Varun Beverages Ltd. EBITDA is 50.49 B INR, and current EBITDA margin is 23.28%. See more stats in Varun Beverages Ltd. financial statements.
Like other stocks, VBL shares are traded on stock exchanges, e.g. Nasdaq, Nyse, Euronext, and the easiest way to buy them is through an online stock broker. To do this, you need to open an account and follow a broker's procedures, then start trading. You can trade Varun Beverages Ltd. stock right from TradingView charts — choose your broker and connect to your account.
Investing in stocks requires a comprehensive research: you should carefully study all the available data, e.g. company's financials, related news, and its technical analysis. So Varun Beverages Ltd. technincal analysis shows the sell today, and its 1 week rating is sell. Since market conditions are prone to changes, it's worth looking a bit further into the future — according to the 1 month rating Varun Beverages Ltd. stock shows the sell signal. See more of Varun Beverages Ltd. technicals for a more comprehensive analysis.
If you're still not sure, try looking for inspiration in our curated watchlists.
If you're still not sure, try looking for inspiration in our curated watchlists.