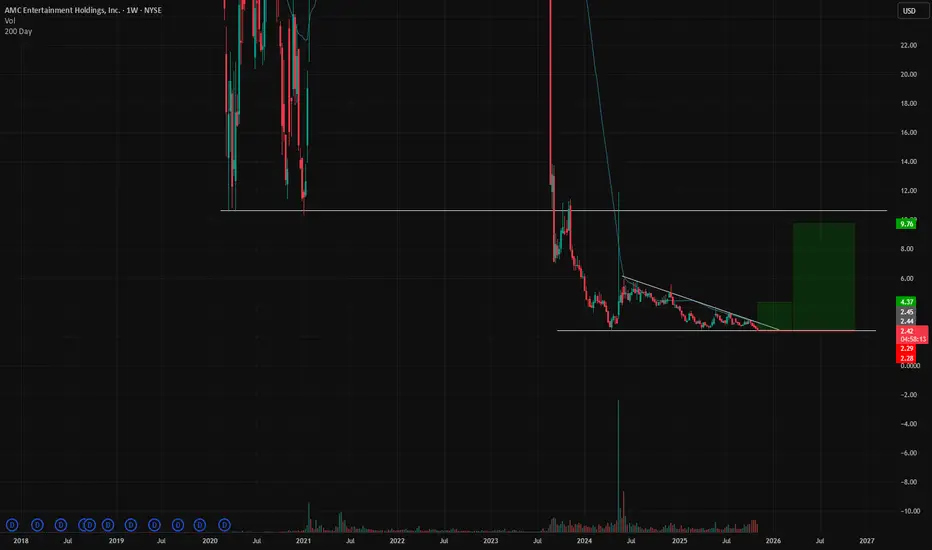
Will they save a dying legacy?Seems hard to believe how far it's fallen. 1600+ days of downtrend. Third touch to the very bottom. Getting ready to enter the void. Possible save coming? Possible entertainment pop from gov't reopening, q4 chase, economic stimulus, etc.? Who knows. Tight stop, so it doesn't matter.
Trade ideas
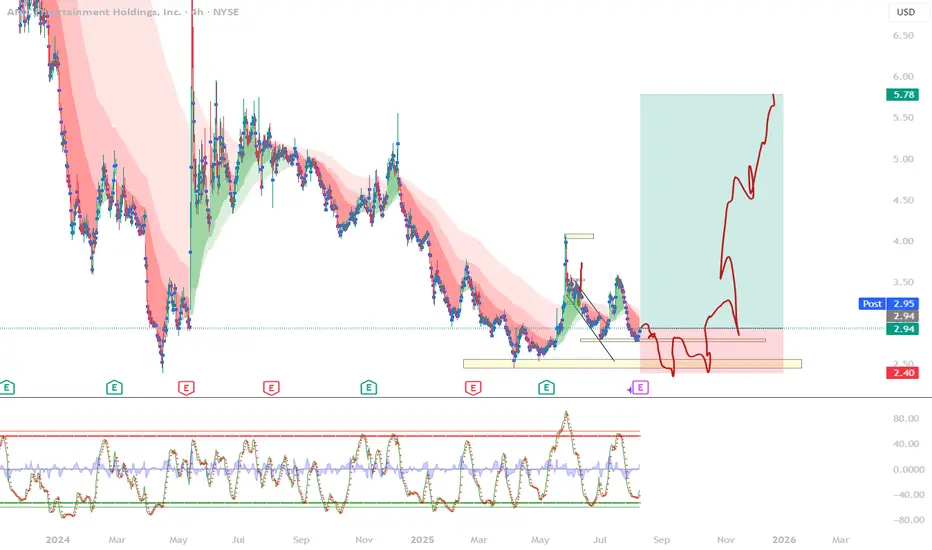
AMC SHORT SETUPThere is a strong support at $2.50—.
Stochastic is deeply oversold so I expect a bounce at the support.
The entry for the short I'm looking at is the box between $2.67 and $2.94, which lines up with the downtrend and the fibonnaci levels.
I like to keep the setups simple and low leverage.
Let me know what you think.

AMC - Buy the BreakoutAMC is threatening to breakout of this long-time triangle on big volume. there is limited downside risk and significant upside. I'll post a few follow-up charts in the notes to show possible targets.
Trendline has been pierced on big volume. It's possible it could pullback inside before breaking out, but not likely on this volume. Either way, it is building a significant base for upside
Fib fan found support at the .618 fan and is not pushing on the 0 fan. Note the upward movement did stop at the 0 fan (gray line). This could indicate a pullback is needed before further upward movement.
RSI has made a very nice double bottom after a three wave down move and has momentum to the upside.

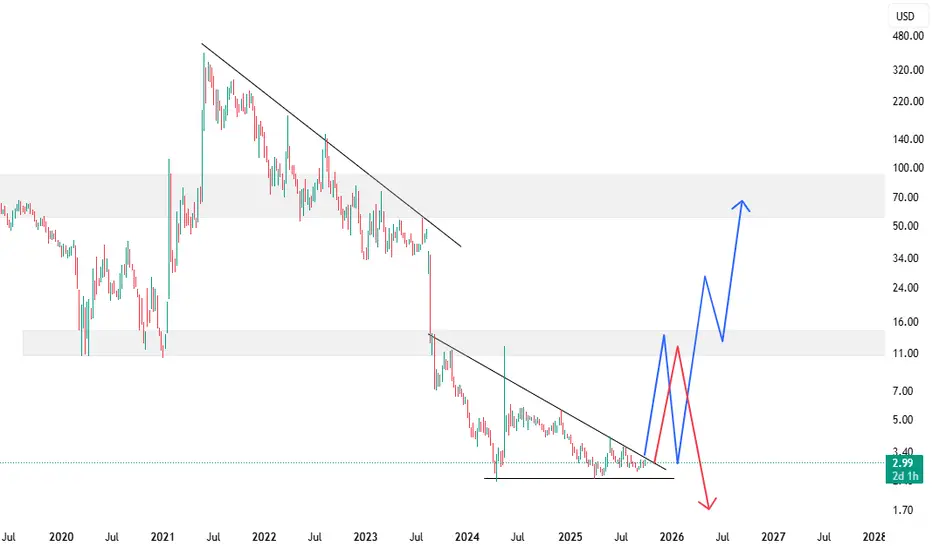
Let's see how does breakout workI am descending Triangle on Weekly chart, I am assuming it will break upside up to $10-12 and then either close some positions and hold half. Thank you
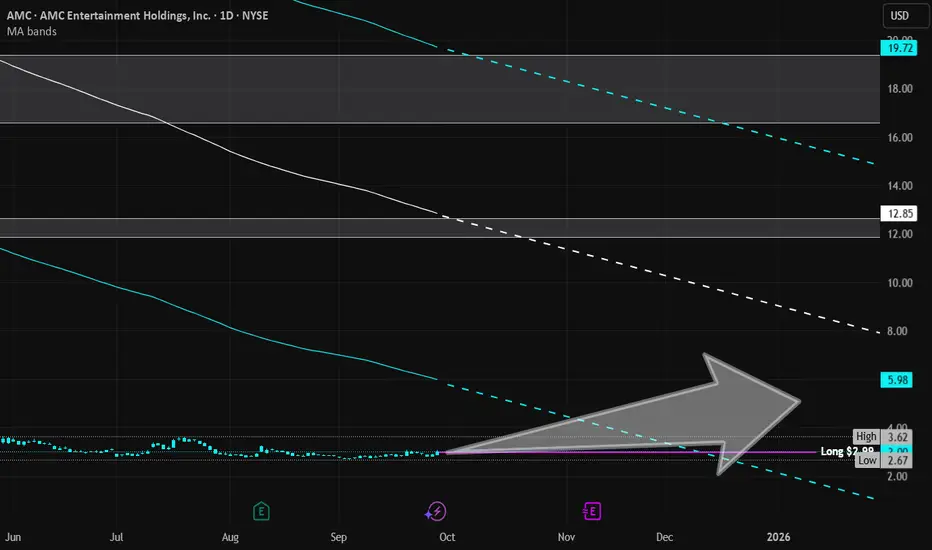
AMC Entertainment Holdings | AMC | Long at $2.99Technical Analysis
The price of NYSE:AMC is nearing a reconnection to my selected historical simple moving average bands (see dotted line extensions). This is likely to happen before January 2026 - or very shortly thereafter. The last time this initial connection occurred was in January 2021 (and we all know what happened after that...). I do not believe history will repeat like in 2021. But... Taylor Swift.
Catalyst
Taylor Swift’s movie, ‘Party of a Showgirl’, is set to be released via AMC Theatres on Friday, October 3rd - the same day as her new album. As a result, AMC will receive a lot of media attention. This may be the quick boost the company needs to get the price moving up again due to "record setting" attendance (or whatever the media says to make it appear successful).
Warning: There is nothing fundamentally good about AMC. High debt, unprofitable, poorly managed, liquidity increases, rug pulls, and social media charlatans telling everyone this is a "worthy" investment. It's worthless. So are my views. Sometimes, though, bad companies soar. Time will tell here.
Thus, at $2.99, NYSE:AMC is in a personal buy zone purely based on technical analysis and the Taylor Swift movie release / AMC media hype.
Targets into 2026
$4.00 (+33.8%)
$5.00 (+67.2%)
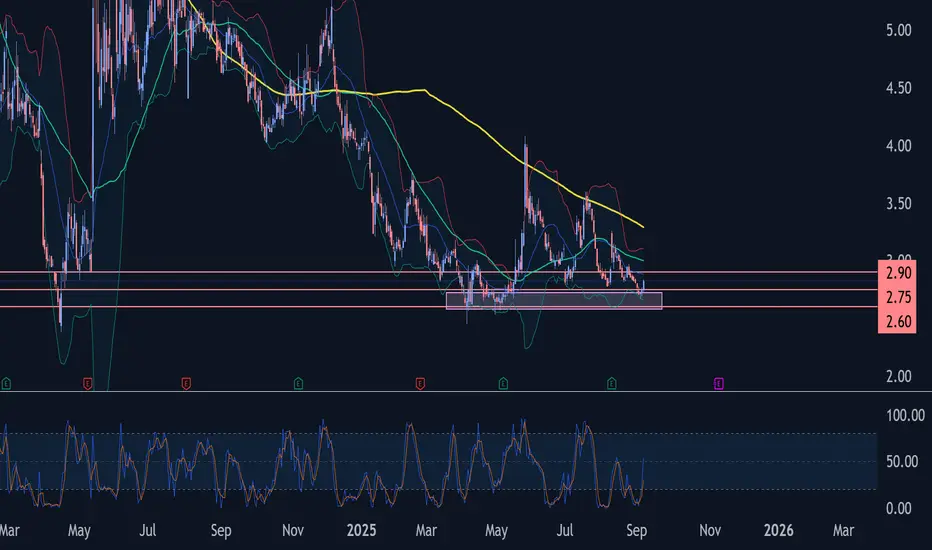
AMC Wave Analysis – 8 September 2025- AMC reversed from support zone
- Likely to rise to resistance level 2.90
AMC recently reversed up from the strong support zone between the support levels 2.75 and 2.60 (which has been reversing the price from the start of April, as can be seen below).
This support zone was further strengthened by the lower daily Bollinger Band.
Given the strength of the aforementioned support zone and the oversold daily Stochastic, AMC can be expected to rise toward the next resistance level 2.90 (high of the previous correction 2).
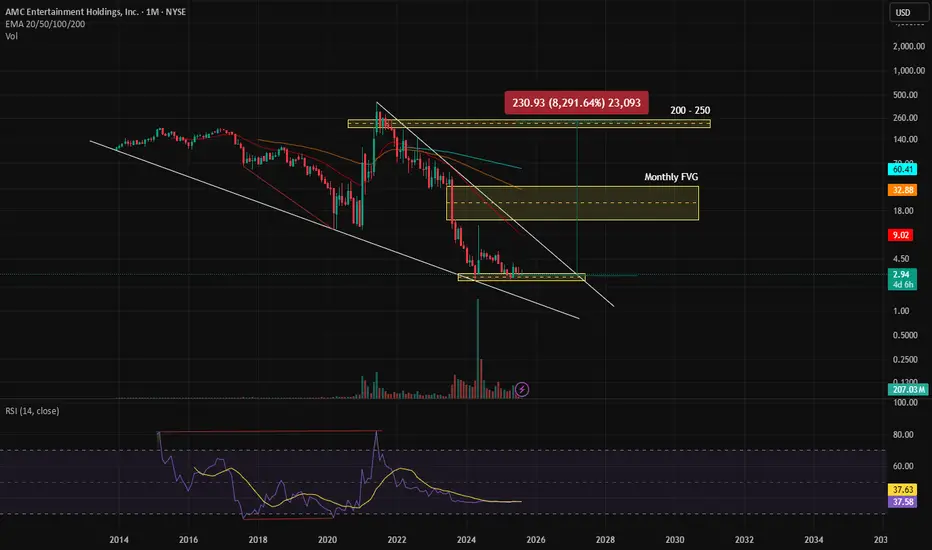
AMC Ready for take off?AMC Seems to have found a bottom.
Earlier we saw a bullish divergence, wich made it grow 4000%.
Now we can see a bottom forming because of the double bottom and the people showing more interest.
We have a monthly FVG wich sits between 14 - 37 zone.
This pattern shows us a possible growth to the price around 200 and 250 ( last high).
Dont expect this to happen in a few weeks, this is more likely to be happening in a few months if not years.
(8200% grow possible)
This is no financial advice and always do your own research. Please let me know your opinion about AMC.
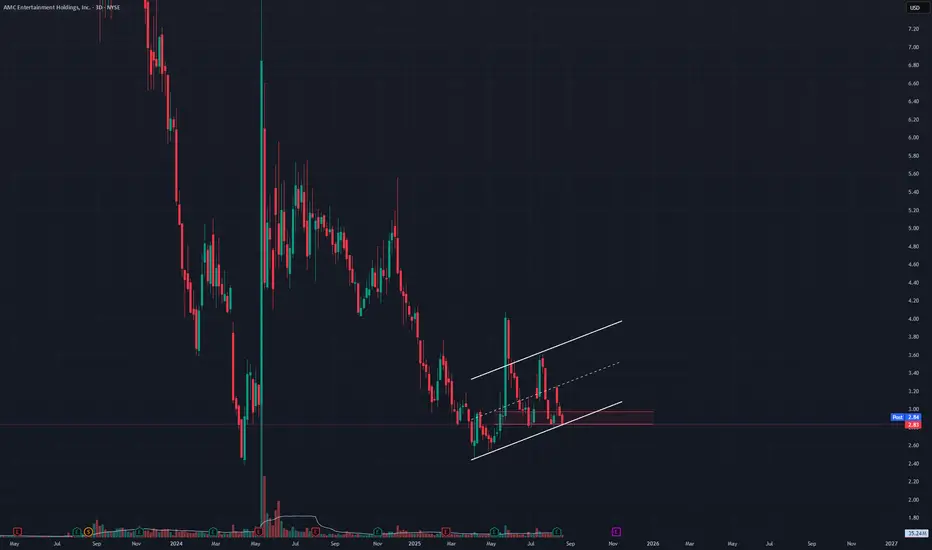
Going to make this real simple for AMCI have been playing this structure on NYSE:AMC for weeks now hoping to catch a moon ticket to the next liquidity zone. The red box is the 236 retracement of the last two high lows. As long as its above this box, I have a bullish outlook. It has to bounce or fall here so I am playing this shit tight. Loading calls and taking profits early to get to runners for the ride. I am out if it loses 2.79
#AMC
#MoonTickets
AMC LONGAlthough it might follow the trend and go down little bit, i have a high hope for this one. might take little bit time but i see its going up in the next few months
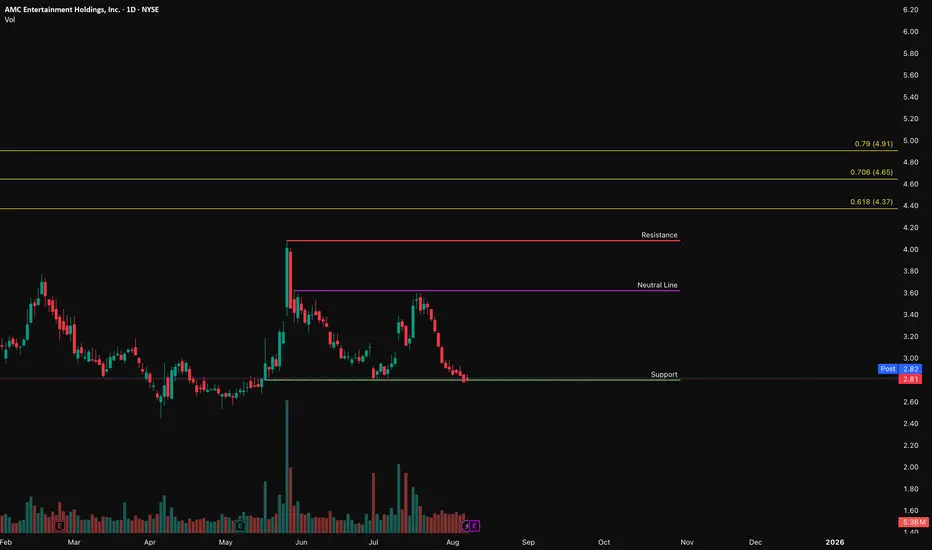
AMC – Watching Support Like a Line in the SandPrice is back at $2.81 — same level it held in early June before that push to $4+.
This time, volume’s fading while price bleeds. That’s not weakness to me, that’s indecision. Sellers are present, but they’re not pressing. It’s more like… everyone’s waiting to see who blinks first.
What I’m Watching:
• Support at $2.81 — If it holds, this could be the base of the next move.
• Volume dropping on the way down = possible seller exhaustion.
• No confirmation yet. No bounce. No strength. Just a setup.
• If this breaks, I’m watching $2.40 next. Not overthinking it.
Potential Setup:
• Entry: If price pushes above $2.85+ with real volume behind it
• Stop: Below $2.70
• Targets:
• Neutral zone around $3.60
• Resistance at $4.20
• Fibs at $4.37, $4.65, $4.91 — only if this gets legs
Not trying to hype anything.
This isn’t a “moon soon” call — this is just a clean chart, clean level, clean logic.
Let it show its hand.
If it breaks down, cool. If it bounces, I’ve got my plan.
That’s it.
double bottom formationPotential upside coming. Quick trade from $2.78 to possible $4 in the next week or two.

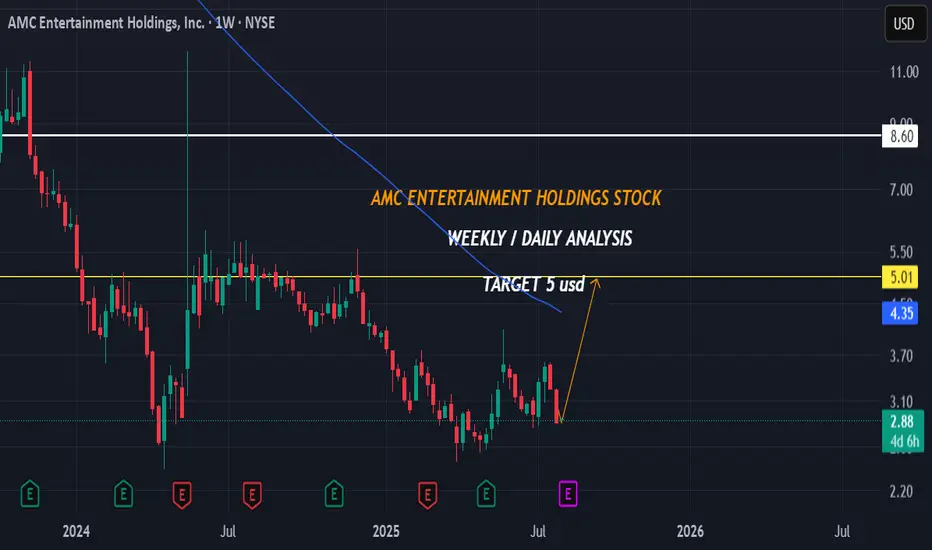
AMC Entertainment Holdings stock.Hello ladies and gentleman.The intrinsic value of one AMC stock under the base case scenario is 9.96 USD. Compared to the current market price of 2.88 USD, AMC Entertainment Holdings Inc is undervalued by 71%.so the is a great probability long to 5 usd.
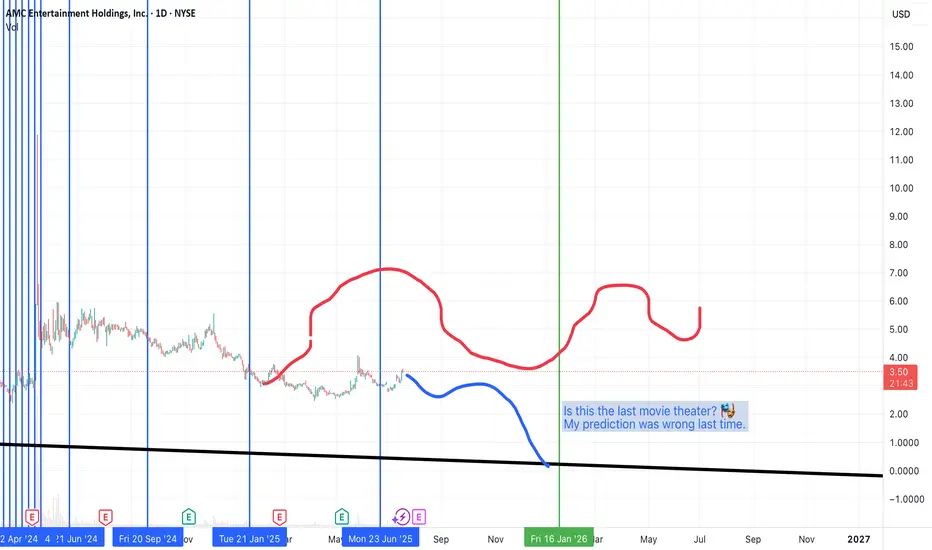
AMCAMC going to $0.00¢ the Last movie theater!!
Looks like theres not going to be any movies played at AMC guys... Better luck next time. >.>
AMC | Long-Term Setup BrewingAMC has been a battlefield stock for retail traders, and while the meme frenzy has calmed, the chart shows signs of a long-term consolidation that may lead to a breakout.
We’re not chasing hype we’re playing levels. The current zone offers asymmetric risk/reward for patient swing or position traders looking for a reversion move back toward key psychological and technical levels.
🔍 Entry Zones:
✅ Market Price: ~$2.99 (initial momentum position)
🧲 Pullback #1: $2.75 (former pivot + fib level)
🧨 Pullback #2: $2.50 (key support floor and high-risk/reward entry)
🎯 Profit Targets (Swing/Position):
🎯 TP1: $3.30 – reclaim of early resistance
🎯 TP2: $4.00 – volume spike zone
🎯 TP3: $5.00+ – potential sentiment surge / short squeeze zone
📢 Disclaimer: This is not financial advice. Always manage your own risk and do your own due diligence.

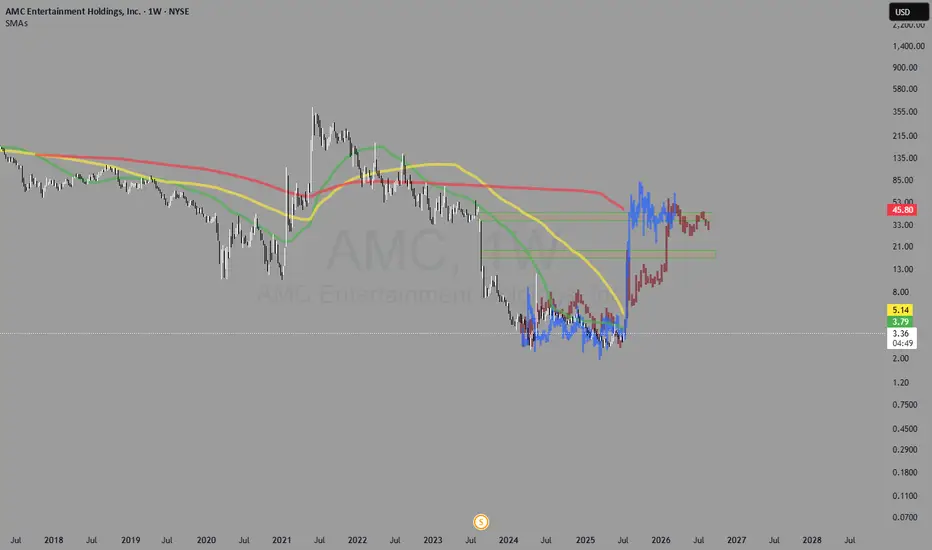
Call your mom. This stock has taught me how to trade. I found it. I bought it for the first time in 2021 and that's how my trading journey began.
Now in July of 2025, I think we might see movement we have been waiting for over the past years.
I remembered a documentary I watched over 15 years ago about a trader making unreal returns (1000s% per year) discussing his strategy. The key points I remember are the deviation from the SMAs. Stocks, that are laggers, kissing/sitting at/over moving averages, especially sitting right above the 100 day moving average for a prolonged period of time (just watch BX:GMES weekly on the 100 SMA;)) and how those stocks see INSANE amount of gains, when they move. I wish I remebered the exact documentary. I see it coming to life in these memes, it seems.
AMC Bullish Cycle Alert – Gann Analysis Signals a 60%+ Move!📊 Key Insight:
According to our proprietary Gann time cycle and technical analysis, AMC is entering a strong bullish window, with a minimum expected upside of 60%.
🟢 Bullish Case Highlights:
✅ W–X–Y–X–Z corrective structure potentially completed.
🔁 Multiple bullish divergence signals across the recent lows.
📅 Time Cycle Tops: 21st July – 2nd September 2025.
🎯 Minimum Price Target: $4.90 – $5.30
💥 Extended Fibonacci Target: $11.88
🔴 Invalidation Level: A weekly close below $2.67 invalidates this setup.
📌 Strategy:
Early accumulation within the $2.80–$3.20 range may provide strong risk-reward setups for swing traders. Watch for volume and momentum confirmation during July.
🔍 Vital Direction View:
This setup combines Elliott Wave structure, Fibonacci symmetry, and Gann time analysis, forming a high-probability inflection zone. If confirmed, this could mark the start of a new bullish cycle for AMC.

AMC Entertainment Holdings | AMC | Long at $3.66First, I'm not an " NYSE:AMC APE" and have zero interest in becoming one. Second, don't trade NYSE:AMC unless you are fully aware the investment could go to zero or the company may devalue your trade via share dilution or other means (i.e., don't simply do as I do or blindly follow anyone else's moves, for the matter).
With that aside, I started a position/gambling play today in NYSE:AMC at $3.66. The reason is 80% technical analysis and 20% fundamentals.
Technical Analysis:
The blue line on the chart represents an average true range (ATR) from a historical simple moving average (SMA) that I use for trading. For simplicity, the historical SMA is not show on the chart - just the ATR. This blue ATR line has historically been a major line of resistance and support. When it breaks through and holds, the stock goes bull - but history may not repeat. The price recently broke the blue ATR line, fell below, and the broke out again today. This may be a sign that the downward trend (overall) is changing - perhaps furthering the accumulation phase in the $3s or a gradual rise from here. And with today's breakout, I grabbed shares at $3.66.
Fundamentals
Since 2020, NYSE:AMC has shown major gains in revenue and net income (loss reduction, that is). Revenu: $1.24 billion (2020); $2.53 billion (2021); $3.91 billion (2022); 4.81 billion (2023); $4.4 billion (2024, Q1-3 only). Net Income: -$4.5 billion (2020); -$1.27 billion (2021); -$973 million (2022); -$396 million (2023); -$399 million (2024, Q1-3 only). The company is not expected to become profitable until Q4 of 2026 , but the improvements are what one would like to see.
Counter-arguments and statements the stock is junk are totally valid. But the chart is quite interesting as the company moves toward profitability (maybe...).
Targets:
$4.30
$6.00
Squeeze/mass hysteria: $18.00, $40.00, and ridiculousness: $85.00

AMC ENTERTAINMENT HOLDINGS STOCK.WEEKLY / DAILY ANALYSIS.Hello ladies and gentleman.The intrinsic value of one AMC stock under the base case scenario is 10.4 USD. Compared to the current market price of 3.35 USD, AMC Entertainment Holdings Inc is undervalued by 68%.so the is a great probability long to 5 usd.

AMC to squeeze 3-4x soon?Chart looks great, MFI seems to be trending up...lots of smart money has been getting in at the bottom.

Enjoy the Movie $AMCThis is a large broadening wedge (megaphone) pattern with Elliot W. ABCDE waves. impulsive waves are mapped within. See the red circle for a repeat of 2021 to happen in 2025. The start of very similar bottoming patterns designated by green arrows. $35-$53 range. Correction and the 1.618 target is $609 for $AMC.
July 2026 seems to be the appropriate timeline.

Squeeze Me: AMCI do not have a crystal ball
But what I do have is enough
Trade What You See..Not What You Hope For

Short term buyAMC bouncing off a strong support level. I loaded up on calls. $3.50 exp Dec 19. I believe AMC will come back up to $4. I am no expert just my thoughts on AMC

Can $AMC come back to life again? NYSE:AMC is showing some good TA on the weekly and daily chart. We are visiting lows from the past, which reminds me of when I played NYSE:AMC and it visited the COVID lows.
On both the Weekly and Daily we have the MACD in GREEN, RSI crossing MA which the weekly is showing downtrend being broke.
Daily chart Is almost or is right on the 8 day crossing the 21 day EMA. Daily is also breaking the downtrend of ~$4.40 along with breaking the 100 day SMA. Holding VWAP form the low of $2.45 on 4/4/2025.
NYSE:AMC Price as of 5/15/2025: $2.81
Need to see continuation out of the downtrend with volume
Break the resistance level of $2.81 - $2.85, which has the 100 Day SMA around the $2.83 that needs to be cleared.
Then $2.90 - $3.00 and we'll follow the Fib Levels and mark support/resistance levels as we go.
This could get spicy so buckle up knuckleheads!
NYSE:AMC Daily
NYSE:AMC Weekly
