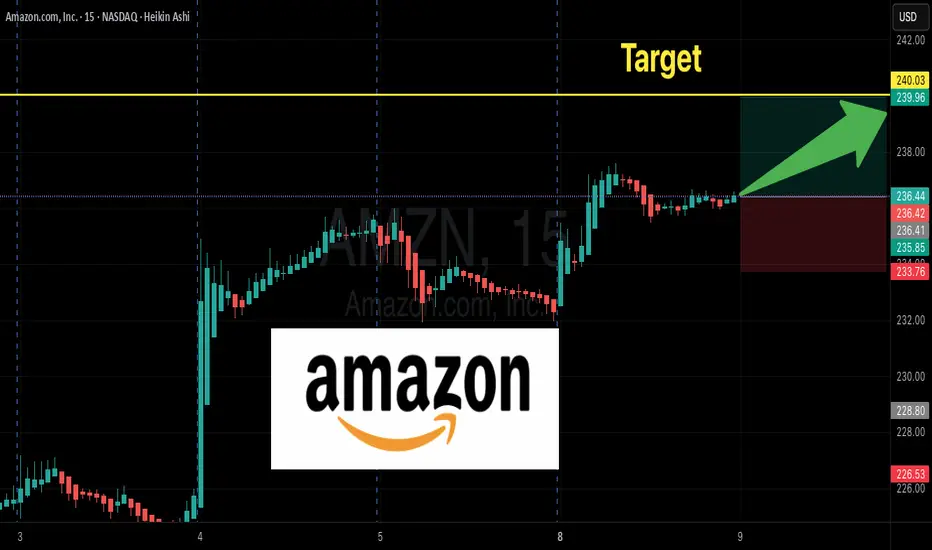
AMZN $240 Weekly Call — Tactical Play for Quick Gains
🚀 **AMZN Weekly Options Alert — \$240 Call Could Double in 4 Days!**
**Directional View:** **Strong-to-Moderate Bullish** 💹
**Confidence:** 75%
**Trade Setup:**
* **Instrument:** AMZN
* **Strategy:** BUY CALL (single-leg)
* **Strike:** \$240
* **Expiry:** 2025-09-12 (4 DTE)
* **Entry Price:** \
Key facts today
Next report date
—
Report period
—
EPS estimate
—
Revenue estimate
—
5.65 EUR
57.23 B EUR
616.25 B EUR
9.66 B
About Amazon.com, Inc.
Sector
Industry
CEO
Andrew R. Jassy
Website
Headquarters
Seattle
Founded
1994
ISIN
US0231351067
FIGI
BBG00GQ6RYZ0
Amazon.com, Inc. engages in the provision of online retail shopping services. It operates through the following business segments: North America, International, and Amazon Web Services (AWS). The North America segment includes retail sales of consumer products and subscriptions through North America-focused websites such as amazon.com and amazon.ca. The International segment offers retail sales of consumer products and subscriptions through internationally-focused websites. The Amazon Web Services segment involves in the global sales of compute, storage, database, and AWS service offerings for start-ups, enterprises, government agencies, and academic institutions. The company was founded by Jeffrey P. Bezos in July 1994 and is headquartered in Seattle, WA.
Related stocks
Amazon (AMZN) Shares Jump Over 4%Amazon (AMZN) Shares Jump Over 4%
Amazon (AMZN) shares were among the top gainers in the equity markets yesterday, rising more than 4% and closing above $235 for the first time since February 2025.
The rally was fuelled by reports that Kuiper – Amazon’s project aimed at providing internet access

How to recognize the Fundamentals Support in a stock chart.Candlesticks are more than just a buy entry signal or a sell short entry signal. Candlesticks offer far more information such as where are the fundamentals of a company in relation to its stock price? The chart of AMZN shows the current level of fundamentals at this time which is within the outlined

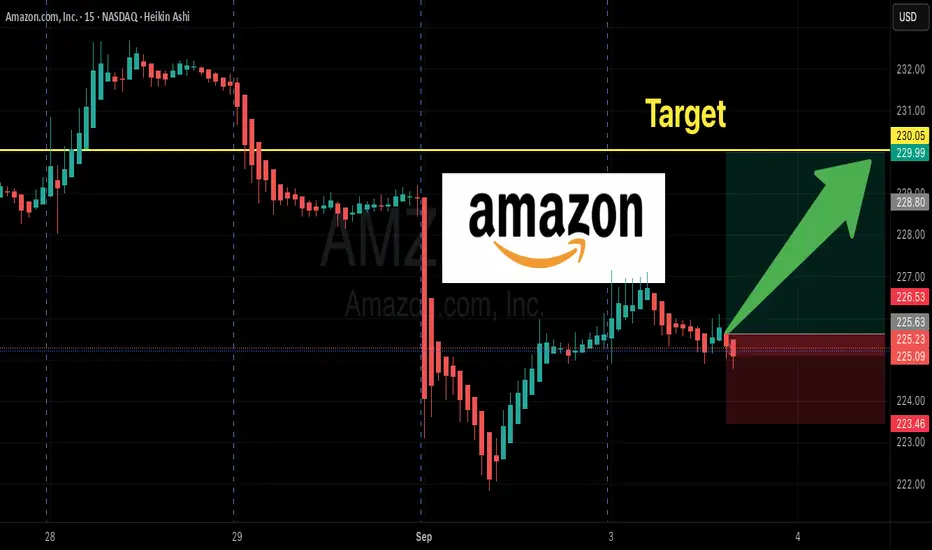
AMZN Options Flow Explodes! $230 Call Trade Idea”
# 🚀 AMZN Weekly Options Trade Idea (2025-09-03)
### 📊 Market Recap
* **Daily RSI**: 47.9 ⬇️ (bearish tilt)
* **Weekly RSI**: 57.1 ⬇️ (losing momentum)
* **Volume**: 0.9x 📉 (weak vs prior week)
* **Options Flow**: 💎 Strongly bullish (C/P = 3.30)
* **VIX**: ✅ Favorable (16–17)
👉 **Models Split:**
AMZN Shorts are Losing GripHello I am the Cafe Trader.
Today we’re looking at Amazon
If you have followed my last couple Idea's on AMZN, we have really pegged down where these players are in the market.
This month I wanted to highlight the bullish sentiment with AMZN.
This chart shows us something important — shorts a

AMAZON PULLBACK AHEAD|SHORT|
✅AMAZON has retested a key
Resistance level of 236.60$
And as the pair is already
Making a bearish pullback
A move down to retest the
Demand level below at 230.00$
Is likely on Monday
SHORT🔥
✅Like and subscribe to never miss a new idea!✅

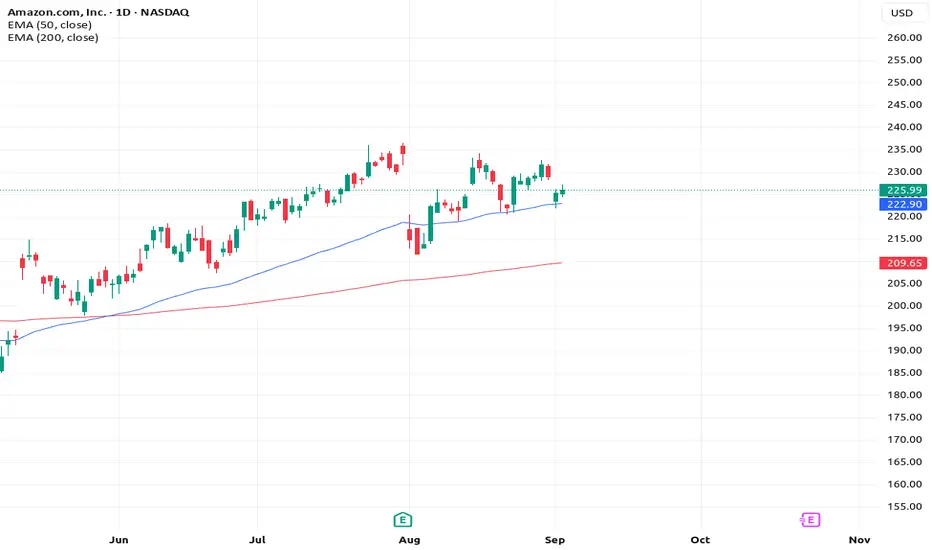
Rocket Booster Strategy – 3 Steps + Amazon (AMZN) 🚀 Amazon (AMZN) – Multi-Timeframe Technical Setup
Daily Chart:
On the daily chart, the technical summary shows a neutral rating. Both the oscillators and moving averages are neutral. Digging deeper, the MACD is signaling a sell, hinting at short-term hesitation.
Weekly Chart:
Shifting to th
Amazon.com, Inc. (AMZN) Gains on AWS Cloud ExpansionAmazon.com, Inc. (AMZN) is a global leader in e-commerce and cloud computing, best known for its massive online marketplace and its AWS cloud platform. The company also operates in digital streaming, logistics, and AI-powered technology solutions. Amazon’s growth is fueled by the continued shift to
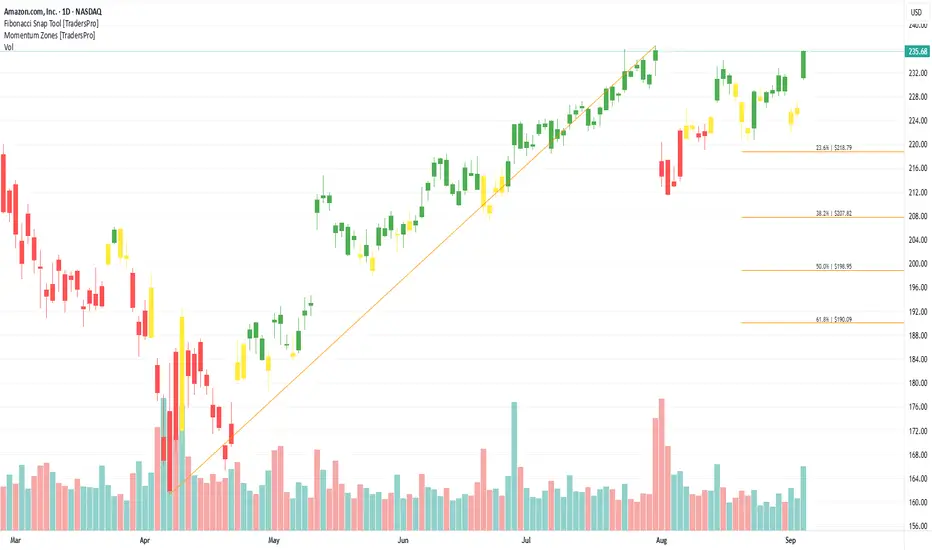
$AMZN Going for ATH BreakNASDAQ:AMZN going for ATH break, daily bands are finally starting to expand. Also bullish flow came in yesterday. 10/17/25 240C @ 5.90 $2.1M

Trade Idea – Amazon (AMZN)AMZN just broke above recent highs and closed the gap from the earnings drop.
Price has now bounced off the 50-day MA for the 4th time, signaling a strong dynamic support.
Yesterday's move came on a vector candle with 150% of the 20-day avg. volume → strong confirmation.

See all ideas
Summarizing what the indicators are suggesting.
Neutral
SellBuy
Strong sellStrong buy
Strong sellSellNeutralBuyStrong buy
Neutral
SellBuy
Strong sellStrong buy
Strong sellSellNeutralBuyStrong buy
Neutral
SellBuy
Strong sellStrong buy
Strong sellSellNeutralBuyStrong buy
An aggregate view of professional's ratings.
Neutral
SellBuy
Strong sellStrong buy
Strong sellSellNeutralBuyStrong buy
Neutral
SellBuy
Strong sellStrong buy
Strong sellSellNeutralBuyStrong buy
Neutral
SellBuy
Strong sellStrong buy
Strong sellSellNeutralBuyStrong buy
Displays a symbol's price movements over previous years to identify recurring trends.
AMZN4996699
Amazon.com, Inc. 1.5% 03-JUN-2030Yield to maturity
—
Maturity date
Jun 3, 2030
AMZN5508429
Amazon.com, Inc. 4.65% 01-DEC-2029Yield to maturity
—
Maturity date
Dec 1, 2029
AMZN5508427
Amazon.com, Inc. 4.6% 01-DEC-2025Yield to maturity
—
Maturity date
Dec 1, 2025
AMZN5508430
Amazon.com, Inc. 4.7% 01-DEC-2032Yield to maturity
—
Maturity date
Dec 1, 2032
AMZN4531864
Amazon.com, Inc. 3.875% 22-AUG-2037Yield to maturity
—
Maturity date
Aug 22, 2037
AMZN5182959
Amazon.com, Inc. 3.1% 12-MAY-2051Yield to maturity
—
Maturity date
May 12, 2051
AMZN4531862
Amazon.com, Inc. 3.15% 22-AUG-2027Yield to maturity
—
Maturity date
Aug 22, 2027
AMZN4531868
Amazon.com, Inc. 4.25% 22-AUG-2057Yield to maturity
—
Maturity date
Aug 22, 2057
AMZN4531866
Amazon.com, Inc. 4.05% 22-AUG-2047Yield to maturity
—
Maturity date
Aug 22, 2047
AMZN5508428
Amazon.com, Inc. 4.55% 01-DEC-2027Yield to maturity
—
Maturity date
Dec 1, 2027
AMZN4996701
Amazon.com, Inc. 2.7% 03-JUN-2060Yield to maturity
—
Maturity date
Jun 3, 2060
See all AMZN bonds
Curated watchlists where AMZN is featured.


Frequently Asked Questions
The current price of AMZN is 197.95 EUR — it has decreased by −1.71% in the past 24 hours. Watch Amazon.com, Inc. stock price performance more closely on the chart.
Depending on the exchange, the stock ticker may vary. For instance, on VIE exchange Amazon.com, Inc. stocks are traded under the ticker AMZN.
AMZN stock has risen by 2.46% compared to the previous week, the month change is a 3.41% rise, over the last year Amazon.com, Inc. has showed a 24.69% increase.
We've gathered analysts' opinions on Amazon.com, Inc. future price: according to them, AMZN price has a max estimate of 261.33 EUR and a min estimate of 196.43 EUR. Watch AMZN chart and read a more detailed Amazon.com, Inc. stock forecast: see what analysts think of Amazon.com, Inc. and suggest that you do with its stocks.
AMZN reached its all-time high on Feb 4, 2025 with the price of 233.70 EUR, and its all-time low was 39.55 EUR and was reached on Aug 29, 2017. View more price dynamics on AMZN chart.
See other stocks reaching their highest and lowest prices.
See other stocks reaching their highest and lowest prices.
AMZN stock is 3.06% volatile and has beta coefficient of 1.37. Track Amazon.com, Inc. stock price on the chart and check out the list of the most volatile stocks — is Amazon.com, Inc. there?
Today Amazon.com, Inc. has the market capitalization of 2.17 T, it has decreased by −0.08% over the last week.
Yes, you can track Amazon.com, Inc. financials in yearly and quarterly reports right on TradingView.
Amazon.com, Inc. is going to release the next earnings report on Oct 23, 2025. Keep track of upcoming events with our Earnings Calendar.
AMZN earnings for the last quarter are 1.43 EUR per share, whereas the estimation was 1.13 EUR resulting in a 26.44% surprise. The estimated earnings for the next quarter are 1.33 EUR per share. See more details about Amazon.com, Inc. earnings.
Amazon.com, Inc. revenue for the last quarter amounts to 142.36 B EUR, despite the estimated figure of 137.88 B EUR. In the next quarter, revenue is expected to reach 151.70 B EUR.
AMZN net income for the last quarter is 15.42 B EUR, while the quarter before that showed 15.83 B EUR of net income which accounts for −2.60% change. Track more Amazon.com, Inc. financial stats to get the full picture.
No, AMZN doesn't pay any dividends to its shareholders. But don't worry, we've prepared a list of high-dividend stocks for you.
As of Sep 11, 2025, the company has 1.56 M employees. See our rating of the largest employees — is Amazon.com, Inc. on this list?
EBITDA measures a company's operating performance, its growth signifies an improvement in the efficiency of a company. Amazon.com, Inc. EBITDA is 115.19 B EUR, and current EBITDA margin is 19.15%. See more stats in Amazon.com, Inc. financial statements.
Like other stocks, AMZN shares are traded on stock exchanges, e.g. Nasdaq, Nyse, Euronext, and the easiest way to buy them is through an online stock broker. To do this, you need to open an account and follow a broker's procedures, then start trading. You can trade Amazon.com, Inc. stock right from TradingView charts — choose your broker and connect to your account.
Investing in stocks requires a comprehensive research: you should carefully study all the available data, e.g. company's financials, related news, and its technical analysis. So Amazon.com, Inc. technincal analysis shows the buy rating today, and its 1 week rating is buy. Since market conditions are prone to changes, it's worth looking a bit further into the future — according to the 1 month rating Amazon.com, Inc. stock shows the buy signal. See more of Amazon.com, Inc. technicals for a more comprehensive analysis.
If you're still not sure, try looking for inspiration in our curated watchlists.
If you're still not sure, try looking for inspiration in our curated watchlists.