Enphase Attempts a BreakoutEnphase Energy has quietly emerged as a market leader in 2022. Is it now ready for a final run into yearend?
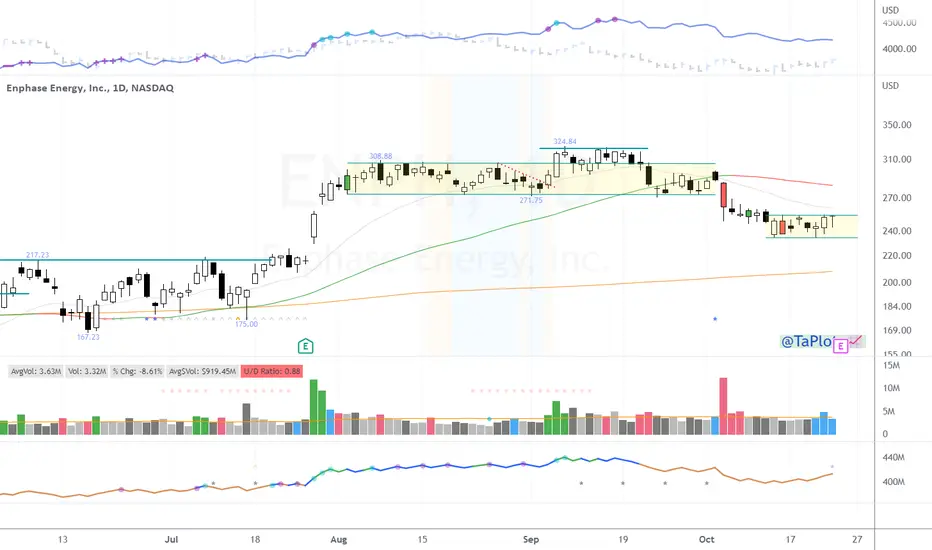
Notice how the solar-energy stock made a series of higher lows since mid-October. Prices remained below roughly $320, a previous closing high from September. The result was an ascending triangle, which ENPH escaped on Friday. That could signal a continuation of its bullish trend.
Second, MACD has remained positive for over a month.
Third, ENPH briefly dropped below its 50-day simple moving average SMA in early November but quickly recovered. The retest may confirm buyers are willing to defend its uptrend.
Finally, TradeStation data shows ENPH is the fourth-best performing member of the S&P 500 this year. (It trails only fossil-fuel rivals Occidental Petroleum , Hess and Marathon Petroleum .) That could make some momentum traders look for window dressing.
TradeStation has, for decades, advanced the trading industry, providing access to stocks, options, futures and cryptocurrencies. See our Overview for more.
Important Information
TradeStation Securities, Inc., TradeStation Crypto, Inc., and TradeStation Technologies, Inc. are each wholly owned subsidiaries of TradeStation Group, Inc., all operating, and providing products and services, under the TradeStation brand and trademark. You Can Trade, Inc. is also a wholly owned subsidiary of TradeStation Group, Inc., operating under its own brand and trademarks. TradeStation Crypto, Inc. offers to self-directed investors and traders cryptocurrency brokerage services. It is neither licensed with the SEC or the CFTC nor is it a Member of NFA. When applying for, or purchasing, accounts, subscriptions, products, and services, it is important that you know which company you will be dealing with. Please click here for further important information explaining what this means.
This content is for informational and educational purposes only. This is not a recommendation regarding any investment or investment strategy. Any opinions expressed herein are those of the author and do not represent the views or opinions of TradeStation or any of its affiliates.
Investing involves risks. Past performance, whether actual or indicated by historical tests of strategies, is no guarantee of future performance or success. There is a possibility that you may sustain a loss equal to or greater than your entire investment regardless of which asset class you trade (equities, options, futures, or digital assets); therefore, you should not invest or risk money that you cannot afford to lose. Before trading any asset class, first read the relevant risk disclosure statements on the Important Documents page, found here: www.tradestation.com .
ENPH trade ideas

ENPH Long (VCP)Brilliant volume contraction pattern.
Big volume spikes as accumulation.
7% up this sessión, breaking resistance.
Leading sector and 99 Relative strenght index.


Long on ENPH.?I think ENPH interesting for a swing trader’s
I looking for strong trends line, and supports ✔️
good Cci ✔️
good Rsi ✔️
Sma 150 ✔️

$ENPH Classic VCP setup $ENPH showing VCP characteristics on the daily chart within a stage 2 base, with each contraction smaller than the next. Took initial position on the day it reversed with high volume, but holding the position, noting the subsequent dry up in volume, now with a final contraction <5%.

ENPH LongI am bullish on ENPH. Despite there is multiple top pattern, there is a nice uptrend on MA's. I assume ENPH if break recent highs it could make new highs soon.

PatternsPatterns looking bullish long term bearish short term into close up earnings then upwards after reporting earnings to complete the same W patterns on the daily within the huge trend lines that have stayed up opposed to crashing down, strong momentum likely to continue if all goes well with the company, and the company does very well. To sum it up I'd hold or a weekly short until earnings and wait to buy or go long just before earnings at a lower price than today to catch the rally up after reporting... : )

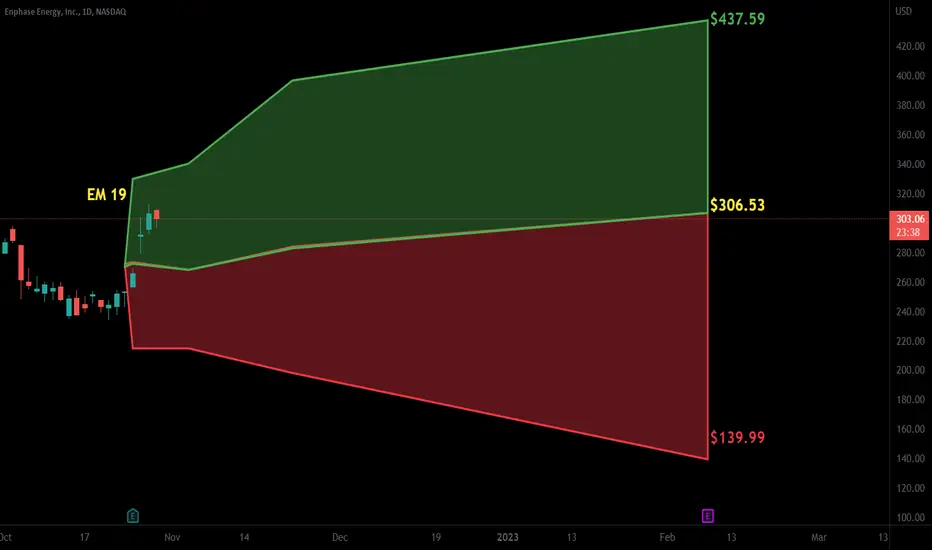
#ENPH to 390$?Hello dear Traders,
Here is my idea for #ENPH
Price closed above yellow line (previous month high)
Price closed (15min Chart) above purple trigger line to enter trade.
Targets marked in the chart (black lines)
Invalidation level marked with red line
Good luck!
❤️Please feel free to ask any question in comments. I will try to answer all! Thank you.
Please, support my work with like, thank you!❤️

ENPH potential breakout soon ENPH potential breakout once this demand fair value gap below is retested
look for a recovery of the high volume node above to act as a shelf to push price upward upon a confirmed hold

ENPH inverted head and shoulders.Looks like a longer term inverted head and shoulders combined with a shorter term inverted head and shoulders. Showing good relative strength. Will be watching closely to see if it can hold above resistance this week for a long position.

🟩 $ENPH - added last week$ENPH has been showing the characteristics of a Market Leader - I bought last week. Here is why:
1. Confirmed Stage 2 uptrend
2. 11 week constructive base (Cup and Handle pattern)
3. Strong RS rating
4. Breakout Year on EPS
5. 2 Quarter EPS acceleration

Enphase Energy Analysis 18.11.2022Welcome to the BasicTrading channel.
My name is Philip and in todays analysis I quickly go over the situation which we currently have on Nas100 .
I will analyse the asset both from a weekly and daily timeframe to show you the best possible trading opportunities.
If you enjoyed this analysis, let me know in the comment section which asset I should analyse tomorrow.
I will personally reply to every single comment.
Dont forget to smash that rocket and I will see you tomorrow with a new analysis.

ENPH - Big play potential here! Massive Double TopEnphase Energy, leader in Solar & Green Energy Sector.
Enphase has recently seen parabolic performance skyrocketing the stock to All Time Highs.
While the stock is testing all time highs, it is still very overvalued with a P/e of 150.
The bear market has not taken its toll on Enphase yet, while it has been rising in this clear rising wedge.
What I see:
- A clear Double Top being Printed in Large Supply Zone
- Rising Wedge
- Overvalued
- Hasn’t got Bear market hit yet
Risks :
Earnings Growth
Market Meltup rally
Break above zone from possible cup & handle formation.

$ENPH Setting up Cup with Handle$ENPH probably pissed off few traders with early strength Friday and reversal.
This potentially improves the setups with it putting 3rd and final contraction before breaking out.
Orange bars is what I would like to see to get me interested.

trend resistance zone is extreme! longs should be careful here🔴pointed this trend resistance zone out on august 22nd, since then we have seen 2 perfect rejections..
I am expecting a dip to 222-270 before next leg up here on ENPH, bearish short term bullish long term 🚀

$ENPH with a Bullish outlook following its earnings #Stocks The PEAD projected a Bullish outlook for $ENPH after a Positive over reaction following its earnings release placing the stock in drift B with an expected accuracy of 80%.
ENPH - Continued DowntrendLooking to meet the .5 retracement going into earnings. Unless they have some outstanding news I don't see this momentum dying in the current conditions after the rally solar has had. Watching this into next week to enter on any pops. RSI looks to be oversold but has room for continuation down to around 14ish (D, 14) while the trailing 24 MA on RSI continues to trend down. MACD also showing continued strength down.

ENPH10. 27. 22 ENPH This is a very bullish market which correct about 100 points lower to a 382....And looks like it's going to make new highs.

Short idea #5Hey, I think ENPH drops, and significantly so. I'm not shorting yet, but I'm posting my idea ahead of time. I WILL short this when SPY hits $390


$ENPH in a Position to Move Ahead of Earnings $ENPH reporting after the close tomorrow according to TOS.
Sitting at a spot to make a move.
I wont be taking a position ahead of that number.
ES1!10. 24. 22 There is a big distinction between the US dollar going higher and the es going higher. This difference change is my strategy, and it would change my strategy if I were trading in the equities market.

