<TradeVSA> MACY Breakout from VCP. Pullback Coming ?Sign of Strength in the chart:
1. Weekly Chart
- Green Pentagon from Re-accumulation
2. Daily Chart
- Breakout from VCP + Reaccumulation
- Turning to Red Pentagon with Potential 1st pullback
Disclaimer
This information only serves as reference information and does not constitute a buy or sell call. Conduct your own research and assessment before deciding to buy or sell any stock
MACY trade ideas

MacysCheck out this monthly chart on Macys. Given their nostalgic name, their ability to survive and even post profit through the ongoing pandemic, and the load of shorts still left in the stock I think it can eventually rip to all time highs. The 50 SMA is curving up towards the flatter 200 SMA and the PPS is slowly rising above the 50. If we can make it to $40 without shorts and they step in and cover there it could be explosive. Its been very under the radar too for the most part. Great opportunity here still as the PPS has exceeded both the 50 and 200 SMAs on the weekly chart.

$M Breakout from long consolidation flat base$M Breakout from long consolidation flat base.
Retail Department Stores TOP 1 (out of 197) from MarketSmith
Very impressive last quarter figures after re-opening (EPS +259% / Sales +59%)
The group should remain strong, let's see if $M can push higher from this base.

retail trading like a biotechfutes are down tonight, looking for some give back in this name. Overbought is an understatement. PUTS

$M 1hr with support and resistance$M 1hr with support and resistance
RSI needs a breather
Will look to scalp puts, possibly even swing overnight.
No position as of now

Macy's--Up 20% in 1 day with COVID lurking againSuddenly Macy's is cool again. I'm not buying it. In fact, I'm shorting it!
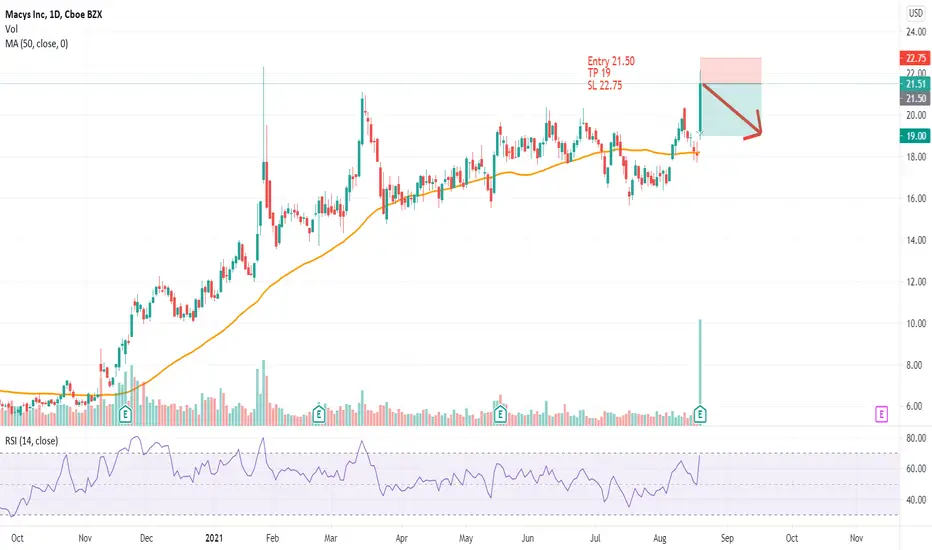
Upside side after good earnings
Bias on Upside after good earnings.
Weekly chart above 23.8% Fibo
Copy the moment since GFC 2008

Short M I have no reason to short this stock really.
The volume is still strong and above average, I am shorting only because it is a retail stock and competition are very strong in this sector of the market and it is already up 95% for 2021.

Pump & Dump of the DayBought a few different puts exp going out 2-4 weeks. Dying business. Overbought. Retail will have a hard time going into the holidays. PT cuts on the way..


M Potential Upwards Breakout From WedgeBeen on a clear upwards trend over the past 8-10 months. Posted big gains on Friday, looking for a breakout from the wedge on Monday. This stock frequently repeats big single day gains. Potential to break out into the $24 range next week.
Curious on other peoples thoughts.

Macys on the MoveA very bullish cup and handle.
Formation
I'm just saying.
Look at it this way
YOU CAN NOT HAVE THE MACYS THANKSGIVING PARIDE WITH OUT MACYS!!!(NYC)
Soo for a long paly a super cheap price I think this is a win win.


Macy's? I'm Long LmaoKinda doing this one for fun, it's cheap with low risk. (Tight stop). Macy's is at a pivotal point, and is trying to reverse the bear trend, which is still apparent on the weekly chart. Fundamentally, it's a dead business, with -$259M in revenue and with insiders owning only 0.12% of shares. Long term is still bearish but I think price action is just doing it's thing on the daily. Also was this stock targeted by the short squeeze crowd before? Regardless I just think the chart looks kinda neat on the daily lol.


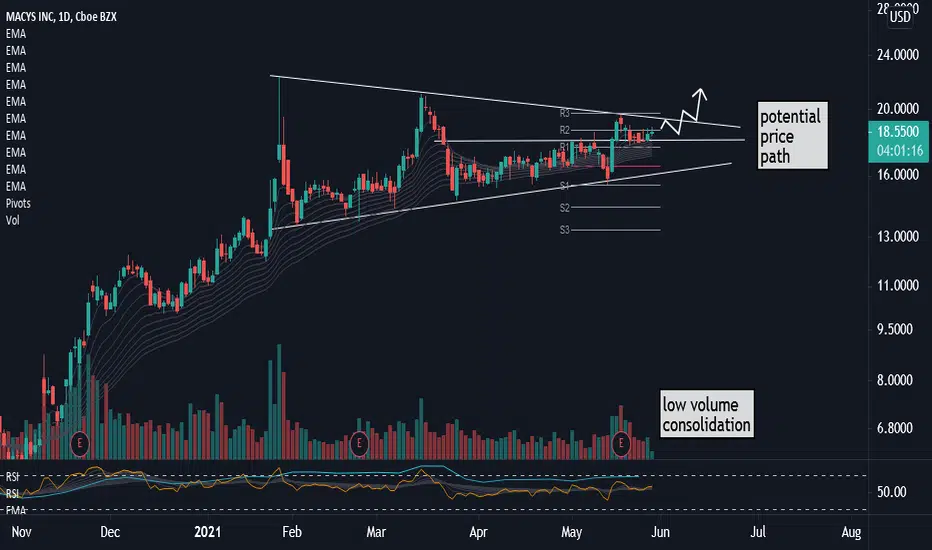
Offshore: Monitoring Macy's (M)The share has been consolidation in a sideways range since late February, with a series of high lows and lower highs resulting in a medium term pennant formation. Recently, we saw the share run into earnings after which it has been in a short term low volume consolidation .
For the buy/long to have conviction we will have to see candles with wider ranges pushing into the overhead resistance. This will also signal expansion away from the moving averages, which is a typical feature of a break-away move. (A great example of this locally was Absa Group JSE:ABG over the last week or so.
Provisional Trade Levels:
Current: $18.40
Initial Accumulation (Moderate Size): $18.40-$18.80 then add on a break above $19.30 .
Stop-loss: $17.30
Target Range: $21.30-$22.40


Macys weekly daily charts. breaking out on higher volume? Macys weekly daily charts. breaking out on higher volume?


Not too confident with M this morningSeems to be at the resistance point in my channel and overbought. It looks like it's going to be a possible 2 point short. Being that the channel had so many pushes in both directions i don't think it's stable enough anymore a new trend might follow. My entry will be $17.70 depending how the bars look and my stop loss would be $18. will update if I take the trade.

<TradeVSA> Macy Building Strong Support with NS SignalSign of Strength in the chart:
1. Re-accumulation
2. Effort bars with NS signal
3, Price holding well at 20/40ma
Disclaimer
This information only serves as reference information and does not constitute a buy or sell call. Conduct your own research and assessment before deciding to buy or sell any stock
