Novo Nordisk (NVO): A Rare Value Opportunity in a DuopolyBias: Long (Bullish) Time Horizon: Long-term (2+ Years)
The "Big Picture" Novo Nordisk, the pioneer of the modern weight-loss market, has seen its stock price fall to roughly $52, a level not seen since mid-2021. The market has panicked due to competition from Eli Lilly and some temporary setbacks, effectively pricing Novo as if it has stopped growing. We believe this is a classic overreaction: Novo is still growing revenue at 15% (currency-neutral) and remains a dominant player in a global market large enough for two winners.
The Analysis:
The Trend: The stock experienced a "free fall" in late 2025, driven by a series of negative updates rather than a single catastrophic event. Sentiment shifted from "perfection" to extreme pessimism after the company lowered guidance and missed targets on an Alzheimer's trial. However, the business fundamentals remain strong, with the company generating over $33 billion USD in revenue in the first nine months of 2025.
The Valuation Gap: This is the core of the thesis. Novo Nordisk is currently trading at a Price-to-Earnings (P/E) ratio of roughly 14.2x. For context, its primary competitor, Eli Lilly, trades at over 50x earnings. This 73% discount suggests the market expects Novo to lose almost all relevance, which we view as analytically flawed given their pipeline and cash generation.
The Catalyst: Three main drivers will likely push the price back up:
1. Pipeline Success: The expected launch of "CagriSema" in late 2026, a next-gen drug with projected weight loss of 25%, which effectively neutralizes Eli Lilly's efficacy advantage.
2. Supply Chain Moat: Massive investments in manufacturing (CapEx) will allow Novo to meet demand that competitors simply cannot supply.
3. Leaner Operations: Following a painful restructuring in 2025, the company has cut costs significantly, which should improve profit margins moving forward.
Investment Plan
• Buy Zone: $50.00 – $55.00
o We view the current price of ~$52 as a "bear case" floor, offering an excellent entry point for long-term accumulation.
• Risk Level (Invalidation): Below $48.00
o While a hard stop isn't explicitly set in the report, a sustained drop below the $50 psychological and valuation floor would require re-evaluating the thesis.
• Target: $72.00
o This target assumes a recovery to a more reasonable valuation (20x earnings) over the next 12 months as market sentiment normalizes.
________________________________________
Disclaimer: This content is for educational purposes only and does not constitute financial advice. Past performance is not indicative of future results. Please do your own research before making any investment decisions.
Novo Nordisk A/S Class B
No trades
Market insights

$NVO is NOT the free money you think it is, at least not yet.It's not hard to see that Novo Nordisk NYSE:NVO , Denmarks largest company by revenue, is long due for a bull run. Everything from fundamentals to technicals are saying that it's time for Novo to finally shine but is it really the rocket waiting to liftoff that most of the market thinks?
Donald Trump's threats to acquire Greenland are likely more than just talk. Whether you love him or hate him, it isn't unreasonable to expect that in the coming months talks about taking Greenland will flair up again just judging by his lack of care for international norms/laws and desire to strengthen American influence around the world while turning a profit. The biggest question is how far he is willing to go?
Nobody knows for certain but inferences can be made from one of his most recent actions. The capture of Maduro can be a great example of what he would do to gain influence over a resource rich country. Using common sense, I doubt that the Danish King will be kidnapped. However, it is within reason to believe Trump would be willing to any exert force on the nation short of military action as long as there is a somewhat defensible justification (don't underestimate the lengths he will go to). This force will more than likely put massive strain on the Danish economy, Novo included.
Keep in mind that 57.64% of Novo's revenue is concentrated in the US. The effect of losing this market, even temporarily, makes even the possibility of such action a catalyst for massive selloffs.
In a situation where Denmark is targeted by tariffs Novo would be somewhat shielded by manufacturing plants in the US although the majority of these are "fill-finish" sites. These sites only package the medicine into final form for distribution, no actual medication is synthesized in them.
My biggest takeaway is that caution should be exercised before maxing out your leverage and betting the house. Plenty of churn and uncertainty should be expected in the coming months and be prepared to hold for a while. There is tons of bullish sentiment on this stock and it seems that nobody wants to be the bearer (pun intended) of bad news.
Novo Nordisk is one of the best long term plays right now and should be treated as such, a long term play.
I'd love to hear your thought in the comments.

It's a time for NOVO NORDISK - 40% potential profitThe 4-hour chart of Novo Nordisk (NVO) shows a well-established downtrend that has recently begun to lose momentum, followed by a clear stabilization and early signs of a trend reversal. After a prolonged decline, price formed a rounded base in the 48–52 USD area, indicating seller exhaustion and the emergence of stronger buying interest.
In recent sessions, the stock has started to print higher lows, which is a key structural signal suggesting a shift from bearish to bullish market behavior. Short-term moving averages are curling upward and beginning to converge, reflecting improving momentum and increasing control by buyers. The recent rebound from the local bottom was decisive, showing strong demand on pullbacks rather than aggressive selling.
Price is currently pushing above the recent consolidation zone around the low-50s, which previously acted as resistance. Holding above this level increases the probability of continuation to the upside. From a technical perspective, the area around 75 USD represents a logical upside target, aligning with prior price structure and a major resistance zone from earlier in the trend. This level also corresponds to a measured recovery move from the recent base.
Overall, the chart suggests that Novo Nordisk may be entering a short-term bullish phase. If price maintains its higher-low structure and continues to build momentum above current levels, a move toward the 75 USD area in the near term appears technically achievable, assuming broader market conditions remain supportive.
Potential TP: 75 USD
Disclaimer:
This analysis is provided for informational and educational purposes only and does not constitute financial advice, investment recommendations, or an offer to buy or sell any securities. Trading and investing in financial markets involve substantial risk, and past performance is not indicative of future results. Always conduct your own independent research and consult with a qualified financial advisor before making any investment decisions.

NVO – Weekly Structure UpdateThesis
NVO is attempting a structural reversal after a deep corrective phase, supported by both long-term trend support and improving fundamental visibility.
Context
- Weekly timeframe
- 70% correction from cycle highs
- Price has respected the long-term trendline originating in 2016
- Recent product developments in weight-loss therapies improve long-term business outlook
What I see
- Price held the long-term rising support after the correction
- Recent advance reclaimed the 50-day moving average
- Price is consolidating above short-term support, suggesting stabilization
- Structure is transitioning from decline to base formation
What matters now
- Holding above the 50-day MA keeps the early reversal structure intact
- Next key test sits at the confluence of the 0.618 Fibonacci retracement and the 200-day moving average near the $60 area
Buy / Accumulation zone
- Pullbacks toward the current base and rising support zone remain the area of interest
Targets
- Initial resistance at the 0.618 Fib / 200-day MA confluence
- A confirmed higher low after that test would define Wave 1–2 structure
- Longer-term reference remains the 200-week moving average overhead
Risk / Invalidation
- Loss of the long-term trendline would invalidate the reversal thesis

$NVOThe ascend has begun
Wegovy® pill now broadly available through 70,000+ US pharmacies such as CVS and Costco, select telehealth providers including Ro, LifeMD and Weight Watchers, NovoCare® Pharmacy, GoodRx and more

$NVO Quality GIGA-LONNNNNNNGGGGG!!!This is a weekly of NVO, a global leader in pharmaceuticals addressing issues like obesity, diabetes, among other things. Ever hear of Ozempic? This company makes it. They also have other products in their pipeline which intend to capitalize on these growing epidemics, such as the recently approve ORAL version of Wegovy, a successful GLP-1 agonist. Anyway, back to the chart...You see a head and shoulders reversal at the top (red arcs); price then started forming a bear channel and remained in one for over a year; bear channels are bull flags, so the odds are that we get a bullish continuation once price breaks out to the upside; you see capitulation volume on the large bear weekly candle from July 28 of this year; then notice the retest of that level, forming a double-bottom (green arcs) on the weekly candle of Nov 24; the retest was on much lower volume, indicating supply has dried up, and price is ready for a move higher; Also, note the bullish MACD divergence on the lower pane (green upsloping line) as yet another CONFLUENCE (I hate that word); The Volume by Price indicator (horizontal lines to the left) shows a lot os support at the current levels as indicated by the proportion of green (buying) to grey (selling); I believe price will rotate higher and ultimately test the top of the head and shoulders from whence it came, implying a nearly 3X in price... This is one I would buy in a long-term account and let it marinate. An interesting combination value play AND growth play. Stop loss would be placed below the 2nd double-bottom at about $42...Take profit is $141. DO NOT TAKE THIS TRADE!!! DO NOT FOLLOW MY ADVICE!!! (DISCALIMER)....Merry Christmas from MrJosephTrades. Happy New Year as well...

Novo Nordisk (NVO) 1WI’m looking at the weekly NVO chart as of late December 2025, and this is no longer about fear or headlines. It’s about structure and valuation. After a powerful multi year rally from 2022 to 2024, the stock went through a deep and healthy correction. In 2025, price built a strong weekly demand base around the 50–55 USD area, where volume profile, historical support and long term buyers align. Selling pressure is fading, volatility is compressing, and price action is stabilizing.
Technically, NVO is transitioning into a post correction accumulation phase. On the weekly timeframe, RSI has recovered from oversold territory and is holding a neutral bullish range. MACD is forming a constructive reversal structure, while declining volume on down moves suggests exhaustion rather than distribution. As long as price holds the weekly base and does not break lower, the recovery scenario remains valid, with upside reference zones near 72–75 USD and later 90–92 USD if momentum confirms.
From a fundamental perspective, as of the end of 2025, Novo Nordisk remains one of the highest quality businesses in global healthcare. Revenue exceeds 39 billion USD, with the Diabetes and Obesity Care segment generating more than 85% of total sales, continuing to show resilient growth. The United States and Europe remain the core revenue drivers, while international markets continue to expand steadily.
Cash flow quality remains strong. Operating cash flow is above 18 billion USD on a TTM basis, free cash flow stays positive despite heavy investments into capacity expansion and R&D. Dividend policy remains disciplined and shareholder friendly, with TTM dividend yield around 2.3% and a payout ratio near 35–36%, leaving room for both reinvestment and future dividend growth.
What matters is that the 2025 correction did not come with any structural deterioration of the business. This was not a business breakdown, but a valuation reset after an extreme growth phase. Expectations have been normalized, multiples compressed, while fundamentals stayed intact. That’s where asymmetry begins to emerge.
Tactically, I see NVO as a long term quality compounder, where 2025 served as a reset year. As long as the weekly structure holds, the path for gradual upside remains open. This is not a short term trade, but a trend rebuilding phase driven by cash flow, market leadership and scale.
Sometimes the best opportunities appear not at peak optimism, but when the market has already done its emotional damage and the numbers are still standing.

$NVO is 2026 top trade idea. Offers risk adjusted 50-100%- NYSE:NVO has most likely bottom and offer 50-100% upside from ~$50ish level.
- Weight loss technical addressable market is exploding. People are getting weight & fat conscious.
- Weight loss pill will make it accessible for lot of people. It's quite easy to consume than injectables.

NVO Long
Early signs of a breakout from falling wdege
Plan is to buy if daily candle closes above 57 $.
Add to position: second entry if price closes above 70 $.
Targets: take profits on the way up in the two marked “fair value gap” zones.
Risk idea: current support area around 45–52 $; invalidation if price breaks convincingly below wedge.
I appreciate any comments on my charting.

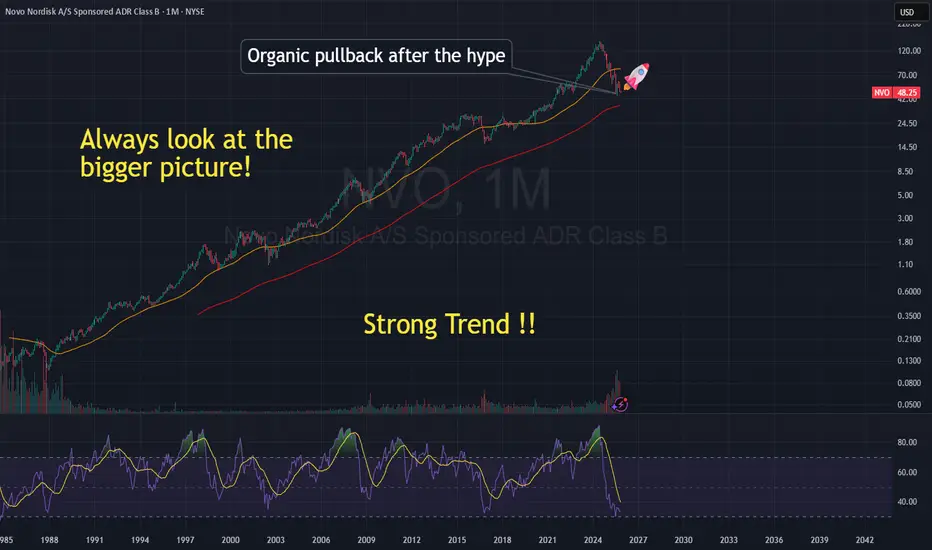
$NVO Last opportunity!🌱 Novo Nordisk: A Healthy Pullback in a Long-Term Growth Story
After years of remarkable growth, Novo Nordisk (NYSE: NVO) has seen its stock cool off — sliding from over 💲130 to around 💲49. At first glance, that might look alarming, but the reality is far more balanced. What we’re seeing is an organic correction after a period of exceptional hype, not a collapse of fundamentals.
💉 From Breakthrough Buzz to Market Reset
The rally through 2022–2023 was powered by massive excitement over Ozempic and Wegovy, Novo Nordisk’s revolutionary GLP-1 drugs transforming diabetes and weight-loss treatment.
As the world caught on, valuations skyrocketed — but eventually, markets needed to breathe. Profit-taking, competition from Eli Lilly’s Mounjaro, and normalization of expectations triggered the current pullback.
📈 The Bigger Picture
Zooming out tells a very different story — over the decades, Novo Nordisk’s stock has gained over 30,000% 🚀, riding steady innovation and strong global demand.
Even now, the long-term uptrend remains intact, with the stock retesting support around $45–$50, a level that previously served as a major base.
💡 A Discounted Opportunity?
For long-term investors, this phase could be an opportunity to accumulate a quality company at a discount.
Novo Nordisk continues to lead in metabolic treatments, maintain strong margins, and expand production — all pillars of sustainable growth.
While no one can predict the short-term, history suggests this pullback may simply be the market’s way of resetting before the next phase of growth.
🧠 Educational Takeaway
🔁 Strong fundamentals can lead to temporary overvaluation during hype cycles.
📉 Pullbacks are natural and healthy in long-term uptrends.
💎 Quality companies often reward patience when bought during corrections.
In short: Novo Nordisk’s story isn’t broken — it’s evolving. This dip may be less of a warning sign and more of a lesson in long-term investing discipline. 🌍📊
NVO Swing LongFew ways to approach this trade. Look for previous lows at 45 to get taken and look to swing long once back above. More conservative approach would be to wait for a monthly close back above 56.46 as that would confirm a HTF change trend where one should look to buy on pullbacks. If price takes the lows at 45 but is unable to reclaim them as support the possibility of a drop to 36-38 opens up which would be another swing long opportunity.

$NVO – Weekly Structure | Reversal From Long-Term SupportThesis
NYSE:NVO is attempting a structural reversal after a deep corrective phase, supported by long-term trend support and improving fundamental visibility.
Context
- Weekly timeframe
- Multi-year uptrend followed by a sharp corrective decline
- Price has retraced into the long-term rising support zone
- Recent developments in weight-loss treatments improve medium- to long-term outlook
What I see
- Price has held the long-term rising trendline
- Corrective ABC structure appears complete
- Price is stabilizing inside a well-defined accumulation range
- Momentum is shifting from expansion down to basing behavior
What matters now
- The key confluence level sits at the 200-day moving average and the 0.618 Fibonacci retracement near the $59 area
- A break and hold above this level would confirm the reversal structure
- Failure at this level would likely extend consolidation
Buy / Accumulation zone
- The current base along long-term support remains the primary area of interest
- Structure favors accumulation while price holds above the rising trendline
Targets
- First confirmation level at the 200-day MA / 0.618 Fib confluence
- Longer-term reference remains the 200-week moving average in the $80 area
- That level represents a full structural reset following the correction
Risk / Invalidation
- Loss of the long-term rising trendline would invalidate the reversal thesis

NVO mid-term TANVO keeps getting stronger, there's a positive accumulation on daily and it's currently under the resistance of SMA50 and it should breakout, let's wait and see. Long-term accumulation is getting stronger as well but the indicators are also under the resistance yet, though it shouldn't be hard for NVO to push the price towards $60ish and see where we go from there.

Novo Nordisk will have first mover advantage with WeygoviNYSE:NVO is now breaking out on very strong news. Novo Nordisk will have first mover advantage with their oral weight loss pill, Weygovi.
Stop $48
Target $70

Breaking: Novo Nordisk A/S (NVO) Set For 80% BreakoutShares in Novo Nordisk surged over 7% Tuesday premarket after the Wegovy maker secured approval of its GLP-1 pill — a world first.
The U.S. Food and Drug Administration’s approval of Novo Nordisk’s GLP-1 pill gives the Danish pharmaceutical giant a head start over U.S. rival Eli Lilly
The pill’s starting dose of 1.5 milligrams will be available in pharmacies and via select telehealth providers with savings offers for $149 per month in early January, the firm said.
Cash-paying patients can access it for the same price via President Donald Trump’s direct-to-consumer website, TrumpRx, according to the deal Novo Nordisk struck with his administration last month. Drug pricing has been top of mind this year as the U.S. looks to reduce the costs paid by consumers.
The approval caps a turbulent year for Novo, which has been marked by board drama, supply chain shortages, a bidding war against Pfizer, and criticisms over the execution of its U.S. strategy.
Technically, NYSE:NVO stock is gearing for a 80% breakout as the asset is set to break above the symmetrical triangle pattern amidst the FDA approval news bid.
About NVO
Novo Nordisk A/S, together with its subsidiaries, engages in the research and development, manufacture, and distribution of pharmaceutical products in Europe, the Middle East, Africa, Mainland China, Hong Kong, Taiwan, North America, and internationally. It operates in two segments, Diabetes and Obesity Care, and Rare Disease. The Diabetes and Obesity care segment provides products for diabetes, obesity, cardiovascular, and other emerging therapy areas.

NVO: Demand volume confirmed!NVO: Demand volume confirmed!
.
Backtest at LPS and go up short view, then.
.
US STOCKS- WALL STREET DREAM- LET'S THE MARKET SPEAK!

$NVO - Novo Nordisk Has Taken a Beating 2025Novo Nordisk’s bullish scenario centers on sustained global demand for its GLP-1 franchise, with Wegovy and Ozempic expanding beyond diabetes into obesity, cardiovascular protection, and additional metabolic indications. Capacity expansions support multi-year volume growth, while emerging markets adoption accelerates. Pipeline assets, including next-generation oral GLP-1s and combination therapies, provide upside optionality and extend the company’s competitive moat.
Margins remain strong due to scale advantages and high pricing power, driving robust free-cash-flow growth and rising returns on capital. In this scenario, Novo continues compounding earnings at a high single- to low double-digit rate, pushing intrinsic value meaningfully above current levels and supporting further share appreciation.
Keeping an eye on this one around these levels.
Disclaimer:
I do not provide personal investment advice and I am not a qualified licensed investment advisor. I am an amateur investor.
All information found here, including any ideas, opinions, views, predictions, forecasts, commentaries, suggestions, or stock picks, expressed or implied herein, are for informational, entertainment or educational purposes only and should not be construed as personal investment advice. While the information provided is believed to be accurate, it may include errors or inaccuracies. I will not and cannot be held liable for any actions you take as a result of anything you read here.
Conduct your own due diligence, or consult a licensed financial advisor or broker before making any and all investment decisions. Any investments, trades, speculations, or decisions made on the basis of any information found on here, expressed or implied herein, are committed at your own risk, financial or otherwise.
Feel free to give us a follow and shoot us a like for more analysis updates.

Novo Nordisk - Inverse H&S after a long bear marketIm going long here with a tight stop loss. Thinking it´s time for a reversal. I pointed out which levels im looking at.

Novo Nordisk about to finish accumulation range?As the title says. Looks like NYSE:NVO is finishing up an relative small accumulation range. Question is whether the spring-test is done here or not. Sometimes there's a big push and retrace to create a test. Sometimes something that resembles current PA can be enough.
Let's see how it develops. But expecting continuation up on the higher timeframe. Breakout and retest of downwards trend (descending channel) would be a big sign.

$nvoYieahhh
1. Volume Shelf
2. Heavy activity last 4 months in volume
3. RSI turning
4. MACD turning
I would like to see $95 by Feb 2027.
yieahh

NVO-BullishBearish trend showing signs of reversal
SFP at its Daily Support
Divergence on volume profile and RSI

$NVO inverse shoulder head shoulder completedNYSE:NVO is now trading above $50 and is on the verge of breaking out. Still holding a large position. Novo Nordisk should see $70 in the next few months.

NVO has printed a double bottom, mooning soon?Recently formed the second bottom, currently sitting inside the golden retracement zone. I think this can be a good accumulation zone!
