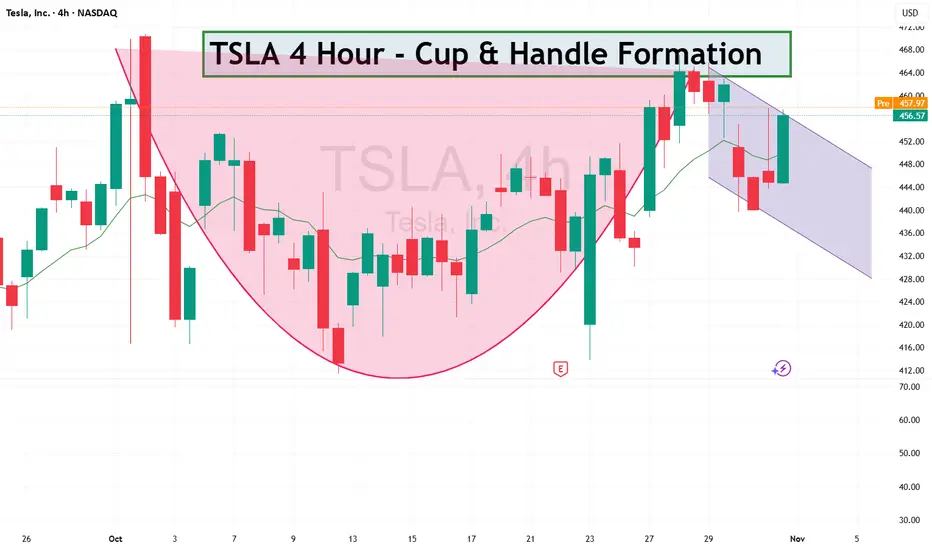
TALS - Cup and Handle FormationTSLA looks quite bullish, as you can see cup and handle formtion on 4 hour.
#TSLA #Tesla #Stocks #Trading #StockMarket #TechnicalAnalysis
Trade ideas
TSLA QuantSignals V3 Swing 2025-11-01TSLA QuantSignals V3 Swing 2025-11-01
TSLA Swing Signal | 2025-11-01
• Direction: BUY CALLS | Confidence: 55%
• Horizon: 20 days to 2025-11-21
• Strike Focus: $425.00
• Entry Range: $43.52
• Target 1: $65.28
• Stop Loss: $32.48
• 1W Move: -0.44%
• 2W Move: +0.11%
• Volume vs Prior Swing: 0.8×
• Swing Range: $439.61 - $467.00
• 🔴 HIGH RISK WARNING: Use only small position size due to lower confidence and high uncertainty.
⚖️ Compliance: Educational swing commentary for QS Premium. Not financial advice.
🎯 TRADE RECOMMENDATION
Direction: BUY CALLS
Confidence: 55%
Conviction Level: LOW
🧠 ANALYSIS SUMMARY
Katy AI Signal: NEUTRAL with bearish bias (target $452.89, stop $462.94) - but institutional guidance shows BUY CALLS primary bias (+1.8 composite score)
Technical Analysis: Strong bullish gap (+0.11%), price in upper swing zone (60.2%), all EMAs aligned bullish, but MACD bearish and trend strength WEAK
News Sentiment: Mixed with high-impact Tesla stories - Michael Dell/Cathie Wood supporting Musk's pay package is bullish, but political/regulatory uncertainty creates headwinds
Options Flow: Extremely bearish Put/Call Ratio (10.99) suggests institutional pessimism, max pain at $455.00 below current price
Risk Level: HIGH - conflicting signals between directional guidance and options flow, weak momentum despite recent 5.40% gain
💰 TRADE SETUP
Expiry Date: 2025-11-21 (20 days)
Recommended Strike: $425.00
Entry Price: $43.40 - $43.65
Target 1: $65.28 (50% gain from entry)
Target 2: $86.95 (100% gain from entry)
Stop Loss: $32.48 (25% loss from entry)
Position Size: 2% of portfolio (low conviction requires reduced exposure)
⚡ COMPETITIVE EDGE
Why This Trade: Multi-timeframe STRONG_BULLISH alignment vs single-day noise creates swing opportunity
Timing Advantage: 20-day expiry provides buffer for weak momentum to strengthen, gap support at $433.22
*
Image
QS Analyst
APP
— Yesterday at 8:56 PM
*Risk Mitigation: Balanced delta (0.725) provides optimal risk/reward, stop protects against Katy's bearish $462.94 resistance
🚨 IMPORTANT NOTES
⚠️ CRITICAL CONFLICT**: Options flow shows extreme bearish positioning (P/C ratio 10.99) contradicting directional guidance
⚠️ Katy AI actually signals NEUTRAL with bearish bias - trade goes against primary AI engine recommendation
⚠️ Weak bullish signal (score: 0.8) requires cautious position sizing and tight risk management
⚠️ Monitor $455.00 max pain level as potential resistance zone
📊 TRADE DETAILS 📊
🎯 Instrument: TSLA
🔀 Direction: BUY 📈
🎯 Strike: 425.00
💵 Entry Price: 43.52
🎯 Profit Target: 65.28
🛑 Stop Loss: 32.48
📅 Expiry: 2025-11-21
📏 Size: 2.0
📈 Confidence: 55%
⏰ Entry Timing: N/A
🕒 Signal Time: 2025-11-01 23:56:15 EDT
🔴 HIGH RISK WARNING: Use only small position size due to lower confidence and high uncertainty.

Is Tesla Setting Up for a Rebound? Key Entry Levels Inside🎯 TSLA: The "Thief Strategy" Playbook | Swing/Day Trade Setup 📈
🔥 Quick Overview
Asset: Tesla, Inc. (TSLA)
Bias: 🐂 BULLISH
Strategy Type: Thief Layering Entry Method
Risk Level: Medium-High (Swing/Day Trade)
💰 The "Thief" Entry Strategy Explained
The "Thief Strategy" uses multiple limit orders (layering method) to accumulate position at different price levels. Think of it like setting traps at various floors of a building—you catch opportunities wherever price decides to visit! 🎣
📊 Entry Zones (Layer Your Orders):
Layer 1: $430.00
Layer 2: $435.00
Layer 3: $440.00
💡 You can add more layers based on your own risk appetite and account size. The beauty of layering? You average your entry and reduce timing risk!
🛡️ Stop Loss (SL):
Thief SL: $415.00
⚠️ Important Note: This is MY stop loss level based on the Thief Strategy framework. You're the captain of your own ship! 🚢 Adjust your SL based on YOUR risk tolerance and account management rules. Trade at your own risk—make money, take money, manage wisely!
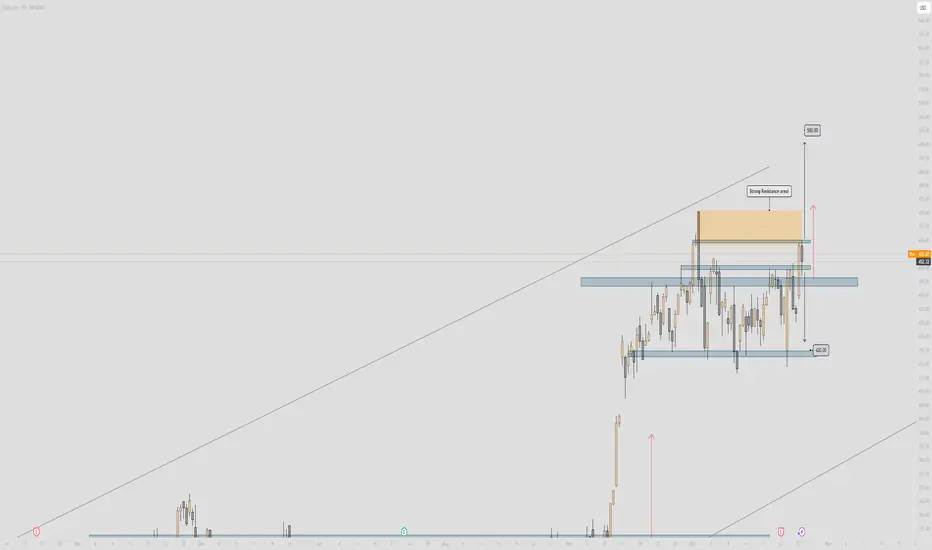
🎯 Target (TP):
Primary Target: $490.00
🚨 Why $490? This zone represents a confluence of:
Strong resistance area
Potential overbought conditions
Historical trap zone where bulls get exhausted
📢 Thief OG's Reminder: I'm NOT saying you MUST take profit only at my TP level. If you see profits that make you smile, SECURE THEM! 💵 The market gives, and the market takes. Be greedy when you can, be smart always.
🔍 Technical Analysis Breakdown
Tesla is showing bullish momentum structure with potential for continuation toward the $490 resistance zone. The layering strategy allows us to build position as price potentially dips into demand zones before the next leg up.
Key Technical Levels:
Support Zone: $430-$440 (Our entry layers)
Invalidation: Below $415 (Stop loss)
Resistance Target: $490
📌 Related Pairs to Watch (Correlation Play)
Understanding correlated assets helps confirm your thesis:
AMEX:SPY (S&P 500 ETF)
TSLA often moves with broader market sentiment
Watch SPY for overall risk-on/risk-off environment
NASDAQ:QQQ (Nasdaq 100 ETF)
Tech-heavy index where TSLA is a major component
Strong correlation with TSLA price action
NASDAQ:NVDA (NVIDIA)
Both are high-beta tech growth stocks
Often move together during risk appetite shifts
TVC:DXY (US Dollar Index)
Inverse correlation: Strong dollar = pressure on growth stocks like TSLA
Weak dollar = tailwind for equities
💡 Key Point: If SPY/QQQ are bullish + DXY weakening = Strong confirmation for TSLA upside!
⚡ Trading Tips for Thief OG's
Don't FOMO — Let price come to your layers
Manage position size — Each layer should be equal weight
Trail your stop — Once profitable, protect gains
Watch volume — Confirm breakouts with volume spikes
Stay flexible — Market conditions change; so should you!
🎬 Final Words
This setup is all about patience, precision, and profit extraction! 🎯 The Thief Strategy isn't about stealing from the market—it's about being SMART and setting yourself up for success with calculated entries.
Remember: The best trades are the ones where you're prepared, not scared! 😎
✨ If you find value in my analysis, a 👍 and 🚀 boost is much appreciated — it helps me share more setups with the community!
#TSLA #TeslaStock #SwingTrading #DayTrading #ThiefStrategy #LayeringStrategy #StockMarket #TradingIdeas #TechnicalAnalysis #BullishSetup #TradingStrategy #RiskManagement #StockTrading #MarketAnalysis #TradingCommunity

Tesla Consolidates Before Next Bullish BreakoutTesla Consolidates Before Next Bullish Breakout — Eyes on $550, $600, and $650 Targets
Tesla’s price action has formed a series of bullish continuation patterns, each followed by strong upward moves. Currently, the stock is consolidating between $413 and $470, creating a potential accumulation zone before the next breakout.
The repeated triangle breakout patterns suggest a continuation of the bullish trend if Tesla manages to hold above the $413 support level.
Once price breaks above the $470 resistance, Tesla could accelerate toward the next targets at $550, $600, and $650, as indicated on the chart.
In the short term, some sideways movement within the current range is possible before the next strong impulse upward.
You may find more details in the chart!
Thank you and Good Luck!
❤️PS: Please support with a like or comment if you find this analysis useful for your trading day❤️

Tesla Wave Analysis – 30 October 2025
- Tesla reversed from the key resistance level 467.30
- Likely to fall to support level 415.60
Tesla recently reversed from the resistance area between the key resistance level 467.30 (which stopped the previous impulse wave I at the start of October) and the resistance trendline of the daily up channel from April.
The downward reversal from this resistance level 467.30 is likely to for the daily Japanese candlesticks reversal pattern Evening Star Doji – strong sell signal for Tesla.
Given the strength of the resistance level 467.30 and the overbought daily Stochastic, Tesla can be expected to fall toward the next support level 415.60 (low of waves ii, c and a).

TSLA 3-Drive & ABCD Pattern – Path to $500 Before a PullbackThis chart highlights multiple harmonic and Elliott structures aligning for a potential bullish extension in Tesla (TSLA). A well-defined ABCD pattern and 3-Drive pattern suggest momentum building toward the $500 zone, supported by Fibonacci projections and channel resistance.
The current wave structure points to an imminent 5-wave advance, likely completing the “Drive 3” and pattern D confluence area near $500–505. Following that move, a corrective pullback (ABC) is anticipated, possibly retesting prior support near $440–400.
Key elements featured:
ABCD completion zone: around $500
3-Drive pattern: confirming exhaustion at upper trendline
Elliott 5-wave projection: short-term bullish continuation
Possible corrective phase: after the final wave up
📈 Watching for confirmation of Wave iii and potential exhaustion signals near $500 before considering downside setups.

TSLA: one more leg down potential NASDAQ:TSLA
Watching for one more leg down into the 430–400 mid-term support zone to potentially complete the corrective structure, if price remains unable to break out above the October/November highs.
Chart:
Alternatively, if price manages to break-out and stay above above recent resistance, odds favor continuation to 555-630 resistance zone.
Chart:
Previously:
• On macro bottoming potential (Jun 6):
tradingview.com
• On support (Sep 19):
• On mid-term support (Oct 7):

TSLA CCREALLY GOOD premium and volatility here.... wow. Pay package means
Buy low, sell high. It's at a high spot right now.

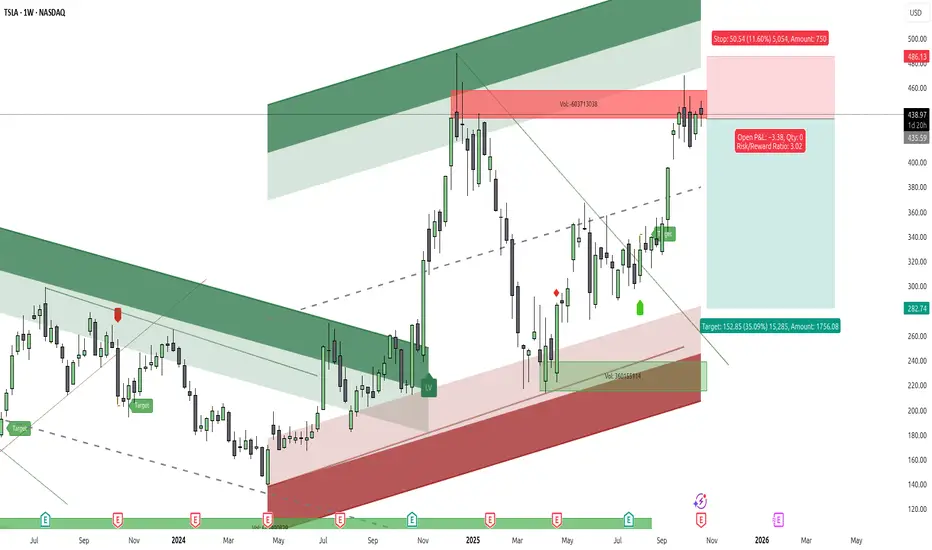
$TSLA: Gravity Reasserts ItselfGreetings, traders.
The NASDAQ:TSLA chart is currently painting a picture of a profound test of market physics. This isn't a "battle"; it's a conflict of impersonal forces.
On one side, we have "Lift"—the powerful, almost unnatural force of a narrative focused on AI, robotics, and a limitless future. This force defies traditional valuation and pushes the price to high altitudes.
On the other, we have "Gravity"—the undeniable, constant pull of fundamental reality, which just made itself known in the Q3 earnings report.
The chart is our laboratory, and we are here to observe these forces at work.
The Technical Landscape
The Macro View: The weekly chart shows the narrative's 'Lift' failing at a critical altitude. The price has been decisively rejected from the " gravitational ceiling " of its multi-year ascending channel (approx. $480-$500). This is a level where the weight of reality has consistently proven too strong. The most recent large, bearish candle is not an attack; it is simply the pull of gravity reasserting its dominance over upward momentum.
The Tactical View: The daily chart shows why this 'Lift' is failing. We saw a classic bearish MACD divergence on the final push to the highs—price floated higher, but the underlying force (momentum) was fading. The MACD has now crossed bearishly, confirming the shift. Price is now coiled in a tight daily wedge, a tactical "decision point" where we will see if 'Lift' can be re-established or if 'Gravity' will take full control.
The Philosophy: A Tale of Two Forces
To understand NASDAQ:TSLA $, you must understand the two opposing forces that define its physics.
The 'Lift' (The Narrative Camp): The bull case is a qualitative vision. It's about Robotaxis, Optimus, and AI. This crowd is rightfully unconcerned with a single quarter's auto margins because, in their view, they are buying a different company—one that exists 10 years in the future. Their conviction is deep and provides a powerful upward force.
The 'Gravity' (The Quantitative Camp): The bear case is a spreadsheet. It's about the "now." The Q3 earnings report is the catalyst for this "counter-force."
EPS Miss ($0.50$ vs $0.53$) Severe margin compression from aggressive price cuts. A fundamentals-based valuation (e.g., Morningstar's $250 FVE) that is miles away from the current price.
This setup is a clear piece of the puzzle.
It shows what happens when the powerful force of 'Lift' (Narrative) reaches its apex and meets the immovable, constant pull of 'Gravity' (Macro Supply + Fundamental Reality). At this specific junction, 'Gravity' is in control.
An Illustrative Setup
We do not predict; we observe and we react.
The confluence of a failing 'Lift' at a 'gravitational ceiling,' combined with the new "weight" of a fundamental catalyst, provides a high-probability, asymmetric setup. This is not about being "right"; it is about defining risk.The chart illustrates a potential short setup based on this confluence:
Entry: ~ $435.00$ (Sell Short)
Stop-Loss: ~ $486.00$
Target: ~$282.00$
Risk-to-Reward Ratio: ~3
The confirmation for this thesis would be a breakdown from the daily wedge (around $430), signaling that 'Gravity' has taken firm hold.The stop-loss at $486$ is the "escape velocity" point. If the price breaks above it, the 'Lift' force has overcome 'Gravity,' the thesis is invalidated, and we step aside.
One cannot argue with the market's physics.
Respect the level; it is your anchor to reality.
Disclaimer: This is not financial advice. It is for educational and informational purposes only. Please conduct your own research and manage your risk accordingly.
Tesla at a Breakout Crossroad
The Tesla (TSLA) daily chart shows a classic Cup & Handle pattern nearing a critical resistance zone. The key level sits around $450, aligning with a long-term descending trendline (in blue).
Technical Overview:
General Trend:
Since early 2025, TSLA has been in a steady uptrend.
The 50-day moving average (SMA 50) near $220 acts as strong dynamic support and is still trending upward.
The structure indicates Tesla is finishing the “handle” phase of the pattern — a decisive moment is approaching.
Bullish Scenario:
If the price breaks and holds above $450 with strong volume, it would confirm the Cup & Handle breakout.
Potential upside targets:
Short-term target: $503
Mid to long-term target: $565 (based on cup depth projection)
Stop loss: Below $410
A breakout above $450 could trigger a strong continuation rally as investors re-enter on technical confirmation.
Bearish Scenario:
Failure to break above $450 and a drop below $410 could invalidate the bullish setup, leading to a deeper correction.
Potential downside targets:
Short-term target: $375
Long-term target: $320
Stop loss: A confirmed close back above $445
This would suggest that the handle failed, and selling pressure could accelerate toward lower supports.
Timeframe Summary:
Short-term (1–3 weeks):
Expect consolidation between $410–$450, with bias toward a breakout if the tech sector remains strong.
Long-term (3–6 months):
A confirmed breakout above $450 opens the path toward $565.
If rejected, expect a correction toward $375, possibly forming a new accumulation base.

Tsla weekly chartI think it's time to sell tsla
We got a bad signal down trend candlestick & down trend RSI
GOOD LUCK 4ALL

Tesla Stock: Poised for a MASSIVE CRASH? Buckle Up!🚀 Tesla Stock: Poised for a MASSIVE CRASH? Buckle Up! 📉
🔥 Explosive Technical Breakdown!
On the 4-hour timeframe, Tesla is teetering on the edge! A break below $411.42 screams a BEARISH SETUP! 🚨 But hold up – this only kicks in if the price fails to BLAST through $454.43 resistance.
💥 Bigger Picture? It’s BRUTAL! Tesla just SMASHED a critical support level, paving the way for a VICIOUS DOWNtrend! Bears are circling, and the stage is set for a MELTDOWN! 😈
Will Tesla CRUMBLE or pull a last-second escape? Who’s next to get WRECKED?
🚀 Analysis + LIGHTNING-FAST Signals? Follow NOW! ✅
📊 Want a GOLD Decision-Making Chart? Smash LIKE! ✅
💬 Got Thoughts? Comment – Replying to the BEST! ✅

TSLA shorts may get toastedA rising trendline acting as strong dynamic support from the August lows.
Resistance zone near $470–475 (yellow line, recent double-top area).
Current price at $456, holding above trendline support.
Support floor near $290, far below current levels — indicating we’re in a mid-term uptrend phase, not deep correction.
This pattern fits a rising channel consolidation near resistance — the next move depends on whether the trendline holds.
📈 Bullish Scenario
Setup:
TSLA is holding the ascending trendline while consolidating just below resistance — a classic bullish continuation structure.
Confirmation Triggers:
Break and daily close above $470–475 (clear breakout).
Follow-through volume or a strong gap-up session confirming momentum.
Short-Term Targets:
$490–495 → initial breakout target (projected move from last swing).
$510–520 → extended target if buyers sustain momentum.
Catalysts:
Broader tech strength (QQQ, NASDAQ rally).
Positive EV demand data or production updates.
Institutional accumulation at the breakout level.
Invalidation:
Break and close below $445, violating trendline support.
Probability: ~60% (uptrend intact, momentum favors bulls).
📉 Bearish Scenario
Setup:
If TSLA fails to break $470 again and loses the $445 trendline, momentum could unwind toward prior support.
Confirmation Triggers:
Close below $445 with increased volume.
Failed retest near $450–455 forming lower high.
Short-Term Targets:
$420–425 → first support zone from early October.
$390–400 → deeper correction toward base of last breakout.
Catalysts:
Weak market sentiment or NASDAQ pullback.
Negative headlines on delivery numbers or margins.
Broader EV sector weakness.
Invalidation:
Breakout above $475 with strong follow-through.
Probability: ~40% (depends on strength of support at $445).
⚖️ Neutral / Sideways
If TSLA oscillates between $445–475, expect continued range consolidation along the trendline — typically preceding a directional breakout in 1–2 weeks.
🧩 Summary Table
Bias Confirmation Target Zone Invalidation Notes
Bullish Close > $475 $490 → $520 < $445 Continuation of uptrend
Bearish Close < $445 $425 → $400 > $475 Trendline break
Neutral Range $445–475 — — Coiling near apex
🕒 2–3 Week Projection
Bullish path: Hold $450–455 → breakout above $475 → reach $495–500 by mid-Nov.
Bearish path: Reject $470 → break below $445 → pull back to $420 by late Nov.

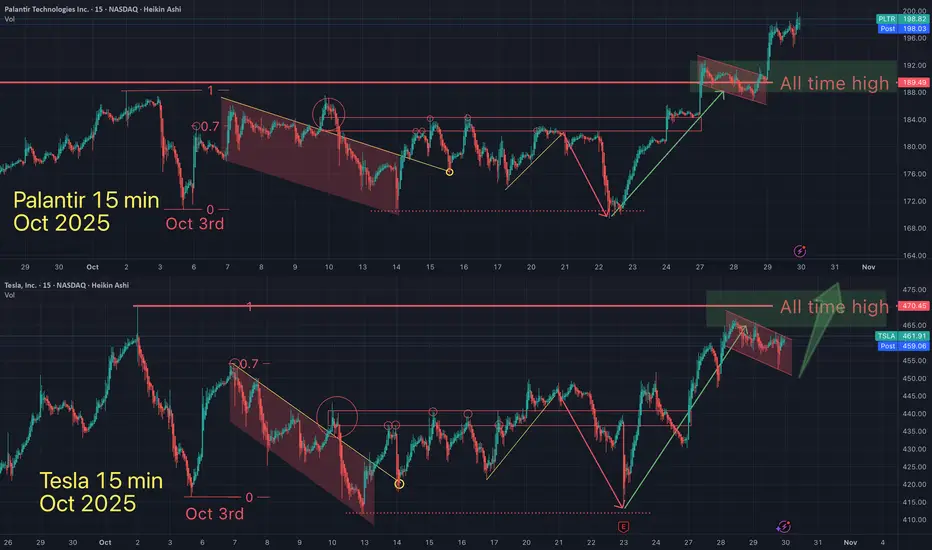
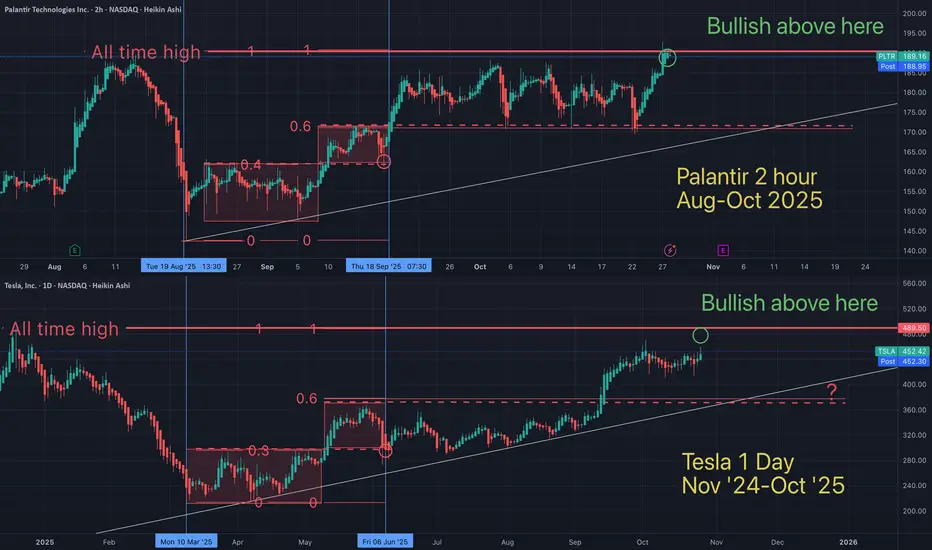
You will ask yourself, "how did he know Palantir would do that"?On Oct 7th I suggested that Palantir & Tesla were in a very bullish long term pattern and were both about to *soon break out into new all time highs (ATH). Palantir just did...is Tesla next?
Blow off top next?
May the trends be with you.
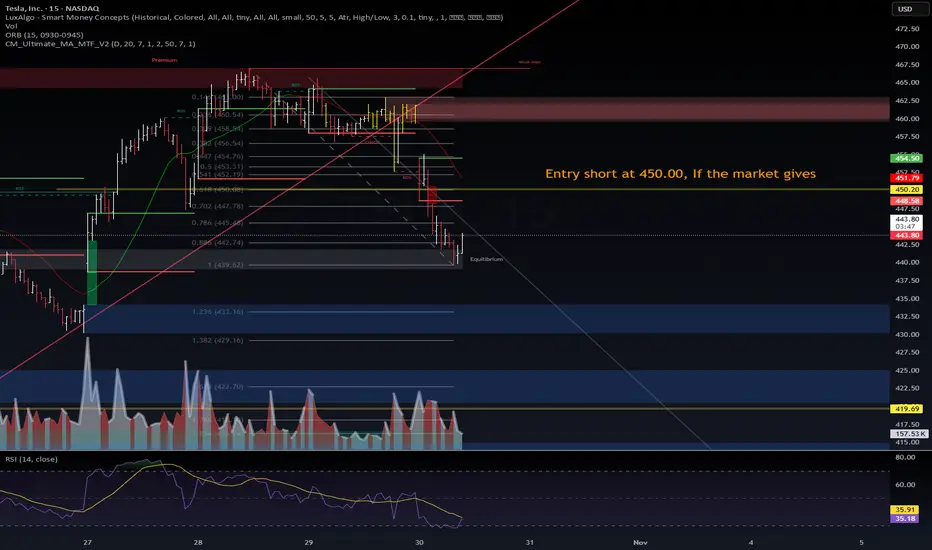
$TSLA | Short Setup Loading — 450 is the Line in the Sand⚙️ NASDAQ:TSLA | Short Setup Loading — 450 is the Line in the Sand
Tesla continues its controlled descent after rejecting the weak high at 465–470.
Price retraced into the 0.786 Fib (≈ 445) zone, finding short-term equilibrium before the next leg.
📊 VolanX DSS Technical Outlook (15m):
Structure confirms bearish displacement with multiple CHoCH breaks.
Retrace zone: 447 → 450 = ideal short re-entry if market allows.
Target zones: 433 → 420 → 419.69 (liquidity shelf).
RSI = 35 → momentum favors continuation; no confirmed divergence yet.
Volume dropping into equilibrium = possible redistribution phase.
🎯 Trade Plan:
Entry short @ 450.00 if market gives.
Maintain stop above 452; scale out near 433–420.
VolanX Liquidity-Reversal-Guard (LRG) stays inactive until RSI divergence appears.
Macro Context (Oct 30 2025):
Fed tone = hawkish → yield = 4.10 %.
Risk assets fading post-earnings; AI and EV names seeing capital rotation.
NASDAQ:TSLA tracking NASDAQ:QQQ correlation ≈ 0.83 → expect synchronized intraday volatility.
VolanX DSS Bias:
🟥 Bear 60 % 🟨 Neutral 25 % 🟩 Bull 15 %
“450 is the battlefield — equilibrium decides who walks away.”
#TSLA #WaverVanir #VolanX #SmartMoney #Liquidity #Macro #Fed #AITrading #SPY #QQQ #Tesla #ShortSetup
TSLA – Key Resistance Retest AheadNASDAQ:TSLA stock price continues to show strong bullish momentum, recently breaking above short-term consolidation near the $440–$445 zone. The current move suggests buyers are regaining control after a period of sideways accumulation, with the next key resistance area sitting between $470–$490, where previous supply triggered multiple rejections.
If price can sustain above the $440–$445 demand zone, a breakout above $470 could confirm bullish continuation toward $520–$540, aligning with the next liquidity pool. This area could attract profit-taking or a short-term retracement before further upside extension.
However, if the price fails to clear the $470–$490 resistance and forms a rejection candle, sellers may attempt to push price back into the previous consolidation range. A clean break below $430 would invalidate the bullish structure, potentially exposing downside toward $400.

TSLA Bullish Breakout? Flag Resolution Toward 525–530Hello, traders. TSLA’s 1D chart has been trending higher since the early-September breakout, then cooling into a neat bull flag. Price is holding above the MA20, MA60, and MA120, with the MA20 around ~$440 acting as first dynamic support. Volume expanded on the run-up and faded during the flag—classic continuation behavior—while volatility has eased but remains elevated.
The key battleground is the resistance at $481, the early-October peak and upper boundary of the flag. A daily close above $482 would confirm the breakout and put the psychological $500 on the table, with extension toward the $525–$530 supply zone if momentum and volume expand. If buyers don’t force the break immediately, a dip toward the $430–$440 area (near MA20) is a constructive retest zone before another attempt at the highs.
The idea fails on a decisive daily close below $415. That would break the flag support, flip the short-term structure, and expose downside toward the MA60 region near $390. Until then, the primary path favors continuation: breakout entries on a daily close >$482, with partial profits near $500 and runners into $525–$530; conservative stops live below $415–$417 depending on tolerance.
This is a study, not financial advice. Manage risk and invalidations.

Going Short TESLA HereTrading Fam,
I'm taking my first ever short here since implementing my new indicator. It has been killing it on the long side. We've exited our last 17 trades, all for wins, with an average profit of 30% per trade and our portfolio is up over 86% on the year. Now, it's time to test the short signals. We received two here on TSLA. I've taken a small entry since this is my first short, representing around 9% of the portfolio total. I'm going to target $350 but will not take more than a 7% loss, thus my stops are set at $476 bring the rrr on this trade entry to 1:3. Let's see how this goes.
✌️Stew

TSLA | Smart Money FlowNASDAQ:TSLA | Smart Money Flow
Tesla’s building pressure right at the distribution zone (460–470) liquidity’s loading up top.
Below sits a clean accumulation block (400–430) stacked with FVGs waiting to get tapped.
A quick sweep → bounce from that zone could send it straight toward $500+.
Structure still clean, bulls still in control.

TSLA - Important!🔥 Tesla Analysis (Daily Structure) 🔥
Alright, let’s break this one down 👇
🧱 Structure Overview
Tesla’s price is currently hovering around $452, sitting right below a major resistance zone between $455 – $470 (highlighted in orange). This area has acted as a strong ceiling multiple times — every approach has been met with rejection pressure.
Below, the support floor sits clean around $420 – $425, which has been holding the range low for a while. We’re essentially trapped in a sideways consolidation box — a range between that $420 low and the $470 resistance cap.
🧭 Bias
Current structure = Neutral to Bearish
Price just wicked into resistance, showing signs of rejection. Unless we see strong follow-through above $470 with clean volume, this is likely a reaction zone for shorts.
💡 Key Zones
Resistance (Sell Zone): $455 – $470
Strong supply — expect sellers to defend this area.
Support (Buy Zone): $420 – $425
Range demand base — liquidity resting below.
🎯 Scenarios
Bearish Setup (Higher Probability for Now)
If Tesla fails to break and close above $470, look for a move back down to $420 — possibly a liquidity grab under the range. Confirmation would be bearish engulfing or a strong rejection candle from resistance.
Bullish Setup (Breakout Play)
If price cleanly closes above $470 and retests it as support, we could open the door toward $500 (measured move target). That’d be a breakout from the range and continuation of the larger bullish channel.
⚖️ Risk Management
Bears: Stop above $475 – $480
Bulls: Stop below $445 if entering after breakout retest
Keep R:R ≥ 1:2
🧠 Summary
Tesla’s in a tight range — smart money likely accumulating or distributing near these highs. Watch for rejection signs around $470 for short plays, or confirmation above it for the next leg to $500.
This is the make-or-break zone — the next move will define Tesla’s mid-term direction. ⚡️
TSLA is going UP! .. time to buy!Tsla aka Tesla was stuck in-between 2 powerful support and resistance zones (the red and green lines) .. It finally broke to the upside and broke above the resistance level. It is now very likely to head to the next resistance zone which was the previous high (the next resistance zone has been drawn as the white line shown on the chart) - this is where we will be taking profit at. BUY NOW!

Tesla / Palantir fractal showing both will hit ATH soonFractals are a mathmatical anomaly, if you understand linear equations (and believe the market is "random"). All assets are doing the same patterns over and over, on all time frames. You just need to see it for what it is.
May the trends be with you.
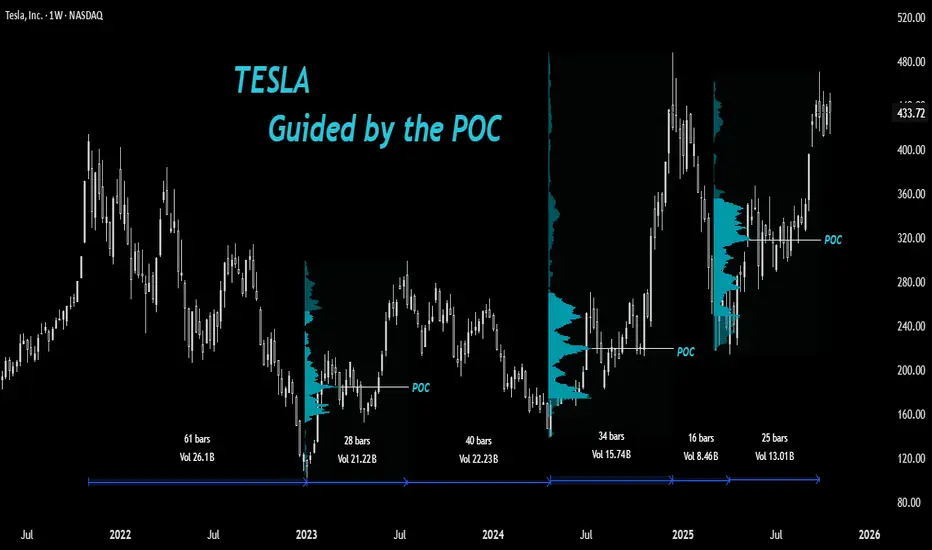
Tesla: Guided by the Point of Control🔎Understanding How Stocks React at Key Volume Profile Levels
In this post, let’s study how a stock can react around important Volume Profile levels and how we, as traders, can take advantage of this behavior.
🔘 A Quick Look at Volume Profile
The Volume Profile shows how much trading took place at each price level. Think of it like a sideways histogram that highlights where buyers and sellers were most active. It helps identify price zones that the market accepted (heavy trading) and those it rejected (light trading).
In between a Volume Profile is the Point of Control (POC) - the price level where the highest trading volume occurred. This is often considered as the market’s fair value zone, where buyers and sellers found the most agreement.
The POC tends to act like a magnet for price. When price moves too far away from it, it often returns to test that level since it represents strong trading interest. That’s why traders use POC zones to mark key supports, resistances, and potential entry areas.
In short:
The Volume Profile shows where trading happened. The POC shows where it mattered the most.
🔘 Overview: TSLA’s Story
After printing a high of $414 in 2021, Tesla (TSLA) has been trying to decisively break that level for almost four years. It made two attempts - first in December 2024, which was quickly faded, and again in September 2025.
🔘 The Fall and Bottom Formation
The stock went through a major bearish phase from $414 down to $101 in 2022 - a massive 75% drop. Then came a sharp V-shaped rally from the bottom - a 194% rise over about 28 weeks, retracing roughly 60% of the entire fall in a short span.
🔘 Why It’s Hard to Catch the Bottom
Catching a stock at the exact bottom is one of the hardest things in trading. No one really knows when the real bottom is forming.
At that point, fear is high, sentiment is negative, and the trend still looks weak. Most traders wait for confirmation - but by then, the bottom is already behind.
Catching the exact low becomes more like a luck than skill. No doubt 'smart traders' focus on catching the early reversal and not the perfect bottom, there are others who wait for pullback opportunities to a fair price.
🔘 April 2024 Bottom Formation
After rallying sharply, TSLA began to pull back from around $300 in July 2023. Traders who had missed the earlier move were waiting patiently with their limit orders for a healthy correction.
But the question was - where should those limit orders be placed?
◽️At the breakout zone around $218?
◽️Near the 50% or 61.8% Fibonacci retracement?
◽️Or below the April 2023 low near $152 for a possible liquidity grab?
The truth is - nobody actually knows the exact level because nothing works all the time.
However, the POC can often help identify a probable fair value zone where accumulation tends to happen.
Although we can’t pinpoint the exact level where a pullback will end, the area 'around' the POC often serves as one of the most reliable zones to accumulate a bullish stock.
And that’s exactly what happened in April 2024. The stock dipped below the previous rally’s POC, grabbed liquidity under $152, and then reversed sharply.
🔘 The Sharp Rally to New Highs
After that, TSLA entered a strong bullish phase, rallying from the April 2024 low to new highs above $414 in December 2024 - a massive 252% rise.
If you observe the Range Tool on the chart, you’ll notice a pattern - bearish phases take longer, while bullish rallies happen faster.
A question here arises: Was this rally sustainable above previous highs?
🔘 The Quick Fall
In January 2025, the stock saw a sharp fall from $488, wiping out 78% of the previous rally.
Interestingly, this decline didn’t stop at a typical breakout retest level - instead, it halted exactly at the POC of the prior bullish rally and began consolidating there.
Since then, the stock has climbed back near its previous highs.
But note this - the January 2025 fall lasted only 16 weeks, while the recovery has taken over 25 weeks without new highs, suggesting a slight loss of upside momentum compared to earlier rallies (early 2023 and late 2024)
🔘 What to Watch Next
If TSLA pulls back again in the future, we can draw a new Volume Profile over the latest bullish leg to locate its POC (I have drawn till the current high of the rally)
That level could once again serve as a potential fair value area and possibly repeat the same price behavior we’ve seen before.
What is your thought on point of control as a tool for investment purpose?
Share your views and hit the boost for more educational posts in future.
📣Disclaimer:
Everything shared here is meant for education and general awareness only. It’s not financial advice, nor a recommendation to buy, sell, or hold any asset. Do your own research, manage your risk, and make sure you understand what you’re getting into.
Your money, your responsibility; and if you’re unsure, ask a qualified financial professional. (Or at least run it by your pet - they’re great listeners 🐶).