VIRTUAL PREDICTION My prediction of virtual in upcomming days.
1,46 dollar level to watch, downtrend is almost at his end. First bullish wave has been created for short term.

VIRTUALUSDT.P LONGLet price retest our entry level with bullish candle and strong volume. we are in this trade.
Please guys keep following me its just a small gesture from your side that you like my work.
Keep supporting me guys.. I will keep posting my analysis here.

Virtualusdt long to $1.1350Recently opened a long position on virtual usdt
sl: 1.0883 or lower
Tp: 1.133 area
Roughly 1.5 RR

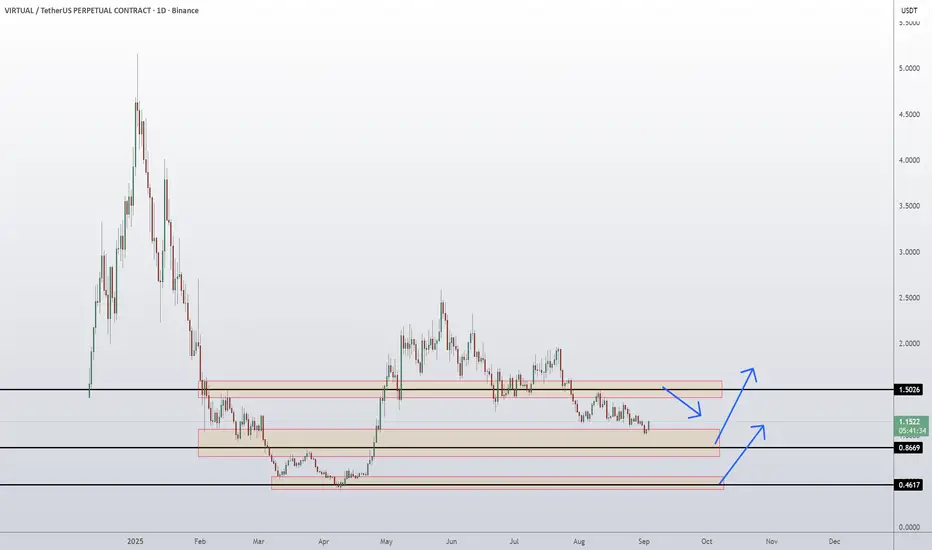
Virtuals Protocol Coin Price Prediction and Technical AnalysisVIRTUAL/USDT has been in a prolonged downtrend but is now consolidating between key support and resistance zones. Price is holding above the 0.8669 support and attempting to stabilize, with the 0.4617 level acting as a deeper safety net if selling pressure extends. On the upside, the immediate chall
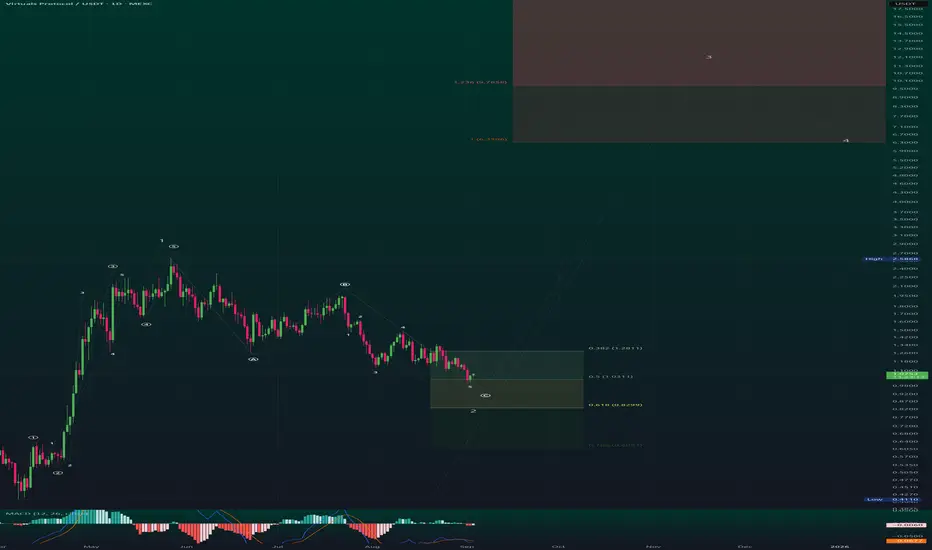
VIRTUAL/USDT — Elliott Wave + Fibonacci Roadmap (1D)
# Virtuals Protocol / USDT (MEXC) — Daily
## Bullish divergence at Wave ⑤ of C into the 0.5–0.786 pocket → building a 1–2 base for upside (targets 6.33 / 9.79 / 19.80)
**Timeframe:** 1D | **Exchange:** MEXC
### Summary
* Daily **A–B–C** correction looks **complete/near-complete**: sub-wa

VIRTUAL Daily Market Update📉 SPARKS:VIRTUAL Daily Market Update
SPARKS:VIRTUAL is currently testing the black support line 🔵
If this level breaks down, price could drop by around 22%, targeting the blue support zone 🟦
⚠️ At this stage, it does not look good to enter long yet.
The safer play would be to wait for:
Possib

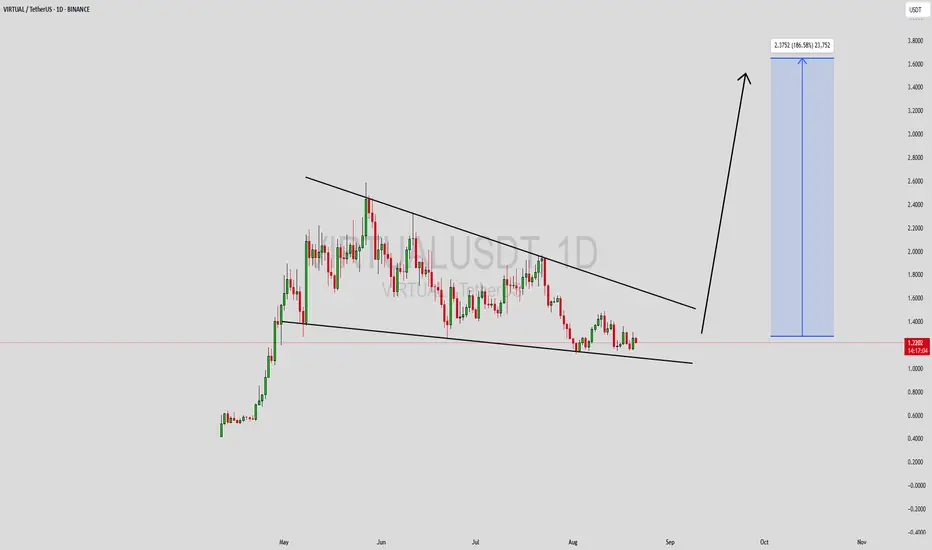
VIRTUALUSDT Forming Falling WedgeVIRTUALUSDT is currently forming a falling wedge pattern, which is widely recognized as a bullish reversal setup. After a period of steady decline, the price action is tightening within the wedge, suggesting that selling pressure is fading and buyers are gradually preparing to regain control. A conf
$VIRTUAL BULLISH BAT PATTERN. Price is hovering on the critical support zone. If the price manages to hold this level, this could be a fantastic entry.
IMO 40% chance that this will play out.

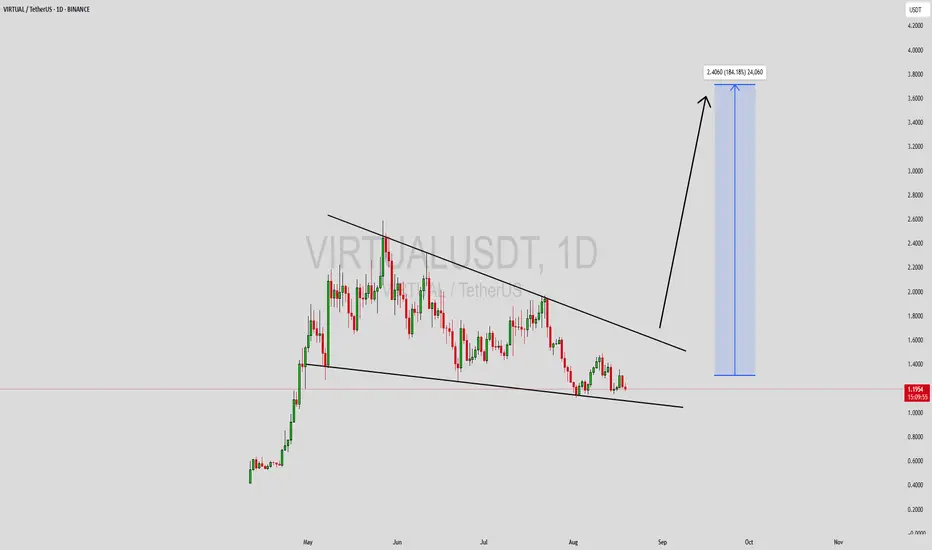
VIRTUALUSDT Forming Falling WedgeVIRTUALUSDT is currently exhibiting a classic falling wedge pattern, a well-known bullish reversal setup that often precedes a strong upside breakout. This pattern forms when the price action contracts within two downward-sloping trendlines, reflecting temporary selling pressure that tends to weaken
See all ideas
Summarizing what the indicators are suggesting.
Oscillators
Neutral
SellBuy
Strong sellStrong buy
Strong sellSellNeutralBuyStrong buy
Oscillators
Neutral
SellBuy
Strong sellStrong buy
Strong sellSellNeutralBuyStrong buy
Summary
Neutral
SellBuy
Strong sellStrong buy
Strong sellSellNeutralBuyStrong buy
Summary
Neutral
SellBuy
Strong sellStrong buy
Strong sellSellNeutralBuyStrong buy
Summary
Neutral
SellBuy
Strong sellStrong buy
Strong sellSellNeutralBuyStrong buy
Moving Averages
Neutral
SellBuy
Strong sellStrong buy
Strong sellSellNeutralBuyStrong buy
Moving Averages
Neutral
SellBuy
Strong sellStrong buy
Strong sellSellNeutralBuyStrong buy
Displays a symbol's price movements over previous years to identify recurring trends.