BTCUSD confirms uptrend to 95K, new buyers & volumes upSo, we had news of USA & Venezuela escalations of force only 36 hours ago, approx.
Its tension thats been building for months and it's this buildup of military momentum that leads to the action that the USA has taken.
For someone like me who does not watch much mainstream news, but
I need to know
About Volatility S&P 500 Index
VIX is the trademarked ticker symbol for the CBOE Volatility Index, a popular measure of the implied market volatility of S&P 500 index options. The VIX index has been calculated by the Chicago Board Options Exchange (CBOE) since 1993.
It is often referred to as the fear index or the fear gauge. The VIX projects a range of the expected stock market volatility over the next 30-day period. It is used by traders, institutional investors, and hedge fund managers to diversify portfolios and correlate returns.
It is often referred to as the fear index or the fear gauge. The VIX projects a range of the expected stock market volatility over the next 30-day period. It is used by traders, institutional investors, and hedge fund managers to diversify portfolios and correlate returns.
Related indices

Fiery Wedge Pattern of 2026A decisive breakout above the falling wedge pattern on the VIX daily chart signals a sharp resurgence in market fear and expected volatility.
This technical move projects an initial upside target toward the 39 level, with a secondary objective near 62.
The market's focus is mainly on the U.S. e

Vix almost in the zone for correctionsIn a week or two, most leading stocks should make new highs, providing liquidity for smart money. The timing between the last two correction peaks is pretty close too.

Currency Adventure AwaitsNavigating the Dynamic World of Global Currencies
Introduction
The phrase “Currency Adventure Awaits” captures the idea that the global currency landscape is no longer static or predictable. Instead, it is an evolving ecosystem shaped by economic cycles, geopolitical shifts, technological innovatio

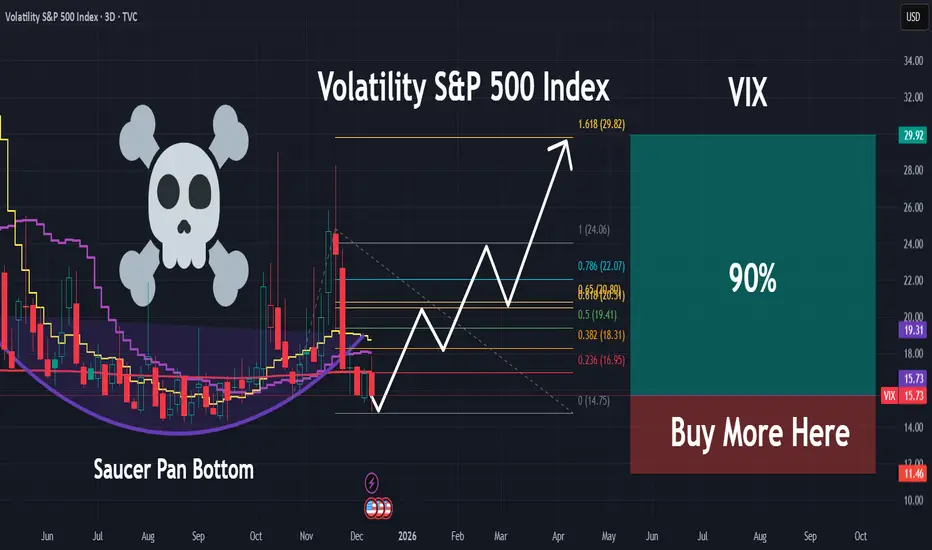
VIX: Fear vs Correction principleBased on principle, where highest probability is when:
-(SPX) 50/200 UP sloping.
-Full correction
-Positive "context" (fundamentals, that change every year. For instance next year theme is new FED chair. Beginning of QE money printing etc).
Some times SPX drops and VIX flies on "fear". but strong t

Global Soft Commodity Trading: Dynamics and StrategiesUnderstanding the Global Soft Commodity Market
Soft commodity markets operate on a global scale, with production concentrated in specific regions and consumption spread worldwide. For example, coffee production is dominated by Brazil, Vietnam, and Colombia, while cocoa largely comes from West Afric
VIX Weekly: Bearish Engulfment Suggests Continued ComplacencyContext: The recent large Bearish Engulfment (highlighted in the orange box) followed by consecutive Bearish candles with shrinking bodies suggests that market participants expect continued low volatility in the near term. This price action reflects a period of increasing market complacency.
Expect

Update at 11ammarket looks like it wants to drop further and Vix is still consolidating. Bulls need to be cautious.

VIX | Major Volatility and Market Correction Incoming | LONGThe VIX Index, formally known as the Cboe Volatility Index, is a real-time market index that represents the market's expectation of 30-day forward-looking volatility for the S&P 500 index. It is widely known as the "fear gauge" because it tends to rise sharply during periods of increased investor fe
Vix is trapped under heavy resistanceIt’s looking like a bounce in equities may emerge, VIX has had its bounce.

See all ideas
Summarizing what the indicators are suggesting.
Oscillators
Neutral
SellBuy
Strong sellStrong buy
Strong sellSellNeutralBuyStrong buy
Oscillators
Neutral
SellBuy
Strong sellStrong buy
Strong sellSellNeutralBuyStrong buy
Summary
Neutral
SellBuy
Strong sellStrong buy
Strong sellSellNeutralBuyStrong buy
Summary
Neutral
SellBuy
Strong sellStrong buy
Strong sellSellNeutralBuyStrong buy
Summary
Neutral
SellBuy
Strong sellStrong buy
Strong sellSellNeutralBuyStrong buy
Moving Averages
Neutral
SellBuy
Strong sellStrong buy
Strong sellSellNeutralBuyStrong buy
Moving Averages
Neutral
SellBuy
Strong sellStrong buy
Strong sellSellNeutralBuyStrong buy
Displays a symbol's value movements over previous years to identify recurring trends.
Frequently Asked Questions
The current value of Volatility S&P 500 Index is 14.74 USD — it has fallen by −1.14% in the past 24 hours. Track the index more closely on the Volatility S&P 500 Index chart.
Volatility S&P 500 Index reached its highest quote on Oct 23, 2008 — 96.40 USD. See more data on the Volatility S&P 500 Index chart.
The lowest ever quote of Volatility S&P 500 Index is 8.56 USD. It was reached on Nov 24, 2017. See more data on the Volatility S&P 500 Index chart.
Volatility S&P 500 Index value has increased by 2.15% in the past week, since last month it has shown a −5.39% decrease, and over the year it's decreased by −12.10%. Keep track of all changes on the Volatility S&P 500 Index chart.
Volatility S&P 500 Index is just a number that lets you track performance of the instruments comprising the index, so you can't invest in it directly. But you can buy Volatility S&P 500 Index futures or funds or invest in its components.