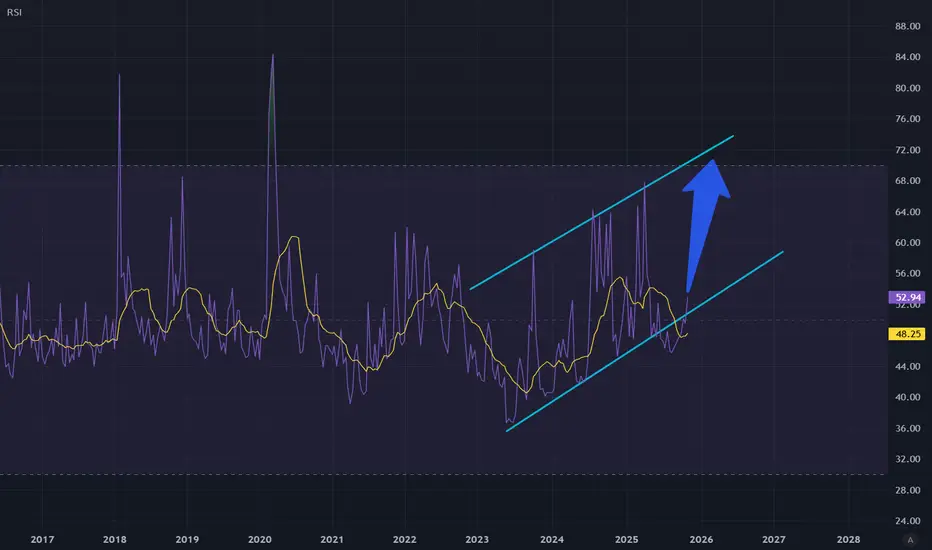
VIX set to explode again!The last few days of selling in the markets have been intense (especially crypto), but I fear the intensity has only just begun!
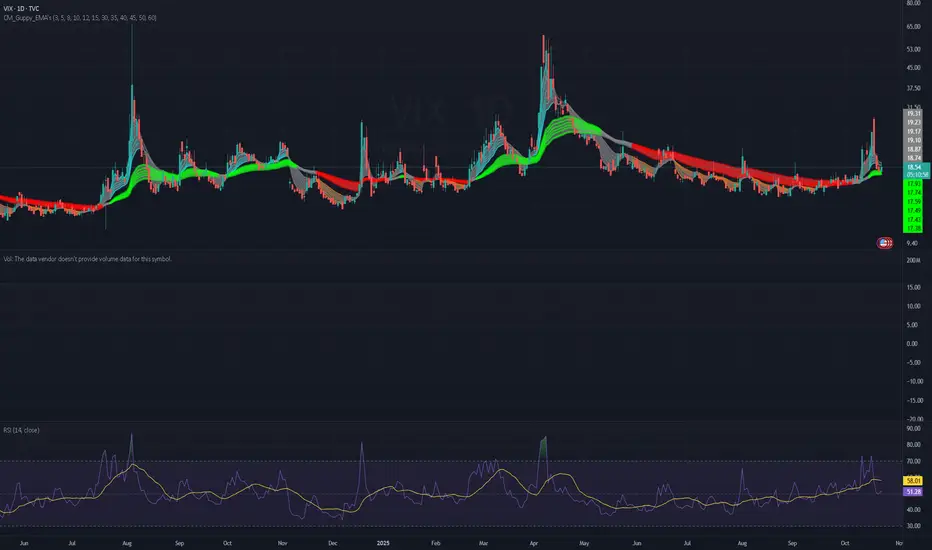
If we look at the structure of VIX over the entire bull run that began in late 2022 with the mass release of generative AI, we see something peculiar with VIX RSI.
It
About Volatility S&P 500 Index
VIX is the trademarked ticker symbol for the CBOE Volatility Index, a popular measure of the implied market volatility of S&P 500 index options. The VIX index has been calculated by the Chicago Board Options Exchange (CBOE) since 1993.
It is often referred to as the fear index or the fear gauge. The VIX projects a range of the expected stock market volatility over the next 30-day period. It is used by traders, institutional investors, and hedge fund managers to diversify portfolios and correlate returns.
It is often referred to as the fear index or the fear gauge. The VIX projects a range of the expected stock market volatility over the next 30-day period. It is used by traders, institutional investors, and hedge fund managers to diversify portfolios and correlate returns.
Related indices
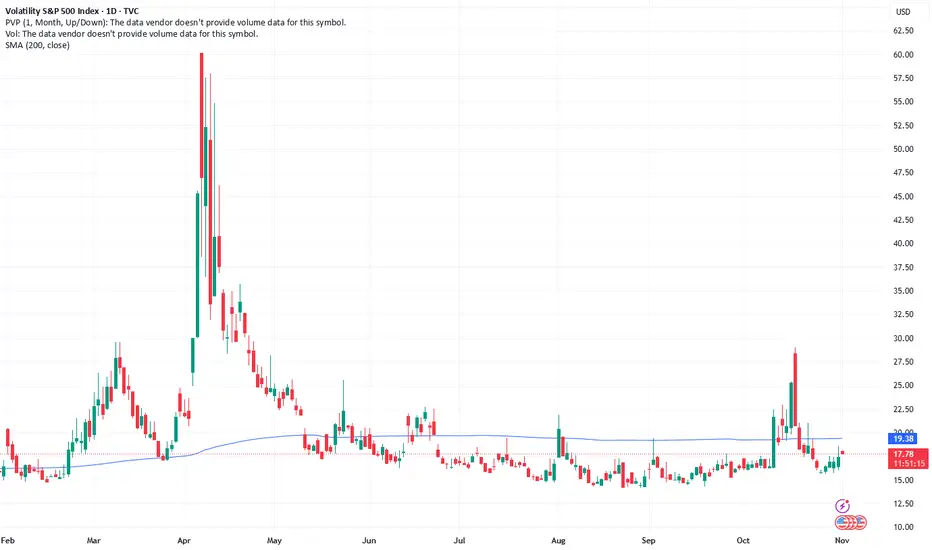
$VIX: IT IS BASING While it's debatable if we can consider an IHS, it certainly appears to be consolidating for an upswing.

VIX is telling you.....It's sometimes really simple.
And simple is powerfull.
When the VIX. just like a stock,
creates higher lows after higher lows
for at certain amount of X time/months,
sooner or later we get the explosion of the VIX.
Looking at a currently very overpriced stockmarket
right now, you don't need to be a

VIXSam Altman’s OpenAI strategy feels like “Trust me, bro” economics — promising to invest $1.4 trillion while making only $13 billion in revenue.
That’s not innovation — that’s speculation. When markets chase dreams instead of profits, they inflate bubbles. And every bubble bursts the same way: confi
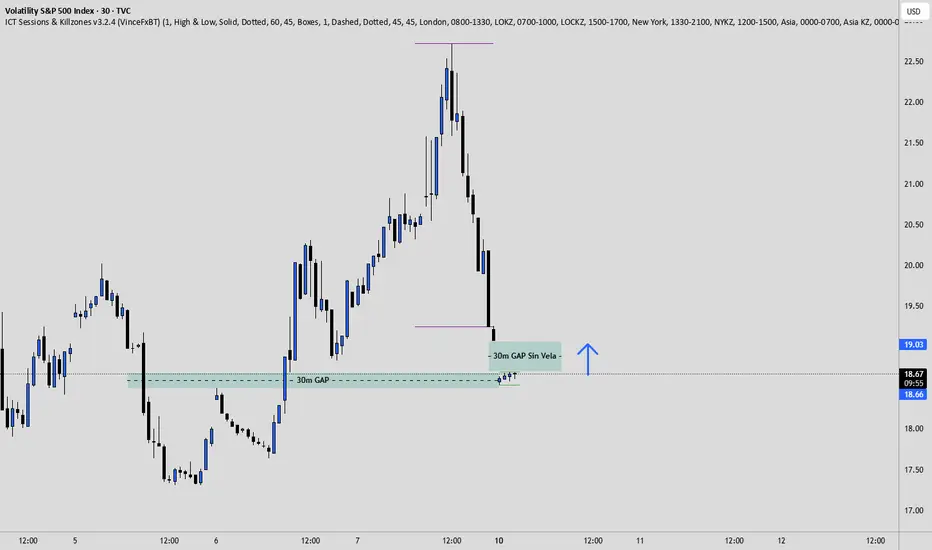
VIX Bullish - What does this mean for our NQ (NAS100) Short?Elite Analysis
Chart Context: VIX 30m
Price just tapped into a 30-minute gap (FVG) and reacted cleanly.
That gap (marked in green) is acting as a demand zone for volatility.
Each time the VIX bounces from a demand/FVG zone like this → volatility increases → equities (SPX, NASDAQ, US30) tend to d

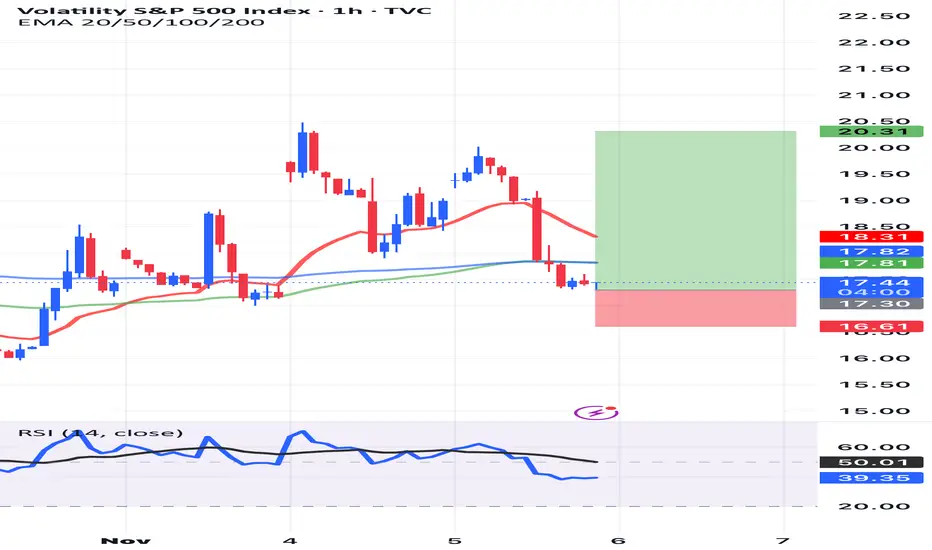
VIX Breakout Potential as Volatility Remains Elevated Current Price: $17.44
Direction: LONG
Targets:
- T1 = $19.75
- T2 = $21.50
Stop Levels:
- S1 = $16.50
- S2 = $15.75
**Wisdom of Professional Traders:**
This analysis synthesizes insights from thousands of professional traders who emphasize vigilance in volatility-based trades.
Market is awfully bullishThe market in general is very bullish with many indices moving up higher and higher, but the price of gold has also been moving up higher which historically this doesn't end well. This could also mean that many allocation models have funds and liquidity being put into them. The bullish momentum can

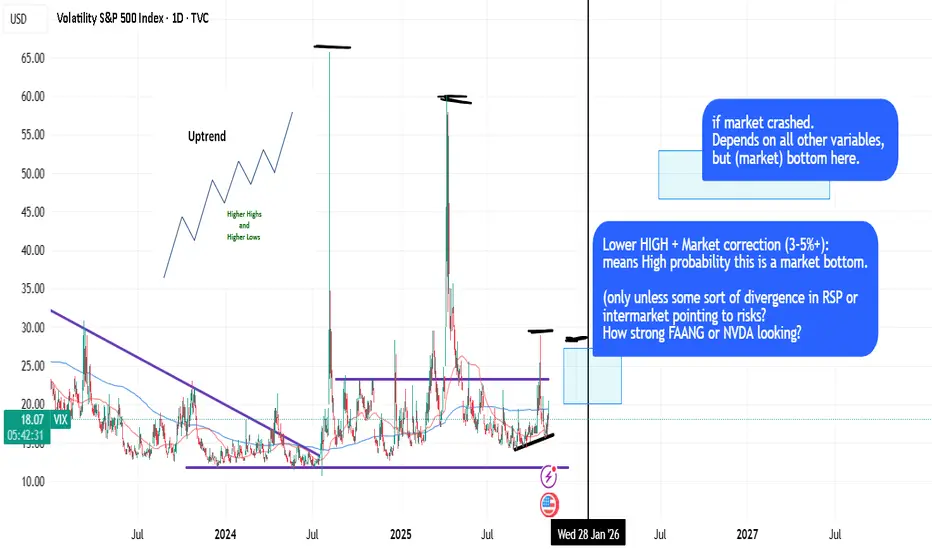
Using HLOW/LHIGH (Dow) + LOGIC to pinpoint probabilities.DOW Theory is the king of the stock market (Higher Lows, Lower Highs, uptrending, etc.) and it's quite basic concept to apply with logic.
Sometimes you can time the market (based on 50dma/200dma crosses, price extensions) and LHIGH dynamics and logic -> to pinpoint probabilities. Like, look at VIX
VIX breakout ? (aka SPY breakdown ?)Observations (not recommendations):
- Market looks toppish here
- everyone in "wait and see" mode, but wait what to the upside ?
- flip-side: any negative news could trigger next hiccup.
- VIX just touched support and bounced up.
Actions:
- Bought some VXX and TAIL on short leashes (tight stops).
See all ideas
Summarizing what the indicators are suggesting.
Oscillators
Neutral
SellBuy
Strong sellStrong buy
Strong sellSellNeutralBuyStrong buy
Oscillators
Neutral
SellBuy
Strong sellStrong buy
Strong sellSellNeutralBuyStrong buy
Summary
Neutral
SellBuy
Strong sellStrong buy
Strong sellSellNeutralBuyStrong buy
Summary
Neutral
SellBuy
Strong sellStrong buy
Strong sellSellNeutralBuyStrong buy
Summary
Neutral
SellBuy
Strong sellStrong buy
Strong sellSellNeutralBuyStrong buy
Moving Averages
Neutral
SellBuy
Strong sellStrong buy
Strong sellSellNeutralBuyStrong buy
Moving Averages
Neutral
SellBuy
Strong sellStrong buy
Strong sellSellNeutralBuyStrong buy
Displays a symbol's price movements over previous years to identify recurring trends.
Frequently Asked Questions
The current value of Volatility S&P 500 Index is 17.79 USD — it has fallen by −1.78% in the past 24 hours. Track the index more closely on the Volatility S&P 500 Index chart.
Volatility S&P 500 Index reached its highest quote on Oct 23, 2008 — 96.40 USD. See more data on the Volatility S&P 500 Index chart.
The lowest ever quote of Volatility S&P 500 Index is 8.56 USD. It was reached on Nov 24, 2017. See more data on the Volatility S&P 500 Index chart.
Volatility S&P 500 Index value has increased by 3.77% in the past week, since last month it has shown a 14.55% increase, and over the year it's increased by 17.58%. Keep track of all changes on the Volatility S&P 500 Index chart.
Volatility S&P 500 Index is just a number that lets you track performance of the instruments comprising the index, so you can't invest in it directly. But you can buy Volatility S&P 500 Index futures or funds or invest in its components.