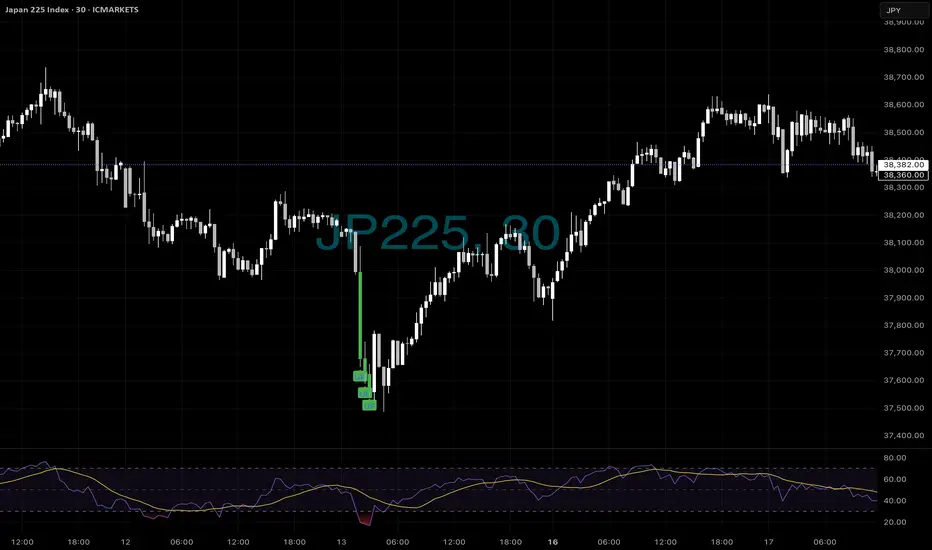
More Moves - all markets📈 JP225 – Picture Perfect Reversal from the Lows
Just as Japan’s Nikkei dropped into fresh lows, our ELFIEDT Reversion indicator printed 3 stacked UP signals — precisely at the bottom.
🎯 No lag. No hindsight. Just real-time alerts backed by smart RSI divergence logic and volatility compression.
You’ll notice:
🔹 Price swept previous lows
🔹 RSI formed classic hidden bullish divergence
🔹 The indicator fired before the recovery even began
This is what timing looks like in a sideways or fast-reverting market.
Whether you’re trading indices, crypto, commodities or FX — the logic holds across all assets.
✅ If you want to stop guessing the bottom…
✅ And start buying fear when the edge is there…
📩 DM us.
We’ll show you how to catch these turns across any market, any timeframe, any style.
⸻
#JP225 #Nikkei #Japan225 #ReversionTrading #ELFIEDT #RSIDivergence #SmartMoneyMoves #BuyTheDip #ReversalStrategy #TechnicalEdge #TradingJapan #IndicatorBasedTrading #XReversion #MarketTiming
Trade ideas
Nikkei 225 stays bullish as Japan embraces AIWhile most traders have been focused on AI's impact on Western economies, Japan has been quietly chipping away at its own AI revolution. Not by building the flashiest tools, but by embedding AI into the guts of its economy.
Let's start with the obvious. Japan is an industrial giant. Toyota, Fanuc, Sony. These companies aren’t chasing fads. They’re integrating AI into factories, supply chains, and robotics. Not hype but rather real productivity.
The government gets it too. “Society 5.0” isn’t just a slogan. It’s a structural policy push. R&D spending is north of 3% of GDP. That’s capital well spent.
Now the deeper point, demographics. Japan’s working-age population is shrinking. That’s no longer a headwind. It’s fuel. AI offsets labour shortages. Healthcare, logistics, transport. These sectors are being rewired, not disrupted. They’re evolving, and profits will follow.
Then there’s valuation. The Nikkei 225 is still attractive with a forward P/E of around 14x, while the S&P trades above 22x. Yet Japanese firms are global leaders in high-value, AI-relevant sectors. That gap will close.
This is structural, it’s not about today’s trade. It’s about where capital flows over the next five years.
Japan’s quiet, calculated AI pivot is the most underpriced transformation in global markets.
Stay long Nikkei, we expect the 200-day moving average to hold. The re-rating is only beginning.
The forecasts provided herein are intended for informational purposes only and should not be construed as guarantees of future performance. This is an example only to enhance a consumer's understanding of the strategy being described above and is not to be taken as Blueberry Markets providing personal advice.

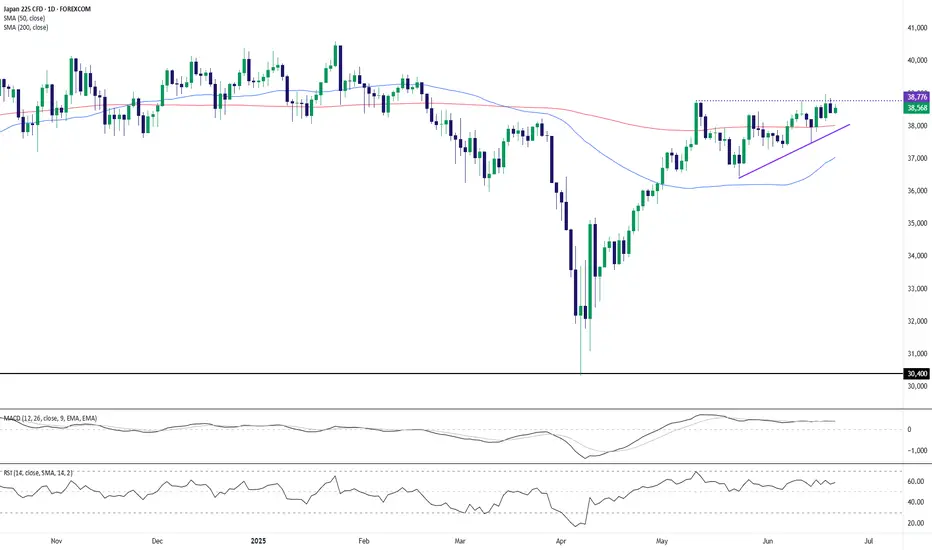
Nikkei 225 Coiling in Ascending Triangle – Breakout Imminent?The Japan 225 (Nikkei) is consolidating just beneath a major resistance level around 38,776, forming a classic ascending triangle pattern. Price has been compressing into higher lows while repeatedly testing the horizontal ceiling, hinting at a potential bullish breakout.
Key Technical Observations:
Pattern Structure: The ascending triangle, defined by rising trendline support and horizontal resistance, suggests bullish pressure is building.
Moving Averages: Price trades above both the 50-day and 200-day SMAs, reinforcing the medium-term bullish trend.
MACD: Remains flat but in positive territory, indicating underlying strength even amid consolidation.
RSI: At 58.7, RSI is neutral to bullish, showing room for further upside before entering overbought territory.
A confirmed breakout above the 38,776 resistance would validate the ascending triangle and potentially trigger a fresh bullish leg. Conversely, a break below the rising trendline would invalidate the pattern and suggest deeper consolidation or correction.
This setup favors bulls as long as the higher lows remain intact. A decisive daily close above resistance could accelerate momentum toward new highs.
-MW
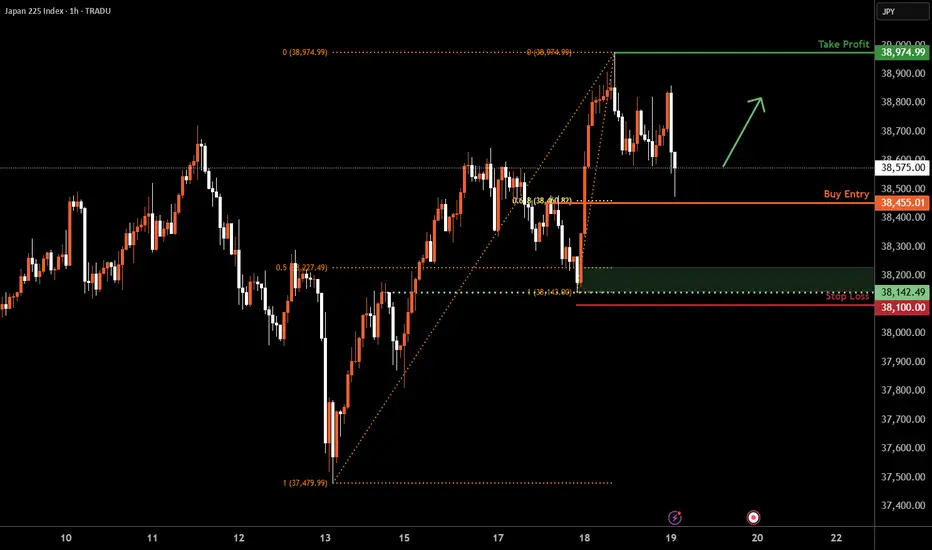
Nikkei 225 H1 | Pullback support at 61.8% Fibonacci retracementThe Nikkei 225 (JPN225) is falling towards a pullback support and could potentially bounce off this level to climb higher.
Buy entry is at 38,455.01 which is a pullback support that aligns with the 61.8% Fibonacci retracement.
Stop loss is at 38,100.00 which is a level that lies underneath an overlap support and the 50% Fibonacci retracement.
Take profit is at 38,974.99 which is a swing-high resistance.
High Risk Investment Warning
Trading Forex/CFDs on margin carries a high level of risk and may not be suitable for all investors. Leverage can work against you.
Stratos Markets Limited (tradu.com ):
CFDs are complex instruments and come with a high risk of losing money rapidly due to leverage. 63% of retail investor accounts lose money when trading CFDs with this provider. You should consider whether you understand how CFDs work and whether you can afford to take the high risk of losing your money.
Stratos Europe Ltd (tradu.com ):
CFDs are complex instruments and come with a high risk of losing money rapidly due to leverage. 63% of retail investor accounts lose money when trading CFDs with this provider. You should consider whether you understand how CFDs work and whether you can afford to take the high risk of losing your money.
Stratos Global LLC (tradu.com ):
Losses can exceed deposits.
Please be advised that the information presented on TradingView is provided to Tradu (‘Company’, ‘we’) by a third-party provider (‘TFA Global Pte Ltd’). Please be reminded that you are solely responsible for the trading decisions on your account. There is a very high degree of risk involved in trading. Any information and/or content is intended entirely for research, educational and informational purposes only and does not constitute investment or consultation advice or investment strategy. The information is not tailored to the investment needs of any specific person and therefore does not involve a consideration of any of the investment objectives, financial situation or needs of any viewer that may receive it. Kindly also note that past performance is not a reliable indicator of future results. Actual results may differ materially from those anticipated in forward-looking or past performance statements. We assume no liability as to the accuracy or completeness of any of the information and/or content provided herein and the Company cannot be held responsible for any omission, mistake nor for any loss or damage including without limitation to any loss of profit which may arise from reliance on any information supplied by TFA Global Pte Ltd.
The speaker(s) is neither an employee, agent nor representative of Tradu and is therefore acting independently. The opinions given are their own, constitute general market commentary, and do not constitute the opinion or advice of Tradu or any form of personal or investment advice. Tradu neither endorses nor guarantees offerings of third-party speakers, nor is Tradu responsible for the content, veracity or opinions of third-party speakers, presenters or participants.
Nikkei 225 looking at a strong break to the upsideNikkei 225 is likely eyeing a strong bullish break to the upside after 38,200 resistance was tested multiple times. We believe that the japanese index is likely targeting 40,200 in the mid-term.

Nikkei 225 H1 | Swing-high resistance at 61.8% Fibo retracementThe Nikkei 225 (JPN225) is rising towards a swing-high resistance and could potentially reverse off this level to drop lower.
Sell entry is at 38,245.01 which is a swing-high resistance that aligns with the 61.8% Fibonacci retracement.
Stop loss is at 38,500.00 which is a level that sits above the 78.6% Fibonacci retracement and a pullback resistance.
Take profit is at 37,855.58 which is an overlap support.
High Risk Investment Warning
Trading Forex/CFDs on margin carries a high level of risk and may not be suitable for all investors. Leverage can work against you.
Stratos Markets Limited (tradu.com ):
CFDs are complex instruments and come with a high risk of losing money rapidly due to leverage. 63% of retail investor accounts lose money when trading CFDs with this provider. You should consider whether you understand how CFDs work and whether you can afford to take the high risk of losing your money.
Stratos Europe Ltd (tradu.com ):
CFDs are complex instruments and come with a high risk of losing money rapidly due to leverage. 63% of retail investor accounts lose money when trading CFDs with this provider. You should consider whether you understand how CFDs work and whether you can afford to take the high risk of losing your money.
Stratos Global LLC (tradu.com ):
Losses can exceed deposits.
Please be advised that the information presented on TradingView is provided to Tradu (‘Company’, ‘we’) by a third-party provider (‘TFA Global Pte Ltd’). Please be reminded that you are solely responsible for the trading decisions on your account. There is a very high degree of risk involved in trading. Any information and/or content is intended entirely for research, educational and informational purposes only and does not constitute investment or consultation advice or investment strategy. The information is not tailored to the investment needs of any specific person and therefore does not involve a consideration of any of the investment objectives, financial situation or needs of any viewer that may receive it. Kindly also note that past performance is not a reliable indicator of future results. Actual results may differ materially from those anticipated in forward-looking or past performance statements. We assume no liability as to the accuracy or completeness of any of the information and/or content provided herein and the Company cannot be held responsible for any omission, mistake nor for any loss or damage including without limitation to any loss of profit which may arise from reliance on any information supplied by TFA Global Pte Ltd.
The speaker(s) is neither an employee, agent nor representative of Tradu and is therefore acting independently. The opinions given are their own, constitute general market commentary, and do not constitute the opinion or advice of Tradu or any form of personal or investment advice. Tradu neither endorses nor guarantees offerings of third-party speakers, nor is Tradu responsible for the content, veracity or opinions of third-party speakers, presenters or participants.

Nikkei 225. Tokyo Open Delivery cause of Geopolitical DriversSharing my Tokyo Open model for the daily expansion on Nikkei. Along with Intraday market profiles. And Quarterly Theory

12.06.25 Morning ForecastPairs on Watch -
OANDA:JP225USD
FX:AUDJPY
FX:USDJPY
FX:GBPJPY
A short overview of the instruments I am looking at for today, multi-timeframe analysis down to what I will be looking at for an entry. Enjoy!

Nikkei 225 Wave Analysis – 11 June 2025
- Nikkei 225 broke the resistance area
- Likely to rise to the resistance level 39500.00
The Nikkei 225 index recently broke the resistance area lying at the intersection of the resistance level 38340.00 (top of wave A from the end of May) and the resistance trendline from January.
The breakout of this resistance area accelerated the C-wave of the active ABC correction (2) from last month.
The Nikkei 225 index can be expected to rise to the next resistance level 39500.00 (a former monthly high from February).

Asian markets peaked today, and are up for multi month declinePeak in Asian markets today, together with Germany yesterday and US, the whole world will be selling equities upcoming months with such bad trade and job perspectives.

NIKKEI 1W forecast until end of July 2025Broadening wedge formation on the table - a lot of sideways movement within the range of 38,758 and 36,607
Upward momentum will last for a couple of weeks more. The most likely top is 38,758
Starting from second half of June 2025 we may see a start of correction strong, but healthy. Correction/rest bottom is expected in mid July at 37,075 and should not fall deeper than 36,607
Second half of July the index would probably try to climb up to 58,758 with doubtful success.

Japan market - are you LONG or SHORT ?I noticed this interesting trend -
The breakout from the resistance took a shorter time compared to the first wave in 2018 which took 4 years! Another interesting thing to note is the explosive rally after it breaks out each time. See how strong it rally each time without fail !
Then, it is followed by volatile movements of sideway movements which to the delight of some short term traders or scalpers who trade by the minute.
For now, I will wait for it to come closer to the 40k mark first. We could see it attempted to break above several times in 2024 but without success. Daily chart shows it might retraced over the next few weeks...........or I could be wrong........
Like to hear your views if you are LONG on this index as well.

Nikkei 225 Wave Analysis – 27 May 2025
- Nikkei 225 reversed from support level 36675,00
- Likely to rise to resistance level 38800,00
Nikkei 225 index recently reversed up from the pivotal support level 36675,00 (which formed the daily Japanese candlesticks reversal pattern Morning Star at the start of May).
The support level 36675,00 strengthened by the 20-day moving average and by the 38.21% Fibonacci correction of the previous upward impulse from April.
Nikkei 225 index can be expected to rise to the next resistance level 38800,00, top of the previous minor correction 2.

Nikkei H4 | Falling toward a multi-swing-low supportNikkei (JPN225) is falling towards a multi-swing-low support and could potentially bounce off this level to climb higher.
Buy entry is at 36,688.39 which is a multi-swing-low support that aligns with the 23.6% Fibonacci retracement.
Stop loss is at 35,300.00 which is a level that lies underneath an overlap support and the 38.2% Fibonacci retracement.
Take profit is at 38,831.79 which is a swing-high resistance.
High Risk Investment Warning
Trading Forex/CFDs on margin carries a high level of risk and may not be suitable for all investors. Leverage can work against you.
Stratos Markets Limited (tradu.com ):
CFDs are complex instruments and come with a high risk of losing money rapidly due to leverage. 63% of retail investor accounts lose money when trading CFDs with this provider. You should consider whether you understand how CFDs work and whether you can afford to take the high risk of losing your money.
Stratos Europe Ltd (tradu.com ):
CFDs are complex instruments and come with a high risk of losing money rapidly due to leverage. 63% of retail investor accounts lose money when trading CFDs with this provider. You should consider whether you understand how CFDs work and whether you can afford to take the high risk of losing your money.
Stratos Global LLC (tradu.com ):
Losses can exceed deposits.
Please be advised that the information presented on TradingView is provided to Tradu (‘Company’, ‘we’) by a third-party provider (‘TFA Global Pte Ltd’). Please be reminded that you are solely responsible for the trading decisions on your account. There is a very high degree of risk involved in trading. Any information and/or content is intended entirely for research, educational and informational purposes only and does not constitute investment or consultation advice or investment strategy. The information is not tailored to the investment needs of any specific person and therefore does not involve a consideration of any of the investment objectives, financial situation or needs of any viewer that may receive it. Kindly also note that past performance is not a reliable indicator of future results. Actual results may differ materially from those anticipated in forward-looking or past performance statements. We assume no liability as to the accuracy or completeness of any of the information and/or content provided herein and the Company cannot be held responsible for any omission, mistake nor for any loss or damage including without limitation to any loss of profit which may arise from reliance on any information supplied by TFA Global Pte Ltd.
The speaker(s) is neither an employee, agent nor representative of Tradu and is therefore acting independently. The opinions given are their own, constitute general market commentary, and do not constitute the opinion or advice of Tradu or any form of personal or investment advice. Tradu neither endorses nor guarantees offerings of third-party speakers, nor is Tradu responsible for the content, veracity or opinions of third-party speakers, presenters or participants.

Japanese Shark Pattern Spotted!Based on the harmonic shark pattern & 0.88 Fibonacci level,
there's a Chance of a Dive from 37.8k towards Deeper targets.
📉 Stay tuned for updates!

"JP225 / NIKKEI" Index CFD Market Heist Plan (Swing/Day Trade)🌟Hi! Hola! Ola! Bonjour! Hallo! Marhaba!🌟
Dear Money Makers & Robbers, 🤑 💰💸✈️
Based on 🔥Thief Trading style technical and fundamental analysis🔥, here is our master plan to heist the "JP225 / NIKKEI" Index CFD Market. Please adhere to the strategy I've outlined in the chart, which emphasizes long entry. Our aim is to escape near the high-risk ATR Zone. Risky level, overbought market, consolidation, trend reversal, trap at the level where traders and bearish robbers are stronger. 🏆💸"Take profit and treat yourself, traders. You deserve it!💪🏆🎉
Entry 📈 : "The heist is on! Wait for the MA breakout (37300) then make your move - Bullish profits await!"
however I advise to Place Buy stop orders above the Moving average (or) Place buy limit orders within a 15 or 30 minute timeframe most recent or swing, low or high level for Pullback entries.
📌I strongly advise you to set an "alert (Alarm)" on your chart so you can see when the breakout entry occurs.
Stop Loss 🛑: "🔊 Yo, listen up! 🗣️ If you're lookin' to get in on a buy stop order, don't even think about settin' that stop loss till after the breakout 🚀. You feel me? Now, if you're smart, you'll place that stop loss where I told you to 📍, but if you're a rebel, you can put it wherever you like 🤪 - just don't say I didn't warn you ⚠️. You're playin' with fire 🔥, and it's your risk, not mine 👊."
📍 Thief SL placed at the recent/swing low level Using the 4H timeframe (35600) Day trade basis.
📍 SL is based on your risk of the trade, lot size and how many multiple orders you have to take.
🏴☠️Target 🎯: 39300 (or) Escape Before the Target
🧲Scalpers, take note 👀 : only scalp on the Long side. If you have a lot of money, you can go straight away; if not, you can join swing traders and carry out the robbery plan. Use trailing SL to safeguard your money 💰.
💰💵💴💸"JP225 / NIKKEI" Index CFD Market Heist Plan (Day / Swing Trade) is currently experiencing a bullishness🐂.., driven by several key factors.👆👆👆
📰🗞️Get & Read the Fundamental, Macro economics, COT Report, Geopolitical and News Analysis, Sentimental Outlook, Intermarket Analysis, Index-Specific Analysis,Positioning and future trend targets with Overall Score...... go ahead to check👉👉👉🔗🔗🌎🌏🗺
⚠️Trading Alert : News Releases and Position Management 📰 🗞️ 🚫🚏
As a reminder, news releases can have a significant impact on market prices and volatility. To minimize potential losses and protect your running positions,
we recommend the following:
Avoid taking new trades during news releases
Use trailing stop-loss orders to protect your running positions and lock in profits
💖Supporting our robbery plan 💥Hit the Boost Button💥 will enable us to effortlessly make and steal money 💰💵. Boost the strength of our robbery team. Every day in this market make money with ease by using the Thief Trading Style.🏆💪🤝❤️🎉🚀
I'll see you soon with another heist plan, so stay tuned 🤑🐱👤🤗🤩

Inverted Head and Shoulders on the JP225 (NIKKEI)I am so sleepy and this idea kept me up before going to bed, like a lullaby that will give you sweet dreams.
Look at this beautiful Inverted head and shoulders on JP225, what does this mean for the XXXJPY pairs?
Does this mean weakness for the Japanese Yuan?
The first target for this inverted head and shoulders is 43000 and... and... there is a very beautiful Zig-Zag on the right shoulder.

Today On Japan 225 Miss Entry So Today on Japan 225 was almost miss the entry but the P&L wasn't too bad. Leave a comment on your thought. Real Trad Real ACCOUNT. This is not a financial advice. Trading is risky

JP225 19.05.2025~+ JP GDP Miss
~+ Moody's downgrade
~+ BOJ's cautious stance amid tariff uncertainties
+ COT
+ Seasonals

NI225 (Japan 225 Index) – Elliott Wave Update | May 20, 2025The long-term structure of the Nikkei 225 appears to be unfolding in a textbook 5-wave impulsive pattern within a rising channel, consistent with Elliott Wave Theory.
🌀 Wave Structure Breakdown:
🔹 Wave (1): The initial impulsive move from the 2020 COVID lows, marking a clear shift in trend and sentiment.
🔹 Wave (2): A corrective retracement that respected channel support, forming a likely Zigzag or Flat correction, setting the base for Wave (3).
🔹 Wave (3): An extended, powerful rally that reflects strong investor confidence and fundamental recovery. This wave has the steepest angle and highest momentum, as expected.
🔹 Wave (4): A complex corrective phase, likely a running Flat or Triangle, which has held above key structural support at 30,611.57. The lower bound of the channel remained intact.
🔹 Wave (5): Currently in early development. Based on Fibonacci extensions:
1.382 target lies at 46,814.91
1.618 target at 49,563.74
Full extension (Wave 5 = Wave 1) points toward a potential top near 54,013.12
These targets align closely with the upper trendline of the rising channel, suggesting a confluence zone for a possible long-term top.
🔍 Technical Confluence:
The EMA ribbon continues to act as dynamic support and resistance.
Price has bounced strongly from the (4) low, confirming bullish momentum resumption.
42,365.53 may act as a key pivot before continuation toward the 1.382–1.618 extension cluster.
📈 Outlook:
As long as the structure remains within the defined channel and above 30,611.57, the bullish scenario toward 46–49k remains intact. Caution near the projected Fibonacci extensions is warranted for potential exhaustion of Wave (5).
💬 Let me know your thoughts — are we headed toward a generational top in the Nikkei, or will macro headwinds cap the upside?

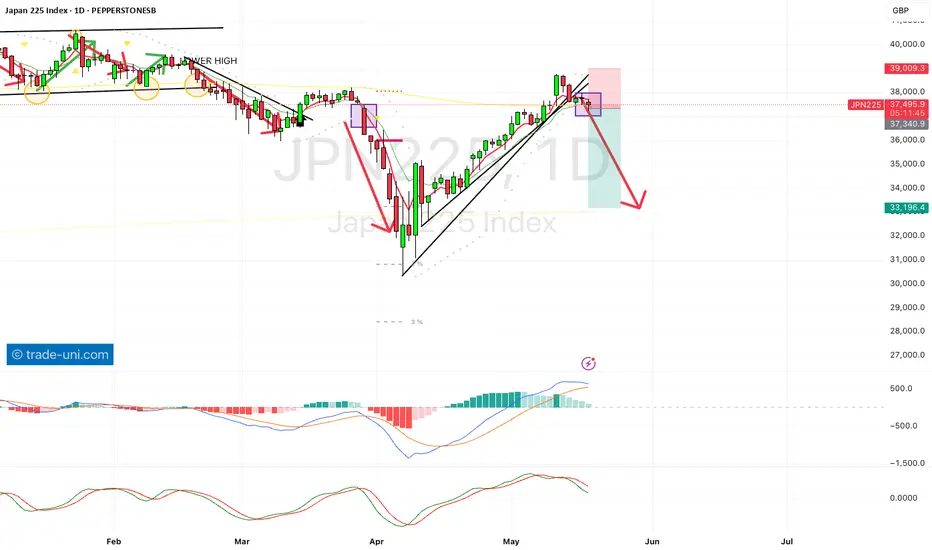
Trade-Uni - SELL NIKKEI We have sold this index based on the daily timeframe at 37493 level, looking for 33000 are over the next 3 months.
Are you shorting the bounce or waiting for confirmation?Japan’s Q1 GDP came in worse than expected: -0.2% QoQ (-0.7% annualized). Weak consumption, soft exports, and a fading external boost despite a weak yen isn't a great combo for Asia’s largest export economy.
The Nikkei 225 reacted immediately, and the H4 chart is starting to reflect deeper structural pressure.
🔍 Technical Outlook:
- Price reversed from the high of 38,745.
- Price is testing the 50 SMA and could enter the Ichimoku cloud.
- The cloud is signalling a twist, which could be a sign of momentum fading and the trend weakening or reversing.
📊 Projection:
If the price closes below the 50 SMA and breaks through the cloud, further downside could be expected, with the target levels at
- 36,800 (last consolidation zone), and
- 35,570 (38.2% fibonacci retracement level and 200 SMA).
Alternatively, if the bulls defend the cloud, we could see the price climb to the resistance level of 40,500
This is a classic macro meets technicals moment. A weak data print is lining up against the possibility of a technical rollover.

UPDATE - Japan Index is now set for upside to 45,172The last analysis, was working like a charm until Trump had to pause the tariffs, and go back on everything he said bit by bit.
So, the analysis has now turned from bearish to bullish - and as traders we adjust our sails accordingly.
There are a few other reasons for the rally to come.
📈 Positive U.S.-China Trade Developments Boost Market Confidence
Recent progress in U.S.-China trade talks has alleviated investor concerns, leading to a 0.4% rise in the Nikkei 225, reflecting renewed optimism in the Japanese stock market.
💰 Significant Foreign Investment Inflows Strengthen the Market
In April 2025, foreign investors injected 3.68 trillion yen into Japanese equities, marking the largest monthly inflow in two years, driven by confidence in Japan's corporate reforms and stable economic outlook.
Reuters
📊 Analysts Forecast Record Highs by End of 2025
A Reuters poll predicts the Nikkei 225 will reach an all-time high of 42,500 by the end of 2025, driven by attractive valuations, corporate reforms, and supportive monetary policies.
So this goes in line with this technical analysis - even though they are completely independent analysis.
Reverse Cup and Handle
Price>20 and 200MA
Target 45,172
Disclosure: I am part of Trade Nation's Influencer program and receive a monthly fee for using their TradingView charts in my analysis.
