Wall Street Tech Rally Resumes | USNAS100 Holds Firm Above 25440USNAS100 – MARKET OUTLOOK | Bullish Bias Above 25440
The Nasdaq continues to trade with bullish momentum after stabilizing above 25440, supported by strength in tech stocks and improving market sentiment.
Above 25440: Bullish continuation toward 25700 → 25820 → 26170 (ATH).
Below 25430: Bearish correction possible toward 25230 → 25000 → 24760.
Pivot: 25440
Support: 25230 · 25000 · 24760
Resistance: 25570 · 25700 · 25820
USNAS100 remains bullish while above 25440, but a confirmed 1H close below 25430 could trigger a short-term bearish correction toward 25230–25000.
Trade ideas

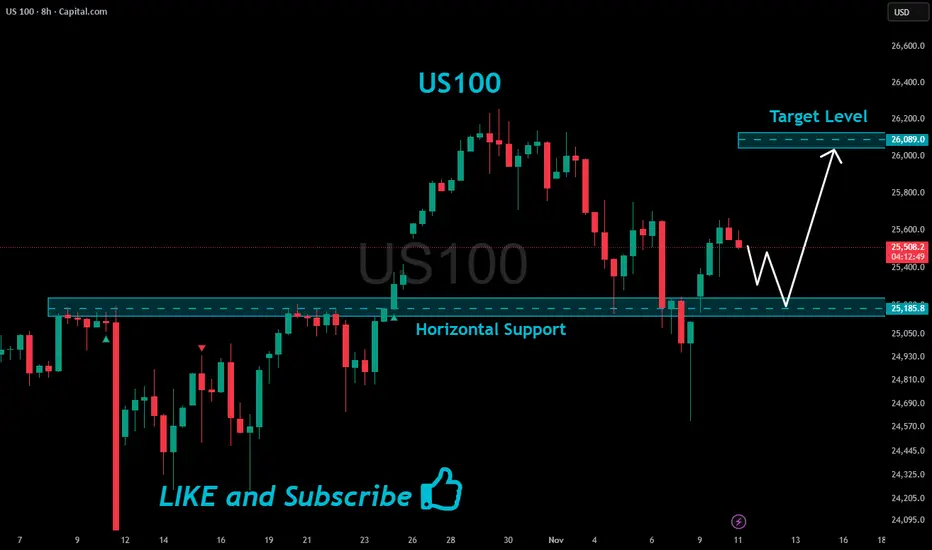
US100 Support Ahead!
HI,Traders !
#US100 is making a local
Bearish correction but
We are bullish biased mid-term
So after the pair hits the horizontal
Support of 25185.8 we will be
Expecting a local bullish rebound !
Comment and subscribe to help us grow !
USNAS1OO Appear Breakout phase, with bullish pressure building.The USNAS100 (NASDAQ 100) appears to be in a consolidation-to-breakout phase, with bullish pressure building.
U.S. stock index futures are advancing on Monday following positive developments in Washington toward ending the U.S. government shutdown the prolonged shutdown had delayed key economic data releases and increased uncertainty over growth. Renewed optimism for resolution has improved risk sentiment, prompting buying momentum in equity futures.
If price sustains above 25,000 and momentum continues, bulls could “shut down” the recent NASDAQ decline by pushing toward 25,750 – 26,005 a strong breakout with volume could trigger further upside toward 26,250–26,500, aligning with the next major resistance zone.
You may find more details in the chart,
Trade wisely best of Luck Buddies.
Ps; Support with like and comments for better analysis Thanks for Supporting.

US100 (NASDAQ 100) – Short TradeSetup Type: Short Position
Entry: Around 25,650 (Resistance zone)
Stop Loss: 25,787
Target: 24,850
Analysis:
Price is retesting a key resistance zone after a strong impulsive move upward. A rejection from this level could indicate the start of a short-term correction. If bearish confirmation appears (e.g., lower high formation or bearish engulfing candle), short positions could be valid toward 24,850 support.
Bias: Bearish below 25,787
Invalidation: Break and close above 25,787
Hashtags:
#US100 #NASDAQ100 #PriceAction #TradingSetup #BearishSetup #TechnicalAnalysis #TradingView #SmartMoney #ShortTrade #Indices

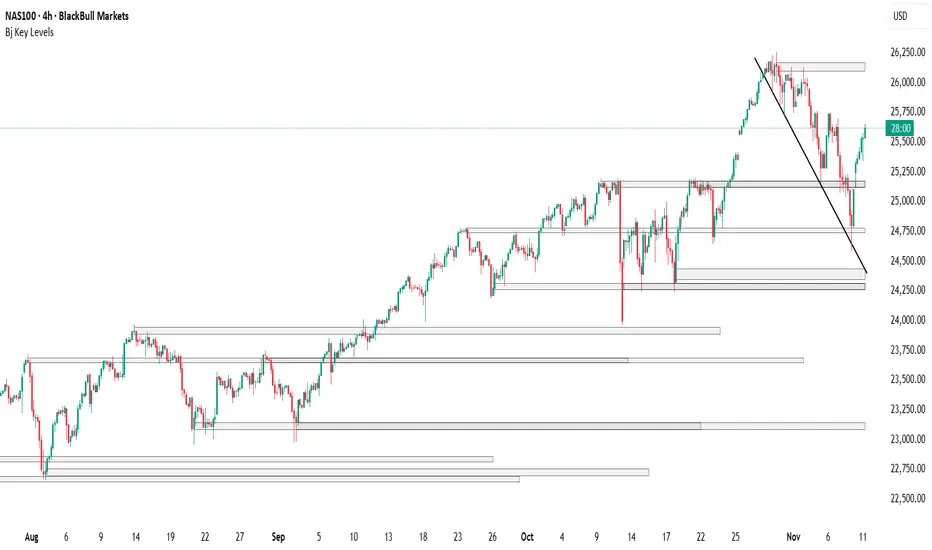
HELPFUL SUPPORT AND RESISTENCE INDICATORS & FVGI find these helpful and free as support and resistence thought id share

HELPFUL SUPPORT AND RESISTENCE INDICATORSI find these helpful and free as support and resistence thought id share
NAS100 Trade Set Up 1500 pips secured!Price manipulated first above London highs to then come down and sweep SSL/London lows then CISD on the 15m with a retest to buy up to full tp5 1500 pips

Nasdaq-100 Wave Analysis – 10 November 2025- Nasdaq-100 reversed from support level 25000.00
- Likely to rise to resistance level 26250.00
Nasdaq-100 index recently reversed up with the daily Hammer from the support zone between the round support level 25000.00 and the support trendline of the daily up channel from May.
This support zone was strengthened by the 61.8% Fibonacci correction of the sharp upward impulse from October.
Given the clear daily trend, Nasdaq-100 index can be expected to rise to the next resistance level 26250.00 (top of the previous impulse wave i).

Sellin Zone Nas1001. Daily is bearish
2. 4HR is bearish
3. 2HR is bearish
4. 1HR is bearish
Therefore, we looking for sells. I will enter a sell in the internal supply zone.

NAS100 Trade Set Up Nov 10 2025Price has shifted to bullish structure on the 1h so i will wait for price to sweep SSL or tap into bullish 1h FVG before looking for buys to target higher BSL

Lower CPI Data – But Don’t Be Fooled by “Good” Inflation Numbers
Summary:
Markets cheered on lower CPI data, but the optimism might be misplaced. A softer inflation print gives the FED more flexibility, yet it also reduces the urgency for two rate cuts this year — something traders had already priced in.
Logic:
CPI came in weaker → short-term bullish sentiment.
But the real driver of rates is not CPI alone — it’s the balance between inflation and growth.
With inflation easing and economic activity still stable, the FED doesn’t need to cut twice in 2025.
Futures market (CME FedWatch) was pricing two cuts, which means that optimism is already priced into NASDAQ valuations.
Scenario Outlook:
If CPI remains stable and growth holds → only one cut or delay, not two.
That means tech valuations might need to reprice lower, especially high beta names.
NASDAQ could revisit support around 17,000–17,200 before finding balance again.
Trading View:
Watch for rejection near 18,000–18,200 (overextension after CPI rally).
Short-term bias: bearish / correction mode.
Long-term bias: still bullish, but needs valuation reset.
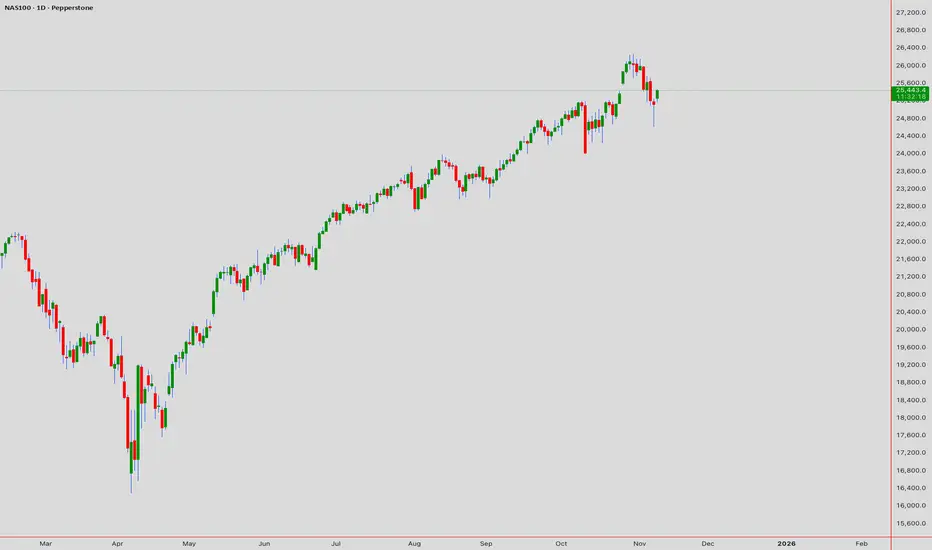
NASDAQ Excellent rebound on the 1D MA50. Bullish.Nasdaq (NDX) has been trading within a 6-month Channel Up and last Friday made another 1D MA50 (blue trend-line) test exactly at the bottom (Higher Lows trend-line) of the pattern, and rebounded.
This has market the last two bottoms of the Channel Up and kickstarted the Bullish Legs, which have both been at +9.59%. As you realize, this it technically the pattern's strongest Support and most optimal buy entry for the medium-term.
We expect at least another +9.59% rally on the emerging Bullish Leg, targeting 26950.
-------------------------------------------------------------------------------
** Please LIKE 👍, FOLLOW ✅, SHARE 🙌 and COMMENT ✍ if you enjoy this idea! Also share your ideas and charts in the comments section below! This is best way to keep it relevant, support us, keep the content here free and allow the idea to reach as many people as possible. **
-------------------------------------------------------------------------------
💸💸💸💸💸💸
👇 👇 👇 👇 👇 👇

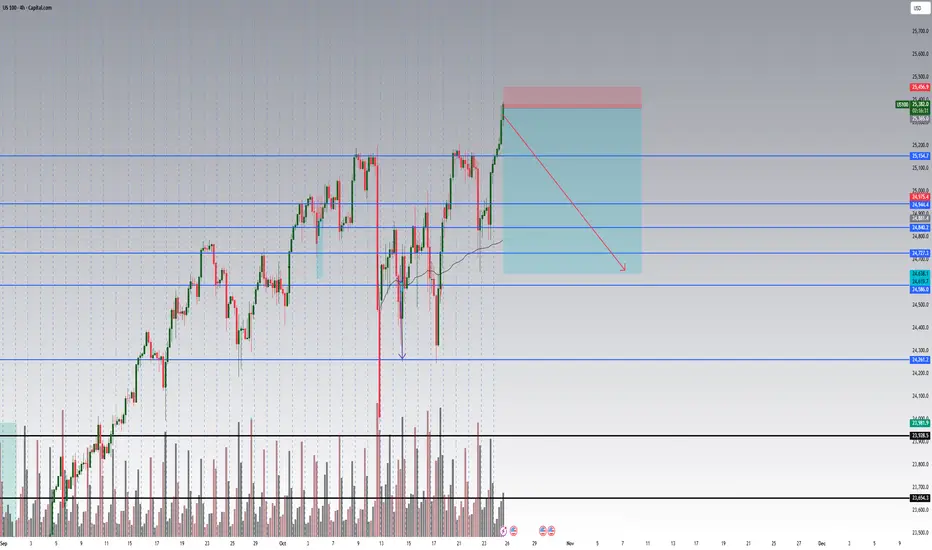
New Highs Before a Major Correction?The NASDAQ remains firmly within its main ascending trend channel, respecting both the upper and lower boundaries since mid-2023. After a sharp dip triggered by tariff-related headlines, the index quickly recovered, reaffirming bullish momentum and establishing a new support base along the lower trendline.
We’re now approaching the 2nd Fibonacci extension level drawn from the previous major top to the last significant bottom — a key confluence area that historically signals potential exhaustion of the current leg up.
Based on the current price trajectory, this zone could act as a probable top region, marked by the green resistance box on the chart. If the market reacts here, a technical correction or consolidation phase could unfold, retracing back toward the support zone around the mid-channel (highlighted in green).
The “500 Days Rich Man Theory” line (July 2026) may coincide with a macro cycle inflection point, suggesting a timing window for trend reversal or cooling period before the next long-term advance resumes.

NAS100 Intraday Technical AnalysisNAS100 Intraday Technical Analysis - 10 Nov 2025
Nasdaq 100 at 25,454 (2:05 PM UTC+4) — multi-chart confluences signal breakout setup.
📌 Market Context: Wyckoff Phase D re-accumulation; Dow Theory primary uptrend intact; Gann Square-of-9 vibration levels 25,520/25,320.
🗺️ Multi-Timeframe Breakdown:
1D: Broadening wedge; RSI 63 (mild bearish divergence); Ichimoku cloud support 25,180; bullish engulfing pattern intact.
4H: Rising wedge 25,280-25,520; Elliott Wave (3) mid-extension; anchored VWAP from Oct 29 = 25,180 (buy anchor).
1H: Cup-and-handle breakout base at 25,360; BB expanding; VWAP reclaimed post-morning dip.
30M: Symmetrical triangle; hidden bull divergence (RSI higher lows); volume contracting pre-breakout.
15M: Bull flag over 25,340; Tenkan>Kijun bullish; stochastic RSI reset—ready for push.
5M: Falling wedge retest 25,420; hammer candlestick confirms demand; watch bull trap on volume weakness.
🎯 PRIMARY LONG SETUP
Entry: 25,360-25,390 (VWAP + flag support) — wait for bullish 15M close above 25,380.
Stop Loss: 25,300 (below symmetrical triangle base).
Target 1: 25,480 (+26 pips).
Target 2: 25,540 (+86 pips).
Target 3: 25,620 (+166 pips — harmonic alt bat PRZ).
Confirmation: RSI >55, volume >20% of 20-day avg, VWAP slope upward.
⚡ MOMENTUM ADD-ON: Scale above 25,520 ONLY if RSI>65 & volume surge confirmed; trail stop to 25,460 once first target prints.
🔻 REVERSAL SHORT SETUP
Entry: 25,600-25,640 (supply zone) — trigger on bearish engulfing + RSI divergence.
Stop Loss: 25,700 (above rising wedge).
Targets: 25,500 → 25,420 → 25,320 (Gann support).
Confirmation: 5M/15M RSI bearish divergence; BB upper band rejection.
🚨 BREAKOUT & BREAKDOWN ALERTS:
BULL: 1H close >25,540 confirms Wave (3) extension; target 25,720; move stop to BE+20.
BEAR: 1H close <25,300 with volume expansion opens 25,180 cloud base test; watch VWAP support.
📊 INDICATOR SNAPSHOT: BB squeeze (30M) expanding; MACD histogram positive; VWAP slope UP; EMA21>EMA50>EMA200 (bullish stack).
⚠️ PATTERN ALERTS: Harmonic bat completes 25,620; rising wedge failure <25,320 = Wyckoff UTAD signal; H&S only valid if neckline 25,260 breaks.
📈 TIMING & RISK: Gann 90° window 15:30 UTC; ATR(14)=90 pts; CPI whispers & Fed speakers elevate volatility. Risk ≤1% per setup; lock partials; avoid sub-average volume chases.
Educational purposes only. Align with your plan, manage risk, adapt to real-time action.
Nasdaq 100 Rebounds as Traders Anticipate End of the US ShutdownNasdaq 100 Rebounds as Traders Anticipate End of the US Shutdown
As the chart shows, the Nasdaq 100 index has started the week on a positive note amid growing expectations that the longest government shutdown in US history may soon come to an end.
According to Reuters, a bill has been introduced in the Senate proposing amendments to extend government funding until 30 January. The news acted as a bullish catalyst for equity markets. Still, the question remains – is the risk truly behind us?
Technical Analysis of the Nasdaq 100
Analysing the hourly chart of the Nasdaq 100 on 4 November, we:
→ Drew an ascending channel;
→ Noted signs of momentum exhaustion, as mentioned in our previous headline.
Since then, price action has evolved as follows:
→ The lower boundary of the channel provided support (1), prompting a brief rebound;
→ The 25,770 level acted as resistance (2) on two occasions, strengthening the bears’ confidence to push for a downside breakout — which ultimately succeeded.
The index’s subsequent movements have now more clearly outlined the formation of a descending channel (shown in red).
From the demand-side perspective:
→ After a false bearish breakout below 24,680 (showing characteristics of a Liquidity Grab pattern), the market staged an aggressive rally from point B;
→ Today’s session opened with a bullish gap, and the price has moved above the red median line.
From the supply-side perspective:
→ The 25,500 level, where sellers gained control during the previous channel breakout, may now act as resistance;
→ If the A→B move is viewed as an impulse, today’s rally appears to be a corrective rebound consistent with Fibonacci proportions — suggesting that downward momentum could resume within the red channel.
This article represents the opinion of the Companies operating under the FXOpen brand only. It is not to be construed as an offer, solicitation, or recommendation with respect to products and services provided by the Companies operating under the FXOpen brand, nor is it to be considered financial advice.

NASDAQ Double Top Rejection Still At PlayI do not believe the bears are quite done yet in this market. What I am seeing currently is a bullish correction or retest of this double top rejection.
Momentum to the downside will resume soon enough. For now however, enjoy the ride to the upside - cautiously.
This is a buy to sell setup. My overall bias is bearish.

NASDAQ is Nearing an Important Resistance Line.Hey traders, in tomorrow's trading session we are monitoring NAS100 for a selling opportunity around 25,500 zone, NASDAQ is trading in a downtrend and currently is in a correction phase in which it is approaching the trend at 25,500 support and resistance area.
Trade safe, Joe.

Close callWas waiting for this setup, everything ready, then price just left me behind, anyone in this?

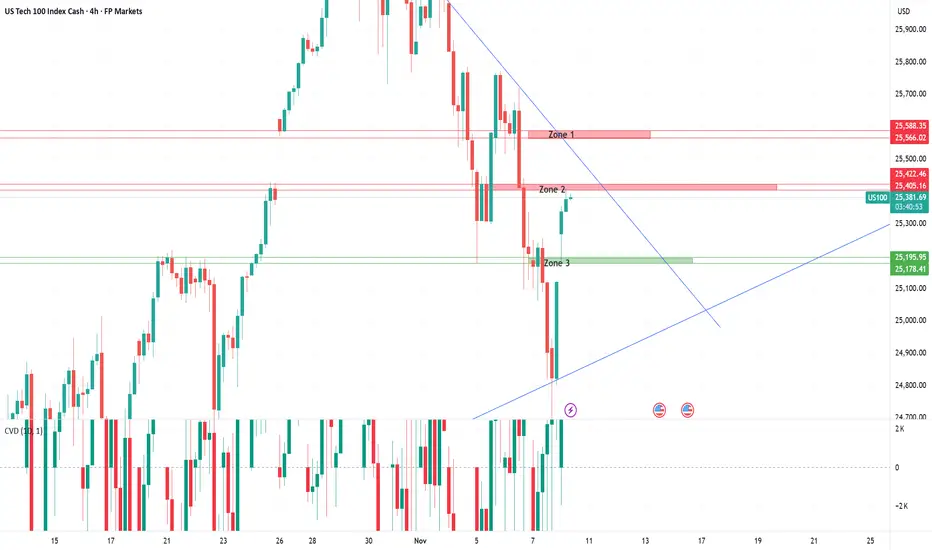
US100 – Trading within a battle of supply and demandUS100 – 4H Technical Zone Analysis
Overall, it remains challenging to define high-probability trading zones in the current environment. Price action is taking place near all-time highs, where volatility is elevated and historical reference points are limited. With sentiment shifting rapidly on macro headlines and thin data visibility, traders should treat each reaction zone with caution and focus on confirmation rather than anticipation.
Zone 1: Former Demand Turned Resistance
This area previously attracted strong buying interest, but sellers have since regained control, forcing price back below the level. The zone now acts as a clear resistance area where supply is likely to re-emerge. A confirmed rejection here would reinforce short-term bearish structure, while a clean break and hold above could signal that buyers are reclaiming dominance.
Zone 2: Minor Reaction Zone / Potential Supply Area
This zone represents a less-defined reaction area where a previous price gap formed, suggesting potential for renewed selling pressure if price revisits it. However, given the lack of strong historical structure, traders should approach this zone with caution and look for clear confirmation before positioning around it.
Zone 3: Former Supply Turned Support
This level previously acted as a ceiling where sellers pushed price lower before a decisive breakout occurred. Since that move, the area has flipped into a supportive base, marking the first meaningful demand zone beneath current price. As long as price holds above Zone 3, the broader structure remains constructive; a confirmed break below would indicate that buyers are losing control.
Macro Overview
The Nasdaq-100 continues to trade near record highs, supported by a mix of resilient economic data, easing inflation pressures, and improving global risk sentiment. The broader tone remains constructively bullish, though investors are increasingly aware that the rally is being sustained more by optimism than by hard data.
Last week’s key drivers included renewed progress in U.S.–China trade talks and a strong set of tech earnings, which reinforced confidence in the growth and AI-led segments of the market. Softer-than-expected inflation readings added fuel to the rally by reviving expectations of potential Fed rate cuts in early 2026. However, policymakers have since pushed back on those assumptions, warning that rate reductions are not guaranteed and that the central bank will remain data-dependent.
At the same time, the ongoing partial U.S. government shutdown continues to delay key macro releases such as employment and CPI reports, leaving both investors and policymakers with limited visibility. This data vacuum makes markets unusually sensitive to headlines and Fed commentary.
NAS100 – Bullish Setup Alert (Inverse Head & Shoulders on 30min)#NAS100 has been moving sideways on the higher time frames, showing consolidation after recent volatility. However, on the 30-minute chart, it’s now forming a clean Inverse Head & Shoulders pattern, which is a classic bullish reversal signal.
Key Levels to Watch:
Neckline Breakout Zone: Watch for a breakout above the neckline for confirmation of bullish momentum.
Entry Plan: Wait for a break and retest of the neckline before entering a long position.
Targets: Short-term resistance zones and Fibonacci extensions can be used for profit booking.
Risk Management: Always use a tight stop-loss below the right shoulder to protect capital.
Technical Outlook:
Once the neckline is broken with volume confirmation, it may trigger a strong bullish continuation move — aligning with broader market momentum.
What’s your view on this setup?
Do you see a breakout coming soon, or another fakeout before the move? Share your thoughts below
#NAS100 #Trading #PriceAction #ChartAnalysis #TechnicalAnalysis #HeadAndShoulders #Forex #Indices #DayTrading

Nasdaq Battle between correction & innovationNASDAQ 100 (NDX)
Nasdaq 100 Index (NDX) currently sits at a crucial inflection point, defined by the overwhelming dominance of the technology sector's structural growth against a backdrop of increasing macroeconomic and technical vulnerability. After a historic rally driven by Artificial Intelligence (AI) euphoria, the market is undergoing a necessary and sharp correction, testing key support levels established during the latest bullish surge.
The Durable Foundation: AI, Earnings, and Profitability
The core bullish case for the NDX remains robust, fundamentally driven by the "Magnificent Seven" and the pervasive, non-negotiable surge in AI infrastructure spending. Unlike the speculative rallies of previous cycles, today's leaders are characterized by deep profitability, substantial cash flow, and diverse revenue streams.
Recent corporate earnings reaffirm this strength, with the technology sector posting strong double digit growth. This profitability suggests that investment in AI is being funded through internal cash flow, making the rally more sustainable than the debt fuelled expansion seen two decades ago. The long term trajectory is further supported by an accommodative Federal Reserve pivot, which is now in rate cutting mode a supportive contrast to the tightening cycle that ended the 2000 rally. The secular trend of technological innovation is accelerating, transforming AI from a growth narrative into an essential business imperative.
Macroeconomic and Sentiment Headwinds
Despite underlying corporate strength, recent market action signals a decisive sentiment shift rooted in macro uncertainty and high valuations. The index has experienced its steepest weekly decline since March, indicating heavy profit taking and a collective "reality check" among traders.
Several factors are contributing to this sentiment reversal:
1. Concentration Risk: The sheer weight of the largest components now represents an extraordinary percentage of the overall market capitalization, making the NDX acutely sensitive to volatility in just a few key names.
2. Labor Market Cooling: Data showing a significant spike in job cuts (particularly in the tech and warehousing sectors) has unsettled investors, suggesting that economic cooling is accelerating faster than anticipated.
3. Consumer Confidence: A sharp drop in consumer sentiment reflects heightened anxiety related to economic uncertainty and political instability, which historically dampens forward looking market optimism.
4. Valuation Concerns: While not at 2000 extremes, valuations remain elevated, shifting the market’s focus entirely from multiple expansion to demanding flawless execution and continuous earnings growth.
Technical Outlook: The Critical 25,000 Support Test
From a technical perspective, the NDX has been in a clear, rising trend channel over the medium to long term, confirming a persistent buy the dip mentality. However, the recent sell off has introduced significant short term caution.
The index is currently testing a non negotiable support zone around 25,000. This level is psychologically important and corresponds to a previous major breakout point. A decisive breakdown below this support could trigger a cascading sell off as automated stop loss orders are activated, potentially paving the way toward the next major supports at 24,500 and, more critically, 23,980.
Key Technical Levels:
• Immediate Support: 25,000
• Secondary Supports: 24,500, then 23,980
• Immediate Resistance: 25,200, followed by 25,500 and 25,700
Conclusion: Navigating the Volatility
Nasdaq 100 remains an index of unparalleled innovation and long term potential, yet its short term path is fraught with risk. The outlook hinges on the NDX's ability to hold the critical 25,000 support level. A bounce from this zone would confirm the resilience of the dip buyers and maintain the medium term bullish structure. Failure to hold this level, however, would signal a deeper technical correction is underway, shifting the focus to the lower support zones as the market cleanses its excessive exuberance. Traders should remain nimble, respecting the clear shift in short term momentum while maintaining conviction in the long term, secular growth of the technology giants.

US100 Free Signal! Buy!
Hello,Traders!
US100 Price has retraced back into a premium supply area after internal liquidity sweep. Smart money is likely to reprice lower, targeting inefficiency and equal lows beneath the recent range.
---------------------
Stop Loss: 25,256$
Take Profit: 24,951$
Entry Level: 25,133$
Time Frame: 3H
---------------------
Sell!
Comment and subscribe to help us grow!
Check out other forecasts below too!
Disclosure: I am part of Trade Nation's Influencer program and receive a monthly fee for using their TradingView charts in my analysis.

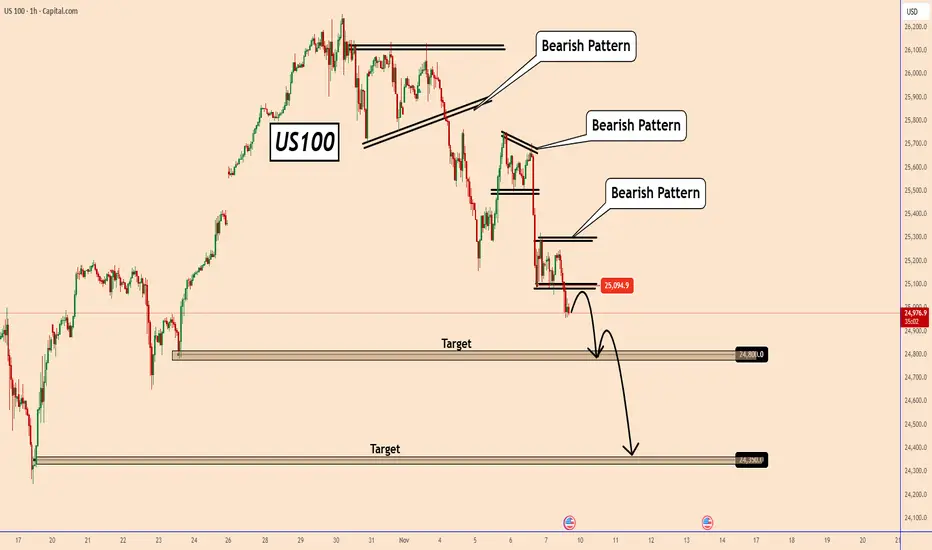
US100: Ready To Start a Downward Move?US100: Ready To Start a Downward Move?
A few days ago I posted an bullish forecast for US100.
US100 couldn't manage to break above the triangle pattern, and the price turned bearish.
Currently, we can see several bearish patterns one after the other. This sell-off started yesterday and may continue further in the coming days.
It could be related to earnings reports, AI bubble fears, etc. However, all indices were also heavily overvalued.
If the price respects this new bearish structure, we could see US100 falling to 24800 and 24350 first.
I will keep you all updated.
You may find more details in the chart!
Thank you and Good Luck!
❤️PS: Please support with a like or comment if you find this analysis useful for your trading day❤️