A down triangle is forming, tipical consolidation.A down triangle is forming, typical consolidation style, wait for it to break.
Trade ideas
Nas100 RetraceThese combined technical factors typically precede price appreciation in the Nasdaq 100 , suggesting the index will likely continue to rise shortly based on trend-following and momentum-based trading strategies with limited immediate overbought risk

NAS100 Trade Set Up Nov 24 2025Price is making bullish structure on the 1h so i want to see an internal sweep of SSL followed by 1m-5m IFVG/CISD to target PDH and higher BSL

NAS100 – Strong Order Block Explained | High-Volume Breakout & CA Strong Bearish Order Block formed on NAS100 after a powerful bearish Marubozu breakout candle, showing clear displacement and confirming aggressive institutional selling pressure.
1. Large Breakout Candle (Marubozu)
A strong bearish candle broke through previous structure with real displacement.
This is the first sign of a valid Order Block — a move driven by actual institutional flow, not just a liquidity sweep.
2. Clean Imbalance (IMB) Created
Right after the breakout, price left behind a clean Imbalance.
This IMB highlights urgency and confirms that big players were actively pushing the market.
3. Price Returned to the Strong Order Block
After the breakout, price slowly retraced back to the origin of the move — the Strong Order Block.
Once price tapped the OB, it reacted sharply and immediately moved lower, showing that institutional sellers were defending this level.
4. Volume Confirmation
Volume during the breakout was significantly higher than average.
This reinforces that the move was driven by institutional order flow, not retail traders.
🔑 Key Takeaways
This setup is a textbook Strong Bearish Order Block, meeting all core criteria:
Clear displacement
Clean Imbalance formation
Strong volume confirmation
Price returning to the OB and reacting decisively
A high-probability bearish setup built on structure, volume, and institutional footprints.

Next Nas100 GainThese combined technical factors typically precede price appreciation in the Nasdaq 100 , suggesting the index will likely continue to rise shortly based on trend-following and momentum-based trading strategies with limited immediate overbought risk

US100 Reversal Map – Hull MA + Heikin Ashi Confirmation🧠 US100 / NASDAQ100 Profit Pathway Setup — The Thief’s Bullish Escape Plan! 💰🚀
📊 Market Bias: Bullish (Day Trade Setup)
The Thief Trader has spotted a golden pathway in the NASDAQ100 (US100)!
Here’s the breakdown of the plan — straight from the thief’s vault 🕵️♂️📈
🎯 Plan Overview
Bias: Bullish continuation confirmed
Technical Confirmation:
✅ Double Pullback on Hull Moving Average
✅ Retest Zone successfully defended
✅ Heikin Ashi Bullish Doji signaled a trend reversal confirmation
💡 Momentum is shifting upward — the trend has officially changed!
💎 Entry Strategy (Layered Thief Style)
The Thief Strategy applies a layered entry method — multiple buy limits to average into strength.
📥 Buy Limit Layers:
25,300
25,400
25,500
25,600
(Traders can adjust or add more layers based on risk appetite and confirmation zones.)
🛡️ Stop-Loss Setup
This is the Thief SL @ 25,100
⚠️ Note to Thief OG’s:
I’m not recommending my SL as your SL — always customize risk and secure your own bag. Manage your position with discipline and independence! 💼
🎯 Take-Profit Zone
Target: 26,200
🚨 The Police Barricade Zone acts as a strong resistance — overbought levels spotted and potential bull trap alert!
Kindly exit with profit before the officers arrive. 😎
⚠️ Note: Profit-taking is at your discretion. Book and Run!
📈 Related Pairs to Watch (Correlation Insight)
NASDAQ:NDX / CAPITALCOM:US100 / NASDAQ:QQQ : All mirror NASDAQ movement.
SP:SPX / AMEX:SPY : Often correlate with NASDAQ’s momentum (watch divergence for clues).
TVC:VIX : If volatility spikes, expect pullbacks on tech-heavy indices.
TVC:DXY : A weak dollar often fuels US100 bullish legs — keep an eye on it.
NASDAQ:AAPL / NASDAQ:MSFT / NASDAQ:NVDA : Leading drivers of NASDAQ — if they pump, the index follows. 💪
🧩 Key Insights
Hull MA alignment confirms momentum shift.
Retest + bullish Heikin Ashi Doji = market reversal confirmation.
Layered entries give flexibility in volatile intraday conditions.
Dynamic risk management is key — never marry a position.
✨ “If you find value in my analysis, a 👍 and 🚀 boost is much appreciated — it helps me share more setups with the community!”
#US100 #NASDAQ100 #ThiefTrader #DayTrading #IndexTrading #HullMA #HeikinAshi #LayeredEntries #TechnicalAnalysis #TradingSetup #PriceAction #MarketReversal #TradingCommunity #BullishPlan #SmartMoneyFlow #TradeIdeas #ThiefStrategy


NASDAQ DEC 2025, Next week will unveil it all.I often like to use this approach, where I start from the most generic timeframe that still carries importance, moving into smaller timeframes narrowing the timeframe at each step, finally concluding with a short-term trade opportunity.
This post focuses solely on technical analysis, price action and trend behavior on the NDX. No fundamental expectations or macroeconomic interpretations are included.
I will be updating this post as trade opportunities develop.
A summary of this idea is provided at the end.
--- Long-Term Behavior ---
Long term outlook indicates that NDX had a strong bullish momentum until now, it pushed above the almost 5 year bullish trend marked with orange lines.
However, before it pushed above, NDX experienced a sharp decline. (marked with yellow circle)
But price carried back up with the yellow trend and created a much stronger bullish movement which managed to push further.
Now that stronger bullish movement is also over, NDX should be falling back for a retest. The last monthly candle was possibly the beginning of that retest movement.
After the retest two scenarios are possible, either it continues the bullish movement with a much higher pace or price fails to hold the retest and falls back toward the lower boundary of the previous long-term trend.
-- Short-Term Behavior --
In this section, I will be investigating the short-term movements to better predict a possible trade opportunity.
If we zoom into the yellow trend, the price was following a path estimated with the purple lines. Which also justifies the last months harsh fallback.
I expect NDX to start moving towards the lower boundary of the trend marked with yellow. (also, weekly RSI shows clear decrease in bullish momentum, indicating the yellow trend is coming to an end)
With all these in mind, to further predict the next 2-3 weeks movement, zooming into the last couple of months. NDX's last bearish movement, which I have shown with blue trend, can go two ways which the next weeks price movement will unveil. If the next week starts up bullish and the price fails to go down further NDX may rapidly rise. On the other hand, If it forms a steeper downtrend which I have shown in the second snapshot, it may possibly keep moving down for the long-term retest.
note that the trend drawings are estimations and may not be totally accurate.
-- Summary and Final Verdict --
Next week, we should see a clear directional bias for NDX
Bearish scenario: If price continues downward and establishes a steeper trend (as shown in the image), NDX is likely heading toward a full retest of the long-term breakout area.
Target: ~22,000
Bullish scenario: If the index shows clear signs of reversal and rejects further downside, a swift recovery toward previous highs is possible.
Target: ~26,500
I will be updating the post as we get a clearer image...

NAS100: Momentum Weakening — Watching for a Short Into Recent LoNASDAQ is showing signs of short-term exhaustion, with momentum favouring another attempt lower. A deeper pullback into the trendline is possible but uncertain.

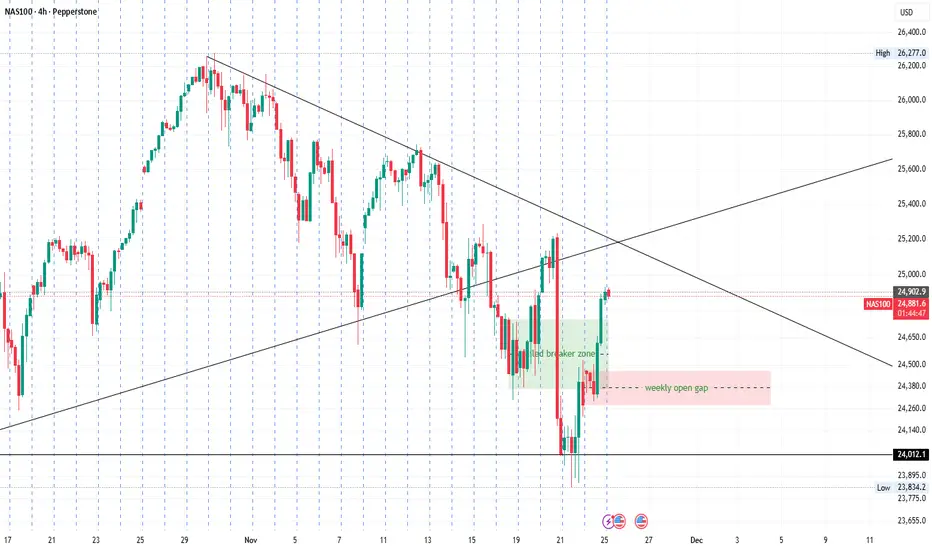
NAS100 –Long Liquidation, Short Squeeze,LVN Above Still a MagnetNasdaq futures just went through a classic two-step sequence:
Thursday – long liquidation (b-profile)
Fast drop from ~25 200 down to ~23 700.
Single-print style profile, almost no rotations, no absorption.
Price sliced straight through a low-volume void (LVN) between 25 150 → 24 650 – basically “air”.
Friday – short covering (P-profile)
Buyers stepped in around 23 700–23 900 and pushed price back to ~24 5xx.
The daily/session profile built a clear P-shape:
fat upper node around 24 380–24 480, long lower tail.
This is typical short squeeze / covering, not clean accumulation.
From a market-profile / order-flow perspective, that big LVN above is still unfinished business. Markets usually like to come back and “repair” such areas after a liquidation event.
Key Profile Levels
🔵 Thursday VPOC / support: 23 950–24 050
🔵 Friday HVN / acceptance: 24 380–24 480
🔵 Major LVN (thin air): 24 650 → 25 150
🔵 Pre-liquidation VPOC / destination: ~25 150
The rotation path that makes the most sense for me is:
23 950 → 24 380 → 24 650 → 25 150
…as long as we don’t get a fresh macro shock.
Trading Plan (not a signal, just how I see it)
Bias:
Cautiously bullish as long as price holds above 23 950–24 000, looking for the market to rotate back into the LVN above.
1️⃣ Long scenario (base case)
Ideal: early dip / chop above 23 950–24 050, then rotation higher.
First magnet: 24 380–24 480 (Friday HVN).
If price accepts above that zone (multiple 15m / 1H closes and volume building there), I expect a push into the 24 650 LVN edge, with potential extension toward 25 000–25 150 to “repair” the pre-crash profile.
2️⃣ Retest-lower scenario
If sellers hit us right from the open and we break below 24 100, I’m watching 23 950–24 000 as must-hold support.
A clean bounce from there still fits the rotation idea toward 24 380 → 24 650.
Acceptance below 23 900 would invalidate the bullish repair scenario for me and re-open the door to the weekly low 23 700 and even 23 150 HTF demand.
Invalidation
For this LVN-fill view I consider it wrong if:
We build value below 23 900,
Or we see a fresh b-profile / liquidation day under Thursday’s low.
In that case I’d step aside and reassess – that would mean the market is not finished with the downside.
How I’ll Use Order Flow
On intraday order-flow charts (NQ futures):
Looking for buying imbalances / absorption around 23 950–24 050 if we retest it.
Watching 24 380–24 480 for the battle between new sellers and short covering:
Acceptance above → bullish continuation toward 24 650+.
Sharp rejection with heavy sell imbalances → we might just be in a bigger range and the LVN can stay unfilled longer.
Final Thoughts
Thursday looked like forced-out longs (b-profile).
Friday looked like shorts scrambling to cover (P-profile).
There is still a huge LVN above, and these areas are often magnets once the panic phase is over.
As always, this is not financial advice, just my personal read of the auction.
Manage your own risk and sizing – especially after such high-volatility days.

NAS 2 MOON ?Ok so i made my oblivion call
where i expect incomprehensible shorting wothon the us stock market however i see one last impulse cooking up might react at the red levels and tank there before it goes my way idk but my bias is bullish and $27295 is my target
weekly timeframe keeps making higher highs if it breaks structure well game over

nas100 4h🔹 Overall Outlook and Potential Price Movements
In the charts above, we have outlined the overall outlook and possible price movement paths.
As shown, each analysis highlights a key support or resistance zone near the current market price. The market’s reaction to these zones — whether a breakout or rejection — will likely determine the next direction of the price toward the specified levels.
⚠️ Important Note:
The purpose of these trading perspectives is to identify key upcoming price levels and assess potential market reactions. The provided analyses are not trading signals in any way.
✅ Recommendation for Use:
To make effective use of these analyses, it is advised to manually draw the marked zones on your chart. Then, on the 15-minute time frame, monitor the candlestick behavior and look for valid entry triggers before making any trading decisions.

NASDAQ Week 32 OutlookOn the US Nas 100 1-hour chart, a bearish breakout from a symmetrical triangle suggests downward momentum. The Fair Value Gap at 23,500.0 is a pivotal level—watch for a breakout and retest here to confirm sell entries. Aim for the target at 22681.1, with a stop-loss at 23,740.4 to protect against adverse moves.

Nasdaq Short: Ride the wave 3 of 3 of 3In this video, I updated the Elliott Wave counts for Nasdaq and shows how wave 3 has formed as a series of sub-waves. I also showed that the last wave up (wave 2 of 3 of 3) was stopped at 50% retracement of wave 1 of 3 of 3. So my expectation is that next week we are going to crash in a wave 3 of 3 of 3.
Set the stop for this idea will be above wave 2 of 3 of 3 (around $24,540).
Good luck!

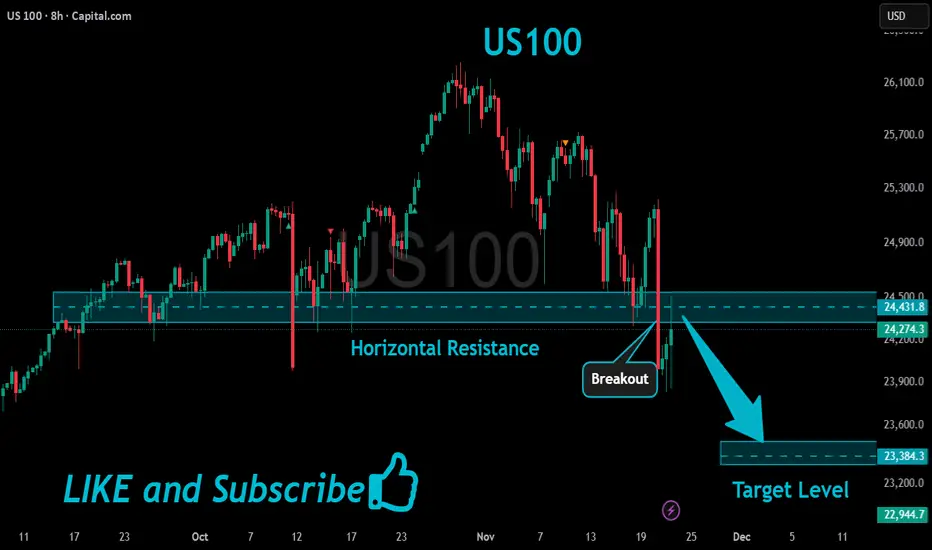
US100 Potential Short!
HI,Traders !
#US100 is making a rebound
But we are bearish biased
And after hits the
Horizontal resistance of 24431.8
We will be expecting a
Local bearish correction !
Comment and subscribe to help us grow !
NAS100 1:1.5 RRThis is a trade idea, posting for future reference
not to be taken as financial advice

Nasdaq The #1 Fear Of Investors BuyingLet me tell you what i did
i searched google and then i type
fear and greed index of the stock market
A page appeared and i saw the link
it took me to a famous
news website
where i saw something very shocking.
The gauge was on extreme fear.
The last time this appeared was in April
of 2025.
Now look at this chart on top..
You will see the RSI
its in the buying channel
because its oversold
This channel is showing
you the right place to buy this stock at a affordable price.
The main stream media
and your favourite Guru
is not talking about this
market recovery
Because its not easy to see unless you
understand trading systems.
Am ready to buy this
are you?
Rocket boost this content to learn more
Disclaimer: Trading is risky please learn risk management and profit
taking strategies.Make sure
you use a simulation trading account before you
trade with real money.

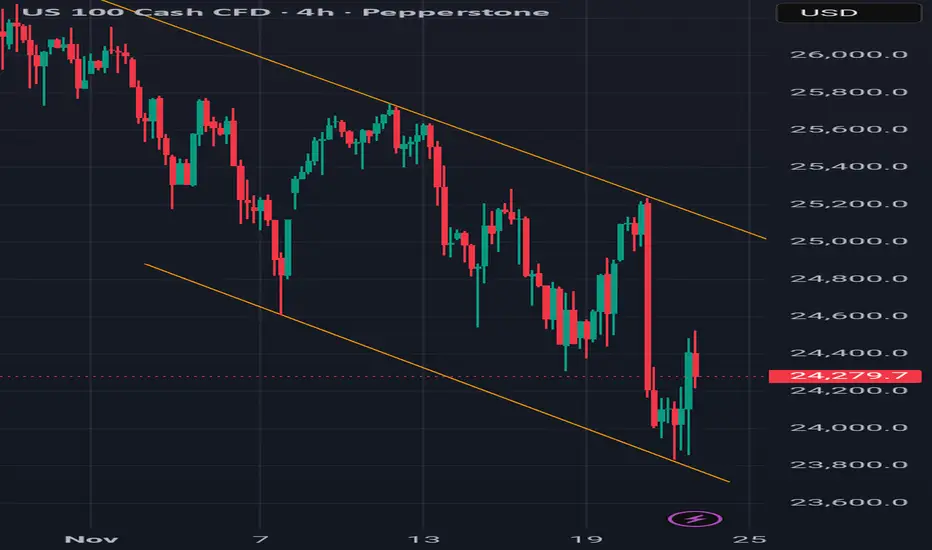
Momentum meets structure - Asset: US 100 Cash CFD
- Timeframe: 4H
- Structure: Descending channel (bearish trend)
- Momentum: Stochastic RSI (14,3,3) rising from oversold
- Event: Price bounced off lower trend line with stochastic confirming upward momentum
1. Trend Line Structure
- The descending channel defines a bearish environment.
- Price touches the lower boundary → potential support zone.
- This is a structural signal: price may bounce within the channel.
2. Stochastic Confirmation
- Stochastic RSI was in the oversold zone (<20).
- Lines are now crossing upward, signaling momentum shift.
- This is a momentum signal: buyers are stepping in.
3. Confluence = High-Probability Setup
- Structure (trendline support) + Momentum (stochastic reversal) = confluence.
- This increases the probability of a short-term bullish move toward the upper trend line.
-Price action within a descending channel shows a bounce off support. Stochastic RSI confirms momentum shift from oversold. This confluence offers a textbook example of how structure and momentum combine for a high-probability setup.
This setup teaches traders to:
- Wait for confluence, not isolated signals.
- Use stochastic to confirm trend line reactions.
- Respect the channel boundaries for targeting and risk.
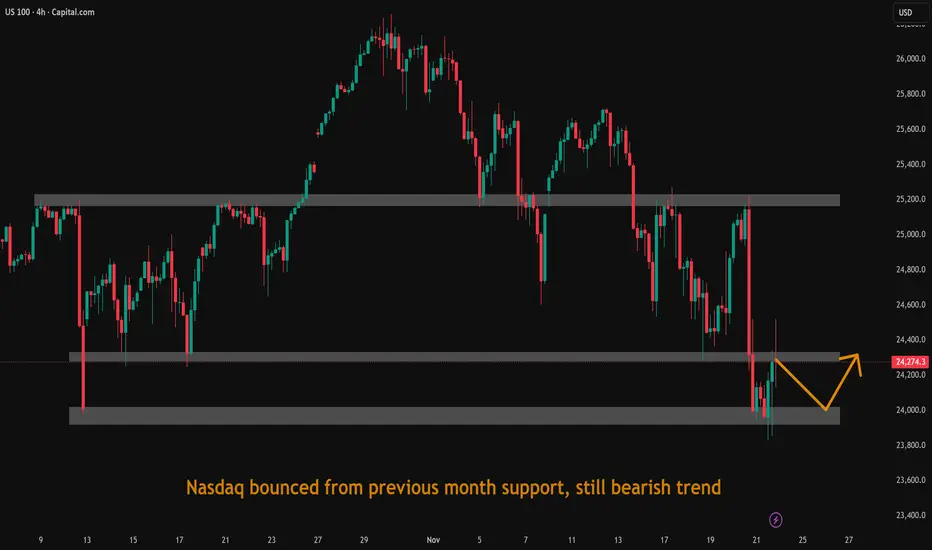
Nasdaq bounced from previous month support, still bearish trendNasdaq bounced from previous month support, still bearish trend.
US100 (NASDAQ) — Daily CLS RangeUS100 (NASDAQ) — Daily CLS Range
Daily CLS ,
2nd candle is now complete, establishing the range.
On the 1H chart, a pullback into the BPR zone would provide a high-probability entry, supported by strong confluence at this level.
Target: Daily 50% midpoint at 25,287.6

NASDAQ: Got a A plus Setup for the Nasdaq 100, Just long and chiNasdaq index seems like buy the dip and forget... NASDAQ: Got a A plus Setup for the Nasdaq 100, Just long and chi

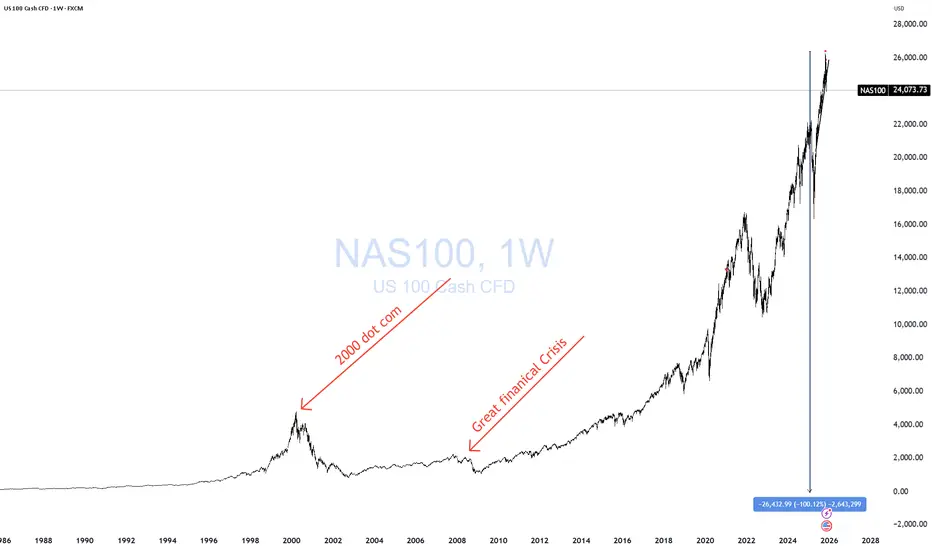
NDX - 92% From ZeroI want you to always remember one thing:
Wherever the price goes, it’s always 100% from zero.
That’s why every now and then you need to take the chart off log and look at it with fresh eyes.
Occam’s razor.
I keep hearing the PERMA-BULL crowd screaming that “the bears are calling this an AI bubble,” and in the same breath whining that the pullback is “overdone” or “extreme.”
Really?
The S&P is down 5%, and they’re already crying about the bears?
SMH.
It’s all strawman nonsense. Don’t fall for it.
Take it off log…
Remember everything is 100% from zero…
Use your basic, instinctive judgment…
And then ask yourself what your eyes are telling you when you look at this chart.
That’s the truth — not the narratives.
THANK YOU for getting me to 5,000 followers! 🙏🔥
Let’s keep climbing.
If you enjoy the work:
👉 Boost
👉 Follow
👉 Drop a solid comment
Let’s push it to 6,000 and keep building a community grounded in truth, not hype.
NasdaqBullish nasdaq as price went to restest the strong demand zone ans respected the price zone. Now more bullish momentum expected till our initial resistance.
