Could the drop be over?Technical: The index is sitting around 22,078 points, dropping approximately 2.15%.
Fundamental: The decline is linked to a reversal of momentum after NVIDIA Corporation’s strong earnings; although the results were solid, the market interpreted that risks related to interest rates and valuations may still persist.
Key: Keep an eye on the upcoming Federal Reserve interest rate decision and the evolution of employment data, as the market remains sensitive to whether rate cuts will occur or not.
Trade ideas

NAS100 Trade Set Up Nov 21 2025Price is still under strong bearish pressure to i will look for internal 1m-5m structure to take sells to lower SSL levels

NASDAQ | Potential for Upside if Positive Tone is MaintainedNASDAQ Market Outlook | Potential for Upside if Positive Tone is Maintained
Currently, the NAS index remains under bearish pressure. Concerns about an AI bubble continue to weigh on technology stocks, even though Nvidia recently reported its highest revenue ever of $57 billion with strong growth guidance.
However, investors remain cautious due to the massive increase in spending on AI, perceived overvaluation of stocks, and the market's reliance on a few mega-cap companies.
Under these conditions, selling pressure in the technology sector continues and is affecting the movement of the USNAS100 index.
Price movement direction based on key levels:
As long as the price is below 23,940 → the trend remains bearish.
If the decline continues, the gradual decline target is in the following areas:
🔻 23,700 → 23,340 → 23,050
If the price rises and closes above 24,150 on the H1 timeframe → potential bullish correction
The corrective upward trend has the potential to move towards:
🔺 24,350 → 24,570
Analysis Conclusion
USNAS100 remains in a bearish trend as long as the price is unable to break through and maintain above the 23,940 level. Selling pressure is expected to intensify if the 23,700 support level is broken, opening the opportunity for a decline towards the 23,340 to 23,050 area.
US NAS 100DO YOU KNOW WHATS BEHIND THIS OR OTHER IDEAS?? in bio..
Preferably suitable for scalping and accurate as long as you watch carefully the price action with the drawn areas.
With your likes and comments, you give me enough energy to provide the best analysis on an ongoing basis.
And if you needed any analysis that was not on the page, you can ask me with a comment or a personal message.
Enjoy Trading ;)

NAS100 Sits at Key LevelPrice is sitting right on top of major support. This level has been holding up nicely before, and it's also a strong psychological round number, which means buyers naturally defend it harder.
This is where buyers stepped in aggressively the last time. And where reactions tend to be violent.
This is the market literally waiting for a catalyst.
And here’s the important part:
If buyers manage to hold this zone?
We could easily see price pushing back toward 24,750.
BUT…If this support gives way…Then everything changes.
A breakdown here would invalidate the bullish structure entirely and starts a larger bearish move. When a level this strong breaks, it usually drops hard and strong.
So right now, the market is at a crossroads.
A clean break + retest below this level would confirm it.
In short:
👉 Hold the zone → bullish push toward 24,750
👉 Lose the zone → strong bearish continuation

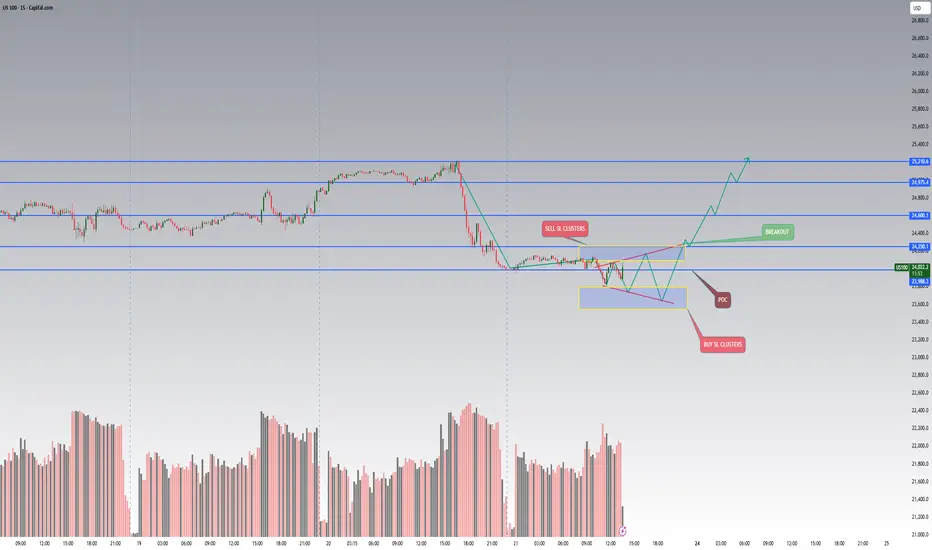
Why Markets Struggle After a Big Drop (NASDAQ Case Study)Understanding liquidity, distribution phases and market-maker behavior
After the NASDAQ fell sharply from 25 000 to 24 000, many traders were surprised why the market suddenly stopped moving and started to “chop” around the same area.
But this behavior is not random — it’s a structural problem inside the order-flow.
1️⃣ Markets can fall fast — but they cannot continue without liquidity
Every trade in the market has a counter-party.
If traders want to buy the dip, someone must sell to them.
After a large drop, fewer participants are willing to sell at the new low prices.
Institutions are often already hedged or already sold during the fall.
Market makers cannot force liquidity out of thin air — they must create it.
This leads to a distribution phase, where price stops trending and starts rotating around a key area.
2️⃣ Why distribution forms around the Point of Control (POC)
When aggressive hedging is finished and volatility slows down, the market enters a phase where:
Price rotates around the Point of Control (POC)
Volume increases
Market makers attempt to rebuild liquidity on both sides of the range
This is not accumulation or re-accumulation — it is a liquidity-engineering phase.
Market makers need enough:
Buy-side liquidity above POC (stop losses of shorts, breakout traders, trapped buyers)
Sell-side liquidity below POC (stop losses of longs, late dip-buyers, liquidation clusters)
Without these pools, the market cannot initiate the next impulsive move.
3️⃣ The problem with sell-side liquidity after a big fall
When NAS dropped from 25k → 24k:
Most weak longs were already liquidated
Many sellers closed positions or took profit
Fresh shorts hesitate to enter at the lows
Institutions are waiting for better prices
This creates a liquidity vacuum.
To solve this vacuum, the market “mirrors” trades inside the range:
Price moves up → build stops above
Price moves down → build stops below
Repeated sweeps → fill both sides of liquidity
Only after enough stop-loss clusters form, the market is capable of moving again with real momentum.
4️⃣ What this means for traders
This is not a buy or sell signal.
It’s an explanation of why the market becomes extremely slow, sideways or manipulative after a big impulsive move.
In this phase:
Breakouts usually fail
Trend trading performs poorly
Range traps occur frequently
Market reacts strongly to liquidity pockets, not fundamentals
The key is to understand what the market is missing:
➡️ Not direction.
➡️ Not fundamentals.
➡️ But liquidity.
Until the liquidity pools are recreated, the next real directional move cannot start.
5️⃣ Final takeaway
A strong decline does not end because “buyers step in.”
It ends because no more sellers exist at those levels, forcing market makers to rotate price and rebuild the order-book.
Learning to identify these liquidity-reset periods helps traders avoid:
Chasing breakouts
Entering too early
Getting trapped during fake momentum
Misreading sideways distribution as a reversal
USNAS100 –Key Breakout Levels | Bearish Below 25100 Ahead of NFPUSNAS100 | OVERVIEW
NASDAQ futures surged as Nvidia’s strong earnings eased concerns of an AI-driven market bubble, boosting overall tech sentiment.
Markets are now shifting attention to the NFP and U.S. jobs report, with expectations of elevated volatility throughout the NY session, especially given Nvidia’s strong influence on tech stocks.
Technically:
Below 25100: Bearish continuation toward 24880 → 24760 → 24350
Above 25215: Bullish breakout toward 25430 → 25650 → 25700
Pivot: 25100
Support: 24880 · 24760 · 24350
Resistance: 25220 · 25430 · 25650
USNAS100 stays bearish under 25100; only a confirmed close above 25215 will signal bullish continuation.
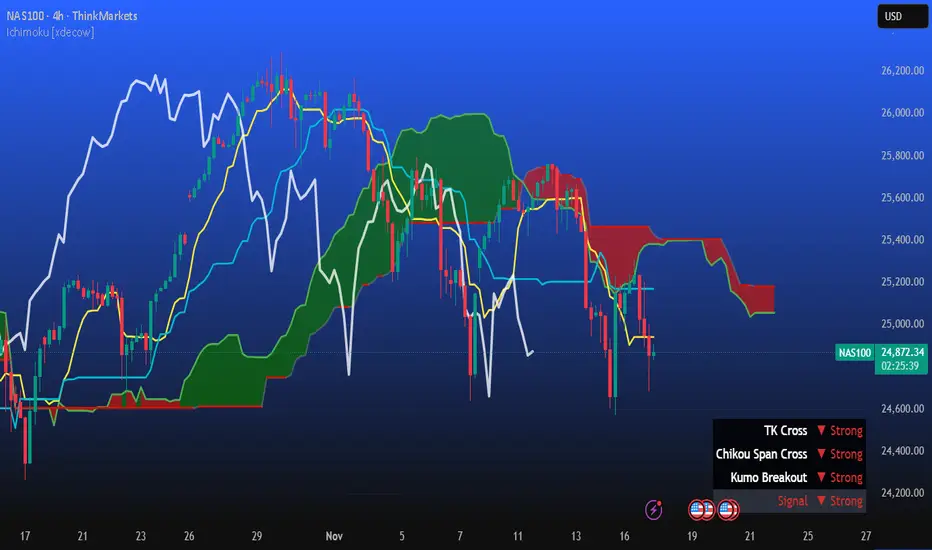
NAS100 - Waiting for buy setup on 4hr timeframeTimeframes Used: Monthly → Weekly → Daily → 4H
Current Market Condition:
Nas 100 is a valid trade according to my system rules:
Monthly: Price is above the Cloud → Bullish
Weekly: Price is above the Cloud → Bullish
Daily: Price is above the Cloud → Bullish
----------------------------------------------------------------------------------------------------------------
What I’m Waiting For:
I’ll be watching for the next 4H breakout opportunity.
Price to break above the 4hr timeframe.
NAS100 H4 | Potential bullish reversalMomentum: Bearish
The price may experience a short-term pullback toward the identified buy-entry level, which aligns with a key pullback-support zone.
Buy Entry: 24,851.44
Pullback Support
Stop Loss: 24,362.73
Multi Swing-Low Support
Take Profit: 25,774.15
Pullback Resistance
High Risk Investment Warning
Stratos Markets Limited (tradu.com ), Stratos Europe Ltd (tradu.com ):
CFDs are complex instruments and come with a high risk of losing money rapidly due to leverage. 70% of retail investor accounts lose money when trading CFDs with this provider. You should consider whether you understand how CFDs work and whether you can afford to take the high risk of losing your money.
Stratos Global LLC (tradu.com ): Losses can exceed deposits.
Please be advised that the information presented on TradingView is provided to Tradu (‘Company’, ‘we’) by a third-party provider (‘TFA Global Pte Ltd’). Please be reminded that you are solely responsible for the trading decisions on your account. Any information and/or content is intended entirely for research, educational and informational purposes only and does not constitute investment or consultation advice or investment strategy. The information is not tailored to the investment needs of any specific person and therefore does not involve a consideration of any of the investment objectives, financial situation or needs of any viewer that may receive it. Past performance is not a reliable indicator of future results. Actual results may differ materially from those anticipated in forward-looking or past performance statements. We assume no liability as to the accuracy or completeness of any of the information and/or content provided herein and the Company cannot be held responsible for any omission, mistake nor for any loss or damage including without limitation to any loss of profit which may arise from reliance on any information supplied by TFA Global Pte Ltd.

Rising Expanding Wedge BreakdownI’ve spotted this expanding wedge pattern on the Nasdaq and there is probably more downside imminent for the Nasdaq. I'm sure this isn’t new to most of you. A bearish price target around 23,000 (for now) is highly likely. Long-term I remain bullish (see my other ideas), but right now the extreme fear is handing control to the bears for a while.

NAS100 BuyThe recent drop in the Nasdaq is largely tied to fears that the AI rally has become overheated, with major tech names pulling back sharply as investors question whether recent gains were justified. Much of the selloff reflects anxiety rather than a breakdown in fundamentals, as highlighted by concerns over an AI bubble in the CBS News report. However, this correction also sets the stage for a potential bullish reversal. The long-term growth story for AI remains intact, and strong underlying fundamentals could draw buyers back once panic selling eases. Market overreaction often creates attractive entry points for institutional investors, especially if leading tech companies deliver solid earnings or upbeat guidance. A shift in Federal Reserve tone toward more supportive policy would also boost growth stocks significantly. With investor sentiment still optimistic about the future of technology despite short-term volatility, the Nasdaq has room to recover and potentially resume its broader uptrend.

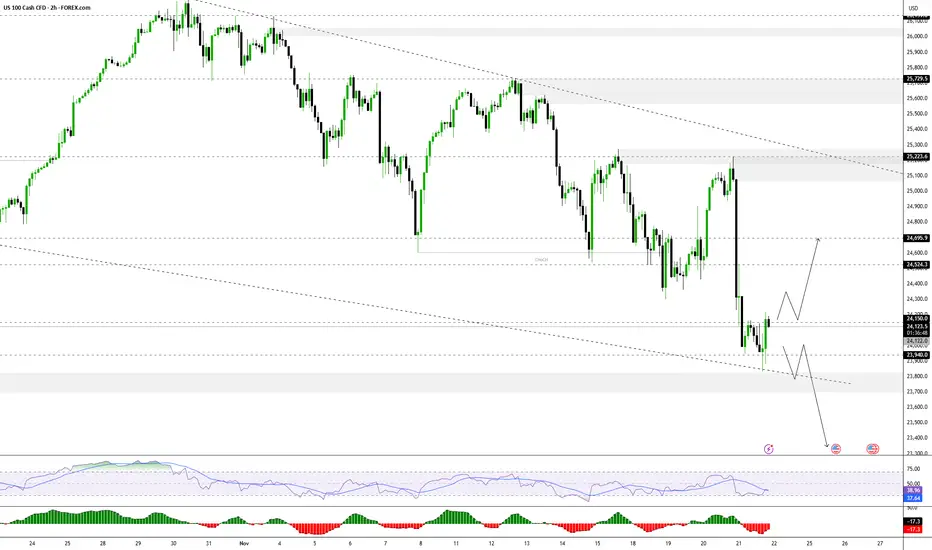
Nasdaq 100 drops to a new low on the weekWhat a sell-off! The Nasdaq 100 (-2%) has now dropped almost 1,000 points from earlier high, to relinquish its entire gains related to Nvidia (-1.6%) and some to hit a new low on the week. How much more selling in there to come? Judging by price action in the crypto space, I would say a fair bit more.
By Fawad Razaqzada, market analyst with FOREX.com

NAS100 Trade Secured 2000 Pipsprice manipulated higher tapping into the fib level and sweeping extreme BSL to then engulf on the 15m, BOS to the downside to target SSL and PDL

NASDAQDO YOU KNOW WHATS BEHIND THIS OR OTHER IDEAS?? in bio..
Preferably suitable for scalping and accurate as long as you watch carefully the price action with the drawn areas.
With your likes and comments, you give me enough energy to provide the best analysis on an ongoing basis.
And if you needed any analysis that was not on the page, you can ask me with a comment or a personal message.
Enjoy Trading ;)

NAS100 Trade Set Up Nov 20 2025Overall still bearish but first i want see a sweep of BSL and test for fib levels to then look for internal 5m-15m engulfing and IFVG/CISD to sell down to SSL/PDL

My thoughts on NAS100my thoughts on NAS100 .... Lets see if I am correct or, there's always a room for correction.

US100NASDAQ ( US - 100 )
- Completed " 12345 " Impulsive Waves
- Break of Structure
- Demand Zone
- RSI - Divergence
- Order Block

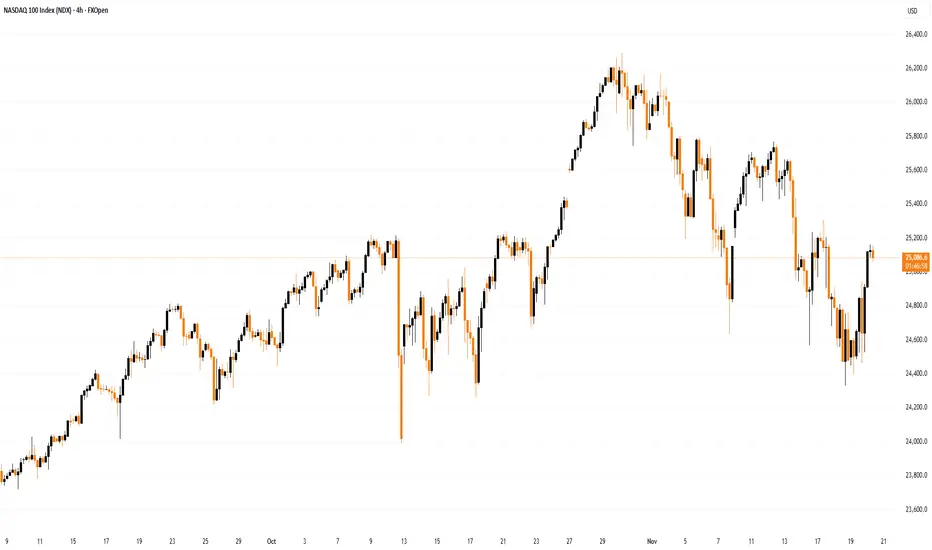
Tech Stocks Rally After Nvidia’s Earnings ReportTech Stocks Rally After Nvidia’s Earnings Report
As the chart shows, the Nasdaq 100 index is displaying positive momentum today. A strong catalyst for growth arrived with the release of Nvidia’s quarterly report, which exceeded Wall Street’s optimistic expectations.
Nvidia reported quarterly revenue of $57bn (vs. the expected $54.9bn), and earnings per share of $1.30 (forecast: $1.26). Meanwhile, CEO Jensen Huang stated that demand for the new Blackwell chips is “off the charts”.
Nvidia’s strong report revived “risk appetite” in the tech sector and eased concerns about a potential AI bubble.
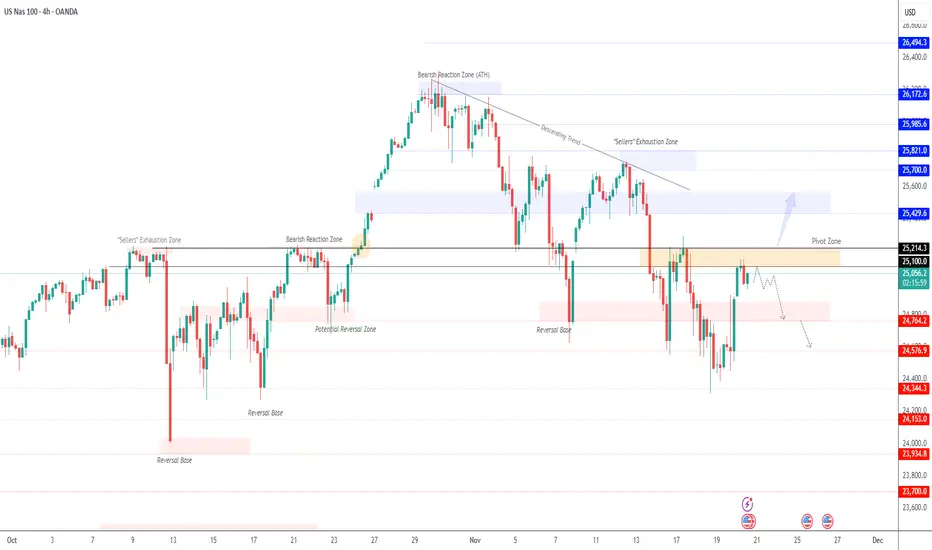
Technical Analysis of the Nasdaq 100 Chart
Analysing the hourly chart of the Nasdaq 100 two days earlier, we:
→ noted that the previously active upward channel had broadened downwards;
→ suggested a scenario in which the bulls might attempt to return the index to an upward trajectory if Nvidia’s quarterly results were strong.
Yesterday’s report from the equity market leader confirmed that demand for artificial intelligence infrastructure remains enormous, paving the way for the tech-sector rally to continue.
From the standpoint of supply pressure, resistance may come from:
→ the upper red line drawn through the lower November highs;
→ the 25,400 level, which had acted as local support but was decisively broken by a large bearish candle.
On the other hand:
→ the decline towards 24,400 once again activated buying interest;
→ the November drop may prove to be only an intermediate correction, after which the upward trend could resume.
Whether the bulls can maintain positive momentum in the Nasdaq 100 following Nvidia’s strong quarterly figures will depend largely on the outcome of the delayed September US employment report, postponed due to the shutdown.
This article represents the opinion of the Companies operating under the FXOpen brand only. It is not to be construed as an offer, solicitation, or recommendation with respect to products and services provided by the Companies operating under the FXOpen brand, nor is it to be considered financial advice.
US Stock Market Danger SignalThere are more and more bearish signals coming in for Nasdaq and S&P 500. Big names started selling, more reports about possible correction, FED staying instead of cutting, market breadth is worse and close to previous correction and now the price is below the trendline.
I will go short with a close stop, do not want to risk too much.

NAS100 Bullish Structure Break with Key Fibonacci Level in PlayThe NAS100 is now showing clear signs of strength, with a solid bullish move and a confirmed break of structure on the 4-hour timeframe 🚀. With this shift, the focus turns to how price behaves on the pullback.
The main level of interest is the 61.8% Fibonacci retracement of the current swing. A buy setup becomes valid only if price retraces and holds above the 61.8 level 🔥. Holding above this zone would indicate a shallow pullback — a strong sign that buyers are stepping in aggressively and maintaining control.
If price respects the 61.8 and then breaks structure to the upside again, that’s the confirmation needed to look for long opportunities 📊.
However, if price breaks below the 61.8 level, the idea is invalidated and should be abandoned. A deeper retracement may signal weakness, although it could also be a smart-money liquidity run before a continuation — either way, the priority is to see momentum hold above 61.8 to keep the bullish narrative intact ⚠️.
Not financial advice.

NASDAQNASDAQ Analysis – Possible Early Pullback Before New York Session
The Nasdaq may experience a short-term correction during the London session and pre–New York, especially after yesterday’s explosive 550-point rally driven by Nvidia’s strong earnings.
Price is currently sitting on the 0.786 Fibonacci level, which is acting as a strong support and has been respected multiple times. At the same time, the index is positioned just below the descending trendline formed from the recent highs.
The fractal structure has now been completed, suggesting we could see a small bearish move before the New York session potentially resumes the bullish trend.
If price fails to break below the 0.786 support and instead breaks above the descending trendline, we could see continuation to the upside, targeting 25,300 in the next impulsive leg.

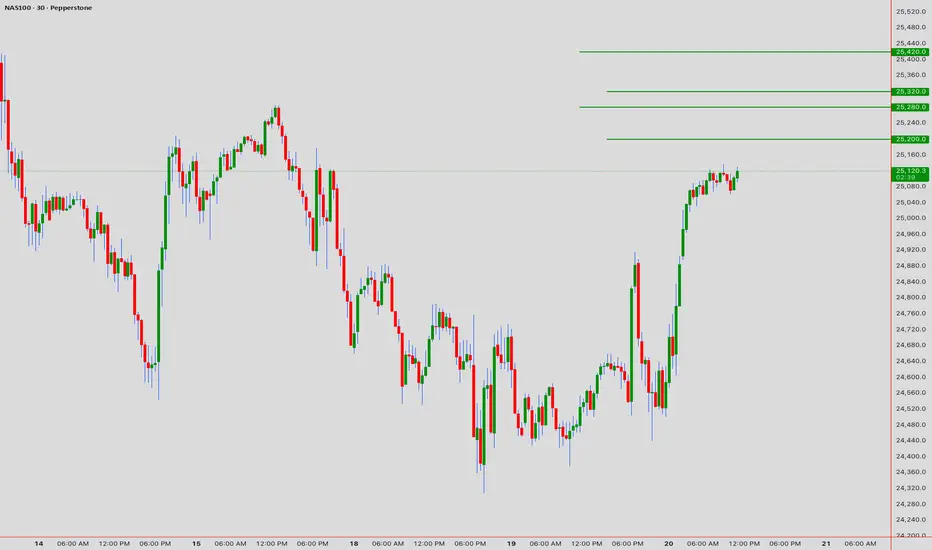
NAS100 Breakout Watch: Compression Before Expansion
The Nasdaq-100 index is trading at 25,130 , and the intraday price action is setting up what could be a high-probability move. Multiple technical frameworks are converging at a critical decision point. Let's dissect what's unfolding across the timeframes. 💹
Market Context & Structure
We're observing a Symmetrical Triangle pattern on the 1H chart that's been coiling for the past several hours. This compression zone between 25,080-25,185 represents a battleground between bulls and bears. The apex is approaching, which historically precedes volatility expansion.
From a Dow Theory lens, the intermediate trend remains bullish with higher highs and higher lows intact on the 4H timeframe. The recent pullback appears corrective rather than impulsive, suggesting the broader uptrend is still in play.
Wyckoff Analysis 📉
The overnight action exhibits classic Wyckoff accumulation characteristics within our consolidation range. We've seen:
Spring action down to 25,050 (stop hunt below support)
Absorption of selling pressure with diminishing volume
A Last Point of Support (LPS) forming around 25,090
This accumulation schematic suggests smart money positioning for the next markup phase.
Wave Count Perspective 🌊
Elliott Wave structure indicates we're likely completing a wave (4) triangle correction within a larger impulse. The internal labeling suggests:
Wave A-B-C-D-E triangle pattern nearing completion
Wave (5) target zone: 25,350-25,450
Invalidation level: Break below 25,020
The alternation principle supports this count, as wave (2) was a sharp zigzag, making a triangle for wave (4) textbook behavior.
Critical Levels & Zones 🎯
Upside Targets:
T1: 25,245 (initial resistance + prior pivot)
T2: 25,380 (Fibonacci extension 1.618)
T3: 25,525 (measured move from triangle)
Support Foundation:
S1: 25,085 (triangle baseline + EMA cluster)
S2: 25,020 (swing low + psychological)
S3: 24,890 (major demand zone)
Indicator Dashboard ⚡
RSI (1H): 52.4 - neutral, coiling with price
Stochastic: Curling up from 35, bullish crossover forming
VWAP: Currently at 25,118 acting as dynamic pivot
Ichimoku: Price inside the cloud (equilibrium), Tenkan/Kijun bullish twist imminent
Volume: Declining in range (typical pre-breakout behavior)
Harmonic Setup Recognition
A Gartley pattern completed at the 25,050 level with:
- X: 24,890
- A: 25,280
- B: 25,050 (0.618 retracement)
- D: PRZ achieved
This harmonic structure aligns perfectly with our Elliott wave count, adding confluence to the bullish thesis.
Actionable Trading Strategies 💼
Strategy 1 - Triangle Breakout:
Entry: 25,190 (break above triangle resistance + retest)
Target 1: 25,280
Target 2: 25,420
Stop: 25,080
Strategy 2 - Support Zone Buy:
Entry Zone: 25,085-25,095 (limit orders)
Target 1: 25,200
Target 2: 25,320
Stop: 25,035
Multi-Timeframe Sync 🕐
- 5M: Micro pullback entries and exits
- 15M: Trend confirmation via EMA alignment
- 1H: Primary pattern and trade direction
- 4H: Structural bias verification
The Bottom Line
NAS100 is coiled like a spring at 25,130. The technical evidence suggests accumulation is wrapping up, with multiple methodologies pointing toward upside resolution. The 25,190 breakout level is your line in the sand—above it, the path opens to 25,400+. Below 25,080 invalidates the immediate bullish setup.
Stay alert for the breakout, but don't force trades inside the range. Patience now equals profits later. ⚡
---
Risk Disclosure: Trading derivatives carries substantial risk. This analysis is educational only and not financial advice. Trade responsibly.
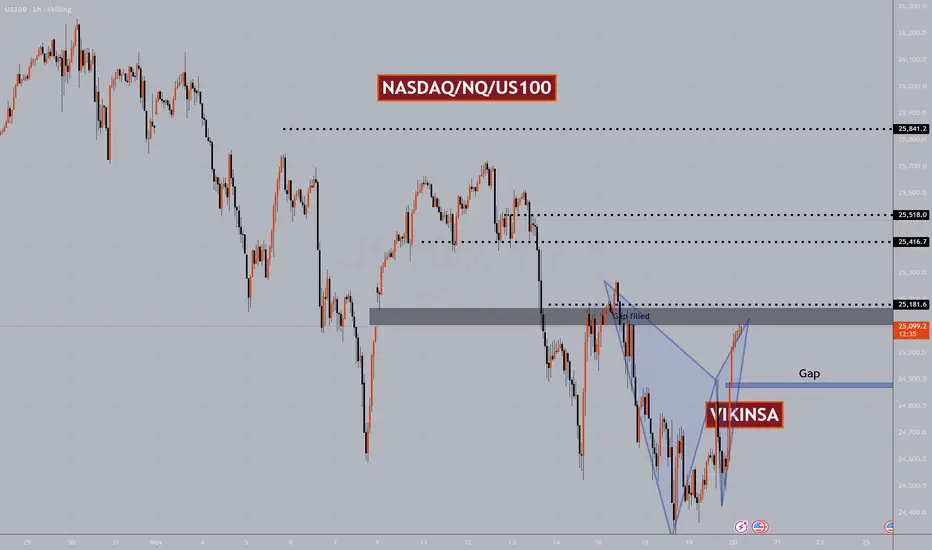
NASDAQ $NQ US100 Major Levels And PatternsNasdaq bounced yesterday heavily and completed a W pattern. I personally have been able to capture majority of this move. You can consider yesterday's W pattern a sort of double bottom which means hat more bullishness is expected in the medium term.
On a short term, now that it has completed a W pattern and reached previous important zone which had a gap, so we can expect a correction here but this may not be a big one. In a rare case there may not be any correction here at all because NASDAQ is forming a pattern which when forms usually ignores all the smaller W and M patterns.
For that reason my Bias is bullish and I will look for buying opportunities mostly.
There are certain Higher time frame levels that I am watching closely which you will find on the chart.
Trade what you see, manage the risk.
Follow for more. Please support this analysis by liking, commenting, and sharing with friends, colleagues, traders, and trading communities. Thanks👍🙂