NDX today is the day.🚀 Today is the day that marks a before and after. ⚡️🔥
We haven’t even tasted true tech-sector FOMO yet — not even close.
Right now we’re sitting in the same extreme fear zone we saw back in early April…
and you know exactly what happened next. 😉
Google is leading the charge, showing the path the entire index is meant to follow.
And tonight, NVIDIA provides the fuel ⛽🔥
The rest of the market will move to its rhythm — like an orchestra waiting for the conductor.
Make no mistake:
🎄🚀 A massive Christmas rally is coming.
The kind that leaves you speechless.
The kind people remember for years.
The kind that turns disbelief into FOMO… and FOMO into vertical candles.
Buckle up.
The real move is just beginning. 😉
🔥🚀📈
#TechRally #NVIDIA #GoogleLeading #FearToFOMO #SantaRally #MarketShift #NextLegUp
Trade ideas

USNAS1OO Appear Breakout phase, with bullish pressure building.The USNAS100 (NASDAQ 100) appears to be in a consolidation-to-breakout phase, with bullish pressure building.
U.S. stock index futures are advancing on Monday following positive developments in Washington toward ending the U.S. government shutdown the prolonged shutdown had delayed key economic data releases and increased uncertainty over growth. Renewed optimism for resolution has improved risk sentiment, prompting buying momentum in equity futures.
If price sustains above 25,000 and momentum continues, bulls could “shut down” the recent NASDAQ decline by pushing toward 25,750 – 26,005 a strong breakout with volume could trigger further upside toward 26,250–26,500, aligning with the next major resistance zone.
You may find more details in the chart,
Trade wisely best of Luck Buddies.
Ps; Support with like and comments for better analysis Thanks for Supporting.

Double zig-zag wavecountThe wavecount may be wrong, but I think we are still in wave Y. Maybe it will reach 24300 in it's final move down. Anyway it doesn't look like a reversal, this decline looks corrective.

NAS100 Trade Set Up Nov 14 2025I am expecting price to continue bearish to take out lower SSL but first i want to see a test of 1h FVG to then form internal IFVG/CISD to continue its bearish trend

NAS100 Trade Plan: Counter-Trend Opportunity Into Friday CloseI’m currently watching the NASDAQ NAS100 📊 and looking for a potential setup as we head into the Friday close. The market has pushed into the weekly low, and I’m anticipating the possibility of a retracement, which could offer a counter-trend opportunity during the New York session. 🚀📉📈 All details are broken down clearly in the video — this is not financial advice. ⚠️

NASDAQ Pressure Still to The DownsideI know many a people are anticipating new ATHs here but I beg to differ.
I think pressure to the downside will likely resume. I am just waiting patiently to see how far up the bullish correction goes so I can continue to short. Or alternatively, a break and retest of the current H1 support if price does not pull back up.
My overall bias is still bearish here.

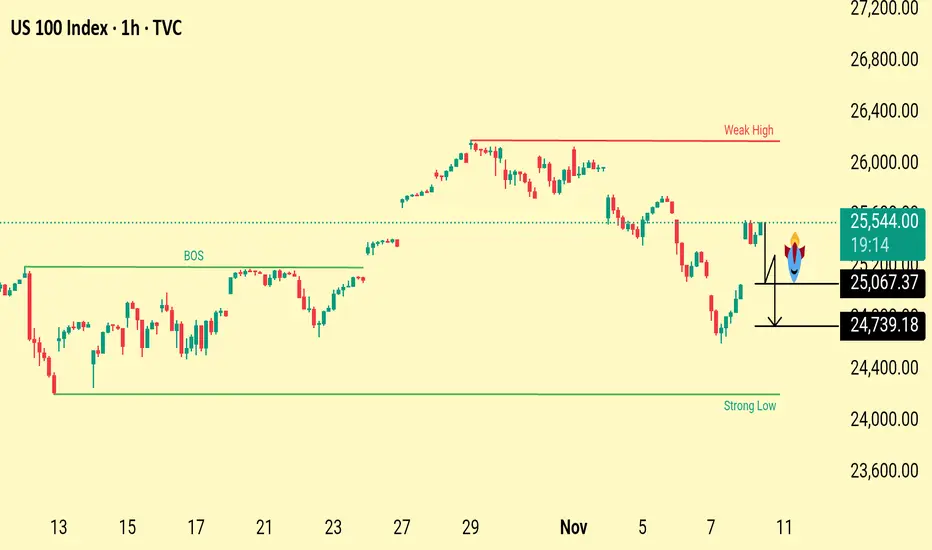
US100 Price Action Outlook Weak High Target&Liquidity SweepZonesThe chart highlights a weak high above current price action, suggesting potential upside liquidity targets. Below, key downside levels at 25,067 and 24,739 mark liquidity pools and possible retracement zones if price rejects current resistance. The structure shows a recent break of structure with both bullish and bearish scenarios in play.
Price is reacting near a resistance area after a recent bounce. The weak high above suggests liquidity may be targeted before any reversal. If price rejects this zone, the next downside levels to watch are 25,067 and 24,739, where liquidity sits and buyers may step in. Structure remains mixed, with both upward liquidity grabs and potential pullbacks likely
US100 (NASDAQ) - LONG IDEANAS hit its major support level and seems to be respecting that level, NASDAQ shifted its internal structure looking good to buy at the current price. Do your own analysis before taking any trade, this isn't a financial advise.

US100 (NASDAQ) — Daily CLS RangeUS100 (NASDAQ) — Daily CLS Range
Daily CLS ,
2nd candle is now complete, establishing the range.
On the 1H chart, a pullback into the BPR zone would provide a high-probability entry, supported by strong confluence at this level.
Target: Daily 50% midpoint at 25,287.6

NASDAQDO YOU KNOW WHATS BEHIND THIS OR OTHER IDEAS?? in bio..
Preferably suitable for scalping and accurate as long as you watch carefully the price action with the drawn areas.
With your likes and comments, you give me enough energy to provide the best analysis on an ongoing basis.
And if you needed any analysis that was not on the page, you can ask me with a comment or a personal message.
Enjoy Trading ;)

NASDAQ NAS100 Under Pressure – Watching for a Break of StructureThe NASDAQ is currently showing signs of weakness on the 4-hour chart. Sellers are gradually stepping in, and we can see US100 bearish momentum starting to take control. The market is under pressure, and price action is hinting at potential continuation to the downside.
I’ll be watching closely for a NAS100 break below the current range low — if price retests that level and fails to reclaim it, that would confirm a bearish market structure shift 🔻. Such a setup could provide a high-probability short opportunity as momentum accelerates to the downside.
⚠️ This is not financial advice — purely for educational and analytical purposes.

US100 – Consolidation Between FVGs, Watching for Bullish BreakouHello traders,
On the daily timeframe, NASDAQ (US100) is currently consolidating between a bullish and a bearish Fair Value Gap (FVG). Both sides present clear liquidity areas, and the market is preparing for its next directional move.
From my perspective, I’d like to see the price tap into the bullish FVG first, react from that zone, and then invalidate the bearish FVG on its way higher.
If this scenario plays out, the next targets would be the equal highs (EQH) and eventually a new all-time high (ATH).
However, if a daily candle closes below the bullish FVG, this idea becomes invalid and we could expect further downside movement.
For now, I remain bullish while the bullish FVG holds. 📈
💌It is my honor to share your comments with me💌
🔎 DYOR
💡Wait for the update!

Nasdaq Holds Firm After Support Rebound| Focus on 25820 BreakoutUSNAS100 | Overview
The price retested our support at 25430 and bounced perfectly, just as outlined in the previous analysis.
After reaching the resistance zone, the index is now consolidating between 25700 and 25820, awaiting a decisive breakout.
A 1H close above 25820 would confirm bullish continuation, targeting 25960 and 26170.
However, a 4H close below 25700 would indicate the start of a bearish correction, with downside potential toward 25570 and 25430.
Pivot Line: 25700
Resistance: 25820 · 25960 · 26170
Support: 25570 · 25430 · 25230
Outlook:
USNAS100 remains bullish while above 25700, with upside targets at 25960–26170.
A confirmed 4H close below 25700 would shift the short-term tone to a bearish correction toward 25570–25430.

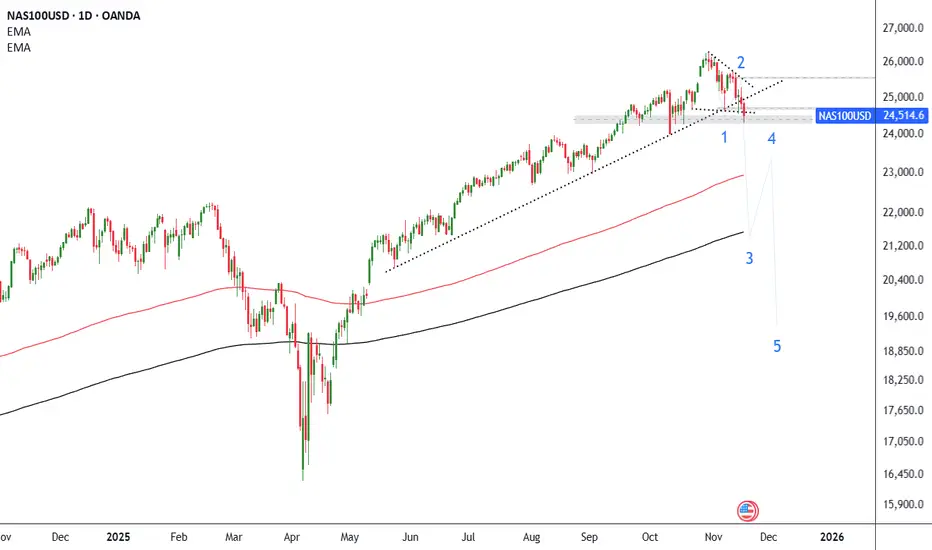
Nasdaq 100 Poised for a Deep Corrective Move After Breaking Key The Nasdaq 100 index has retreated toward a key area after a clear break below the ascending trendline that has held since mid-year, reinforcing expectations of a broader corrective wave. The current decline below the 25,000 – 24,600 zone indicates weakening bullish momentum, especially after breaking the previous low (Point 1), which supports the outlook for the index to move within a multi-leg bearish structure (five-wave decline).
The most likely scenario at this stage is a continued move lower toward the major moving averages, targeting the 22,800 – 22,200 zone as the first stage (Wave 3), followed by a limited rebound (Wave 4), before resuming the decline into Wave 5. This sequence would mark the beginning of a relatively deep correction compared to the prior bullish trend.
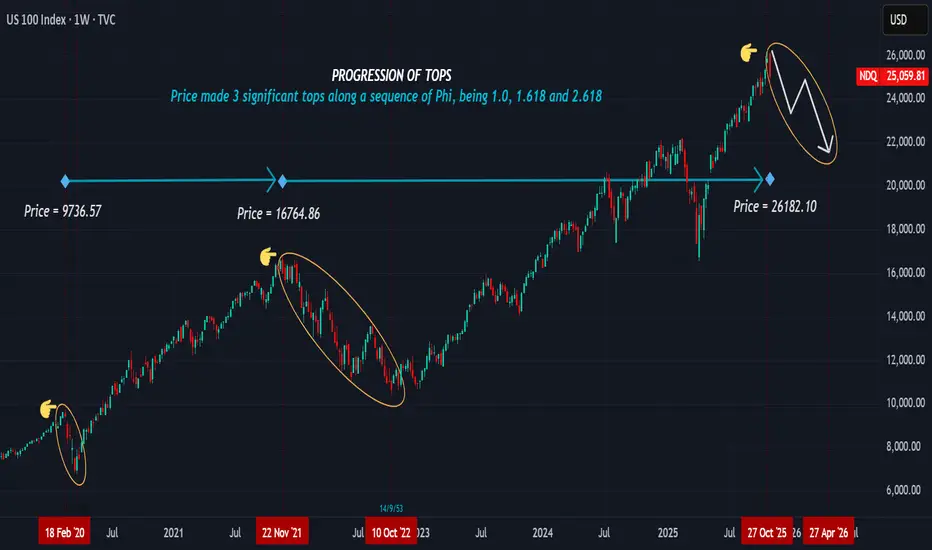
SHORT UNTIL LATE APRIL 2026OUR OBSERVATION
NASDAQ made three significant tops in its price action from 2009 to the present in a sequence of an expanding Phi.
February 2020 High = 9736.57 (This is the 1.0 growth level divided into a Log function)
(9736.57 / 10^4) = 0.973657 (Equivalent to 3/3 = 1.0)
November 2021 High = 16764.86
(16764.86 / 10^4) = 1.676486 ( This is the 5/3 Fibonacci sequence or a variation of 1.618)
Current High at 27th October 2025 = 26182.10
(26182.10 / 10^4) = 2.618210 (This level indicates the 8/3 growth sequence or 2.618 level)
TRADE PLAN
If we project a sequence of thirds, (1/3, 2/3, 3/3), then the three tops from 2009 made an expanding sequence along 3/3, 5/3, and 8/3 nodal points , at 9736.57, 16764.86 and 26182.10 levels respectively. Each node effected a correction, and by projection, we expect price to correct steadily until late April 2026. (1,2,3,5,8...) points form the price tops. The zone between 26182.1 and 26880.XX will be our confluence zone to expect a decline.
We projected the 27th October top as far back as April 2025, where we mentioned a broader cross assets decline. If we compare NASDAQ's price to SP-500 and DJIA, then we can create a larger sequence pattern. SP-500 top reached 6920.34 being 2/3 on the sequence while DJIA reached 48040.64, the 13/3 node. Several markets reaching tops at the same time cooks a sharp long decline. Therefore, we will keep short entries for all three markets until the tops break.
NOTE: We do not trade news effects, we only trade measurable facts the charts indicate. However, we look to the news for signals that add strength to our expectations.
Trade safe, good luck

NDXNDX has been moving within this upward channel since June...if it is still respected...it should bounce from here...

NAS100 Intraday Market Structure AssessmentActionable Trading Framework
Bullish Scenario (Probability: 60%)
Entry: 24,595-24,620 (consolidation breach confirmation)
Target 1:24,680 (+$62 risk/reward)
Target 2: 24,750 (+$132 profit extension)
Stop Loss: 24,550 (-$45)
Trigger: Break above 24,650 with volume confirmation on 5/15-min charts
Bearish Scenario (Probability: 40%)
Entry: 24,680-24,710 (rejection candle formation)
Target 1: 24,600 (-$80 to +$30 range)
Target 2: 24,520 (-$160 reversal)
Stop Loss: 24,760 (+$50)
Trigger: Failed breakout attempt + RSI divergence on 1-hour chart
Key Technical Confluences
✓ EMA 20/50 Crossover Zone → Dynamic support (1-hour timeframe)
✓ VWAP Alignment → Acts as pivot point at 24,635
✓ Harmonic Pattern → Potential bullish AB=CD completion near current zone
✓ Ichimoku Tenkan-sen → Resistance pressure at 24,705
Execution Rules
1. Entry Confirmation: Engulfing or Pin Bar + Volume Spike on 5-min chart
2. Risk Management: Maximum risk per trade = 1% account size
3. Time Window: Optimal trading 08:00-15:00 UTC+4 (high liquidity period)
4. Exit Protocol: Trail stop at 15-pips after Target 1 achievement

Market Watch: NASDAQ at a Critical JunctureToday, all eyes are on the NASDAQ as we head into a key earnings release. The index is approaching a pivotal short-term level — the 55-day moving average at 24,091, which aligns closely with the August high of 23,969. With the daily RSI nearing oversold territory around 30, there's a strong chance this level could hold on the initial test.
But here's the catch: the weekly chart is flashing warning signs.
🔍 The weekly RSI has already topped out, suggesting momentum is fading. If the 55-day MA doesn't hold, we could see a deeper pullback toward the 55-week moving average at 22,035, which also aligns with the late 2024 high of 22,222.
This level could be the litmus test for the broader bull trend. A weekly close below it would be a major technical breakdown — and let’s not forget, the NASDAQ often leads the S&P.
Stay sharp. The next few sessions could be decisive.
Not trading advice

Nasdaq 100 Rebounds as Traders Anticipate End of the US ShutdownNasdaq 100 Rebounds as Traders Anticipate End of the US Shutdown
As the chart shows, the Nasdaq 100 index has started the week on a positive note amid growing expectations that the longest government shutdown in US history may soon come to an end.
According to Reuters, a bill has been introduced in the Senate proposing amendments to extend government funding until 30 January. The news acted as a bullish catalyst for equity markets. Still, the question remains – is the risk truly behind us?
Technical Analysis of the Nasdaq 100
Analysing the hourly chart of the Nasdaq 100 on 4 November, we:
→ Drew an ascending channel;
→ Noted signs of momentum exhaustion, as mentioned in our previous headline.
Since then, price action has evolved as follows:
→ The lower boundary of the channel provided support (1), prompting a brief rebound;
→ The 25,770 level acted as resistance (2) on two occasions, strengthening the bears’ confidence to push for a downside breakout — which ultimately succeeded.
The index’s subsequent movements have now more clearly outlined the formation of a descending channel (shown in red).
From the demand-side perspective:
→ After a false bearish breakout below 24,680 (showing characteristics of a Liquidity Grab pattern), the market staged an aggressive rally from point B;
→ Today’s session opened with a bullish gap, and the price has moved above the red median line.
From the supply-side perspective:
→ The 25,500 level, where sellers gained control during the previous channel breakout, may now act as resistance;
→ If the A→B move is viewed as an impulse, today’s rally appears to be a corrective rebound consistent with Fibonacci proportions — suggesting that downward momentum could resume within the red channel.
This article represents the opinion of the Companies operating under the FXOpen brand only. It is not to be construed as an offer, solicitation, or recommendation with respect to products and services provided by the Companies operating under the FXOpen brand, nor is it to be considered financial advice.

Nasdaq slides down as markets wobbleNasdaq is being pushed down, driven by raising concerns about valuations of AI companies despite strong earnings from NVDA and other giants. Volatility (VIX) stays near 20 but the hard landing for Nasdaq might boost it and lead to another several days of bearish rally as shown at the chart. According to statistical studies, bearish swings for Nasdaq rarely last for more than 19-20 days, so if it continues to move down, it might reverse in 5-10 days at the statistic support level, as shown at the chart.
Don't forget - this is just the idea, always do your own reserch and never forget to manage your risk!

NAS100 Trade Secured 1500 PipsSet up played out perfectly BOS on the 1h during London session, fail to sweep SSL, 5m engulfing/CISD, to target BSL/PDH
