NAS100 Future | The Bullish Liquidity RuTrading isn't about chasing green candles; it's about anticipating where the "smart money" needs to go to fill their orders. On this NAS100 1H chart, we are stalking a potential Bullish Model #1 setup by waiting for price to revisit the discount zone.
Here is the CRT (Candle Range Theory) breakdown of the projected path:
1. The Trap: Turtle Soup at CRTL 🐢
The chart projects a drop below the CRTL (Candle Range Theory Low) at 24,664. This is the classic "Turtle Soup" mechanic.
The Logic: As the book states, "Turtle Soup is when the market tricks traders by briefly breaking through a level, then reversing".
The Goal: Smart money needs to "run stops... below old lows" to accumulate a long position. We want to see price stab this low to trap late sellers.
2. The Confluence: Fair Value Gap (FVG) 🧲
Notice that the sweep of the lows aligns perfectly with a Bullish FVG (the grey box).
Why it matters: "When Model #1 appears with an FVG... it becomes even more powerful". This gap acts as a magnet to pull price down before the real expansion begins.
3. The Objective: CRTH 🎯
If the trap is set and price reclaims the level (confirming the reversal), the draw on liquidity becomes the CRTH (Candle Range Theory High) at 25,307.
The Cycle: Market moves from range to manipulation (Turtle Soup) to trend. The target is simply the opposing side of the range.
🧠 Trader's Mindset: "Patience is your greatest trading asset". Right now, the chart suggests we are in the waiting phase. Do not try to catch the falling knife. Wait for the sweep of the CRTL, look for the strong reaction (Model #1 confirmation), and then execute.
Disclaimer: This analysis is based on Candle Range Theory concepts for educational purposes. Past performance is not indicative of future results.
Next Step: Set an alert at 24,720. Are you watching for the sweep or buying the dip early? Let me know your plan below! 👇
Trade ideas

NASDAQ Analysis – Accumulating at Resistance With Bullish CorrelThe Nasdaq is currently accumulating right beneath a key resistance zone, showing strength despite last week’s volatility. A positive factor heading into today’s session is Bitcoin’s strong weekend recovery — a move that often correlates with green momentum in equity markets, especially tech.
If the Nasdaq manages to break this resistance with conviction, price could push toward the 25,000 trendline during the week, as we are still roughly 2.5% below that level.
The ideal scenario would be:
A strong breakout,
A clean retest of the broken resistance acting as new support, and
A controlled long-position continuation toward 25,000.
As long as accumulation holds and risk sentiment stays positive, the bias remains bullish — waiting for confirmation and a structured entry.

Nasdaq Short: Ride the wave 3 of 3 of 3In this video, I updated the Elliott Wave counts for Nasdaq and shows how wave 3 has formed as a series of sub-waves. I also showed that the last wave up (wave 2 of 3 of 3) was stopped at 50% retracement of wave 1 of 3 of 3. So my expectation is that next week we are going to crash in a wave 3 of 3 of 3.
Set the stop for this idea will be above wave 2 of 3 of 3 (around $24,540).
Good luck!

Next NAS100 TPVolume remains steady, which confirms the reliability of the ongoing trend.
These combined technical factors typically precede price appreciation in the Nasdaq 100 , suggesting the index will likely continue to declineshortly based on trend-following and momentum-based trading strategies with limited immediate overbought risk.

NAS100 Trade Secured 1500 PipsPrice swept SSL in London session and continued to make HL internally so i expected price to continue higher

NAS100 – Strong Order Block Explained | High-Volume Breakout & CA Strong Bearish Order Block formed on NAS100 after a powerful bearish Marubozu breakout candle, showing clear displacement and confirming aggressive institutional selling pressure.
1. Large Breakout Candle (Marubozu)
A strong bearish candle broke through previous structure with real displacement.
This is the first sign of a valid Order Block — a move driven by actual institutional flow, not just a liquidity sweep.
2. Clean Imbalance (IMB) Created
Right after the breakout, price left behind a clean Imbalance.
This IMB highlights urgency and confirms that big players were actively pushing the market.
3. Price Returned to the Strong Order Block
After the breakout, price slowly retraced back to the origin of the move — the Strong Order Block.
Once price tapped the OB, it reacted sharply and immediately moved lower, showing that institutional sellers were defending this level.
4. Volume Confirmation
Volume during the breakout was significantly higher than average.
This reinforces that the move was driven by institutional order flow, not retail traders.
🔑 Key Takeaways
This setup is a textbook Strong Bearish Order Block, meeting all core criteria:
Clear displacement
Clean Imbalance formation
Strong volume confirmation
Price returning to the OB and reacting decisively
A high-probability bearish setup built on structure, volume, and institutional footprints.

Bullish signalsThe price is bouncing from 100-day EMA and VWAP from late June low on US100 chart (not on NDX though). WXY correction structure looks complete. It can still go lower to test 0.618 fib from August 1 low to top or August 13 peak. RSI shows 2h bullish divergence on all Nasdaq and S&P500 charts. A reversal to new ATH is highly probable from this area (or atleast a high bounce to draw another right shoulder).

NAS100 Professional Technical Analysis
Asset: NAS100 (CFD SPOT INDEX)
Current Price: 24,434.00
Date: November 24, 2025
Market Sentiment: The NAS100 is currently testing a critical psychological barrier at the 24,450 level. Volatility is expected to increase as we approach the US session open.
📊 Technical Indicators & Trend Analysis
Trend Direction: The primary trend remains BULLISH 🐂 on the 4H timeframe, though signs of exhaustion are appearing on the 15m chart.
Relative Strength Index (RSI): Currently reading at 72.5 , indicating overbought conditions. A divergence is forming, suggesting a potential short-term pullback before continuation.
Bollinger Bands: Price is hugging the upper band, with a "squeeze" formation likely resolving in a high-momentum breakout or rejection.
📐 Fibonacci & Harmonic Patterns
Fibonacci Retracement: Key support lies at the 0.382 level (24,380) and the Golden Pocket 0.618 level (24,310) from the recent swing low.
Harmonic Pattern: A potential Bearish Bat Pattern is completing near 24,460. This harmonic reversal zone (PRZ) aligns with our immediate resistance.
🛡️ Support and Resistance Levels
Resistance 1: 24,460 (Daily High / Harmonic Completion)
Resistance 2: 24,525 (Weekly Extension)
Support 1: 24,380 (0.382 Fib)
Support 2: 24,310 (Key Pivot Zone)
🎯 Trade Setup & Forecast
Scenario A: Reversal (Short)
If price rejects 24,460 with bearish engulfing candle:
Entry: Below 24,440
Target 1: 24,380
Target 2: 24,310
Stop Loss: 24,485
Scenario B: Breakout (Long)
If price closes above 24,465 on 1H volume:
Entry: Retest of 24,465
Target: 24,550
Stop Loss: 24,420
⚠️ Summary: Watch for a reaction at the 24,460 zone. The confluence of the Bearish Bat pattern and RSI overbought conditions favors a short-term correction, but the overall trend remains strong. Trade with caution. 📉📈

US100 Reversal Map – Hull MA + Heikin Ashi Confirmation🧠 US100 / NASDAQ100 Profit Pathway Setup — The Thief’s Bullish Escape Plan! 💰🚀
📊 Market Bias: Bullish (Day Trade Setup)
The Thief Trader has spotted a golden pathway in the NASDAQ100 (US100)!
Here’s the breakdown of the plan — straight from the thief’s vault 🕵️♂️📈
🎯 Plan Overview
Bias: Bullish continuation confirmed
Technical Confirmation:
✅ Double Pullback on Hull Moving Average
✅ Retest Zone successfully defended
✅ Heikin Ashi Bullish Doji signaled a trend reversal confirmation
💡 Momentum is shifting upward — the trend has officially changed!
💎 Entry Strategy (Layered Thief Style)
The Thief Strategy applies a layered entry method — multiple buy limits to average into strength.
📥 Buy Limit Layers:
25,300
25,400
25,500
25,600
(Traders can adjust or add more layers based on risk appetite and confirmation zones.)
🛡️ Stop-Loss Setup
This is the Thief SL @ 25,100
⚠️ Note to Thief OG’s:
I’m not recommending my SL as your SL — always customize risk and secure your own bag. Manage your position with discipline and independence! 💼
🎯 Take-Profit Zone
Target: 26,200
🚨 The Police Barricade Zone acts as a strong resistance — overbought levels spotted and potential bull trap alert!
Kindly exit with profit before the officers arrive. 😎
⚠️ Note: Profit-taking is at your discretion. Book and Run!
📈 Related Pairs to Watch (Correlation Insight)
NASDAQ:NDX / CAPITALCOM:US100 / NASDAQ:QQQ : All mirror NASDAQ movement.
SP:SPX / AMEX:SPY : Often correlate with NASDAQ’s momentum (watch divergence for clues).
TVC:VIX : If volatility spikes, expect pullbacks on tech-heavy indices.
TVC:DXY : A weak dollar often fuels US100 bullish legs — keep an eye on it.
NASDAQ:AAPL / NASDAQ:MSFT / NASDAQ:NVDA : Leading drivers of NASDAQ — if they pump, the index follows. 💪
🧩 Key Insights
Hull MA alignment confirms momentum shift.
Retest + bullish Heikin Ashi Doji = market reversal confirmation.
Layered entries give flexibility in volatile intraday conditions.
Dynamic risk management is key — never marry a position.
✨ “If you find value in my analysis, a 👍 and 🚀 boost is much appreciated — it helps me share more setups with the community!”
#US100 #NASDAQ100 #ThiefTrader #DayTrading #IndexTrading #HullMA #HeikinAshi #LayeredEntries #TechnicalAnalysis #TradingSetup #PriceAction #MarketReversal #TradingCommunity #BullishPlan #SmartMoneyFlow #TradeIdeas #ThiefStrategy

Nasdaq The #1 Fear Of Investors BuyingLet me tell you what i did
i searched google and then i type
fear and greed index of the stock market
A page appeared and i saw the link
it took me to a famous
news website
where i saw something very shocking.
The gauge was on extreme fear.
The last time this appeared was in April
of 2025.
Now look at this chart on top..
You will see the RSI
its in the buying channel
because its oversold
This channel is showing
you the right place to buy this stock at a affordable price.
The main stream media
and your favourite Guru
is not talking about this
market recovery
Because its not easy to see unless you
understand trading systems.
Am ready to buy this
are you?
Rocket boost this content to learn more
Disclaimer: Trading is risky please learn risk management and profit
taking strategies.Make sure
you use a simulation trading account before you
trade with real money.

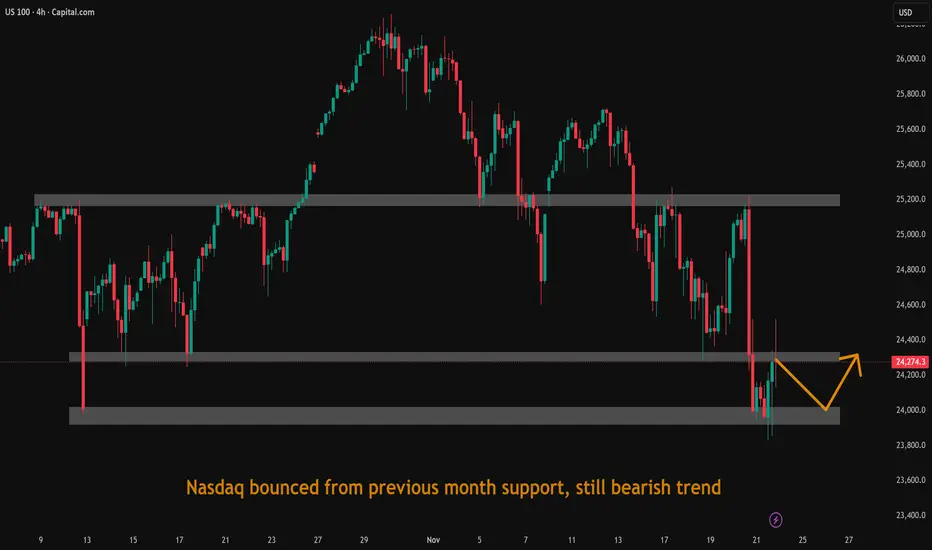
Nasdaq bounced from previous month support, still bearish trendNasdaq bounced from previous month support, still bearish trend.
NASDAQ Week 32 OutlookOn the US Nas 100 1-hour chart, a bearish breakout from a symmetrical triangle suggests downward momentum. The Fair Value Gap at 23,500.0 is a pivotal level—watch for a breakout and retest here to confirm sell entries. Aim for the target at 22681.1, with a stop-loss at 23,740.4 to protect against adverse moves.

NASDAQ: Got a A plus Setup for the Nasdaq 100, Just long and chiNasdaq index seems like buy the dip and forget... NASDAQ: Got a A plus Setup for the Nasdaq 100, Just long and chi

NAS100 1:1.5 RRThis is a trade idea, posting for future reference
not to be taken as financial advice

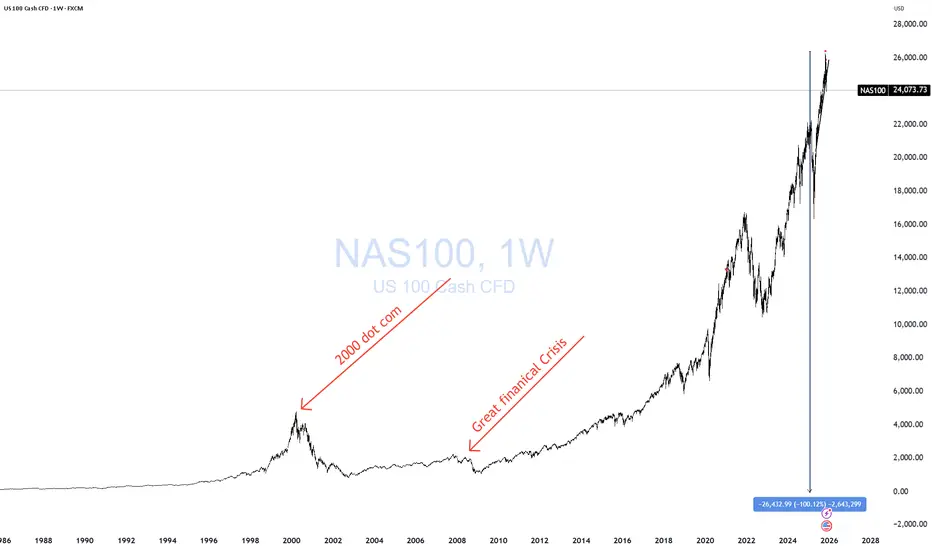
NDX - 92% From ZeroI want you to always remember one thing:
Wherever the price goes, it’s always 100% from zero.
That’s why every now and then you need to take the chart off log and look at it with fresh eyes.
Occam’s razor.
I keep hearing the PERMA-BULL crowd screaming that “the bears are calling this an AI bubble,” and in the same breath whining that the pullback is “overdone” or “extreme.”
Really?
The S&P is down 5%, and they’re already crying about the bears?
SMH.
It’s all strawman nonsense. Don’t fall for it.
Take it off log…
Remember everything is 100% from zero…
Use your basic, instinctive judgment…
And then ask yourself what your eyes are telling you when you look at this chart.
That’s the truth — not the narratives.
THANK YOU for getting me to 5,000 followers! 🙏🔥
Let’s keep climbing.
If you enjoy the work:
👉 Boost
👉 Follow
👉 Drop a solid comment
Let’s push it to 6,000 and keep building a community grounded in truth, not hype.
NAS100 Trade Opportunity: Will Buyers Defend the Pullback?📊 NAS100 (NASDAQ-100) Swing Trade Opportunity 🚀
Bullish Pullback Setup | Super Trend ATR + TMA Confirmation
🎯 TRADE SETUP OVERVIEW
Instrument: NAS100 (NASDAQ-100 Index)
Timeframe: Swing Trade (4H-Daily)
Bias: BULLISH ✅
Setup Type: Super Trend ATR Line Pullback + Triangular Moving Average (TMA) Confirmation
🎬 ENTRY STRATEGY - "LAYERING METHOD" 📍
This strategy employs multiple limit order placement (Layer Entry Technique) to optimize entry points during the pullback phase.
Recommended Layer Entry Points:
🔵 Layer 1: 24,500
🔵 Layer 2: 24,600
🔵 Layer 3: 24,700
🔵 Layer 4: 24,800
⚡ Pro Tip: Scale layers based on your account size and risk tolerance. Each layer reduces average entry price.
🛑 STOP LOSS (SL)
Primary SL Level: 24,300
Strategy: Placed below the latest swing low + Super Trend confirmation
⚠️ DISCLAIMER: This SL is a guideline only. You must adjust based on your personal risk management strategy and account equity. Risk is YOUR responsibility.
🎁 PROFIT TARGETS (TP)
PRIMARY TARGET (TP1): 25,700 🎯
First resistance zone
Ideal for taking partial profits
Recommended exit: 30-50% position
SECONDARY TARGET (TP2): 26,200 🔥
Strong resistance + Historical overbought zone
⚠️ TRAP ALERT: Expect potential reversal or consolidation
Recommended exit: Remaining 50-70% position
Use trailing stop for final portion
📈 TECHNICAL CONFIRMATION
✅ Super Trend ATR: Aligned bullish
✅ TMA (Triangular MA): Pullback to key level confirmed
✅ Higher Lows Pattern: Intact
✅ Volume Analysis: Supporting move
🔗 RELATED PAIRS TO WATCH 💡
Positive Correlation (Move Together):
🔴 SPY (S&P 500 ETF) - $380-395 Range
Correlation: +0.92 | Often leads NAS100 lower-cap stocks
Key Point: If SPY breaks $390, expect NAS100 momentum confirmation
Watch for divergence signals
🔴 QQQ (Invesco QQQ Trust - Nasdaq 100 ETF) - $450-470 Range
Correlation: +0.99 | DIRECT tracking of NAS100
Key Point: Primary barometer for Nasdaq sentiment
Use for volume + volatility confirmation
🔴 TECH Sector ETF (XLK) - $205-215 Range
Correlation: +0.88 | Tech-heavy holdings overlap
Key Point: Tech rotation affects Nasdaq flow
Monitor for sector strength/weakness
Inverse Correlation (Move Opposite):
🔵 DXY (US Dollar Index) - $103-106 Range
Correlation: -0.65 | Stronger dollar = Risk-off mood
Key Point: If DXY spikes, expect NAS100 pullback extension
Monitor Fed rate expectations
🔵 TLT (20+ Year Treasury ETF) - $75-80 Range
Correlation: -0.58 | Rising yields hurt growth stocks
Key Point: Check 10Y yield trend for rate pressure
Watch Fed policy announcements
Key Monitoring Points:
📌 Earnings Season Impact: Tech earnings can create ±2% moves
📌 Fed Minutes/Announcements: Watch for rate guidance changes
📌 Market Breadth: Compare Advance/Decline lines for confirmation
📌 Volatility Index (VIX): Levels above 20 = Caution; Below 15 = Risk-on
📋 BEFORE YOU TRADE - CHECKLIST ✅
Is price currently at/near Layer 1 entry (24,500)?
Does current 4H chart show TMA pullback + Super Trend confluence?
Is volume confirming the setup?
Have you set your SL below 24,300?
Do you understand you're risking X to make Y?
Is this aligned with your trading plan?
🎓 FINAL NOTES
This is a mechanical swing trade setup designed for traders who use limit orders and layering technique. The confluence of Super Trend ATR + TMA creates higher probability entries during bullish pullbacks.
Remember: Trading involves substantial risk of loss. This idea is shared for educational analysis. Your trading decisions are YOUR responsibility alone.
Happy Trading! 🚀💎

USNAS100 –Key Breakout Levels | Bearish Below 25100 Ahead of NFPUSNAS100 | OVERVIEW
NASDAQ futures surged as Nvidia’s strong earnings eased concerns of an AI-driven market bubble, boosting overall tech sentiment.
Markets are now shifting attention to the NFP and U.S. jobs report, with expectations of elevated volatility throughout the NY session, especially given Nvidia’s strong influence on tech stocks.
Technically:
Below 25100: Bearish continuation toward 24880 → 24760 → 24350
Above 25215: Bullish breakout toward 25430 → 25650 → 25700
Pivot: 25100
Support: 24880 · 24760 · 24350
Resistance: 25220 · 25430 · 25650
USNAS100 stays bearish under 25100; only a confirmed close above 25215 will signal bullish continuation.
Rising Expanding Wedge BreakdownI’ve spotted this expanding wedge pattern on the Nasdaq and there is probably more downside imminent for the Nasdaq. I'm sure this isn’t new to most of you. A bearish price target around 23,000 (for now) is highly likely. Long-term I remain bullish (see my other ideas), but right now the extreme fear is handing control to the bears for a while.

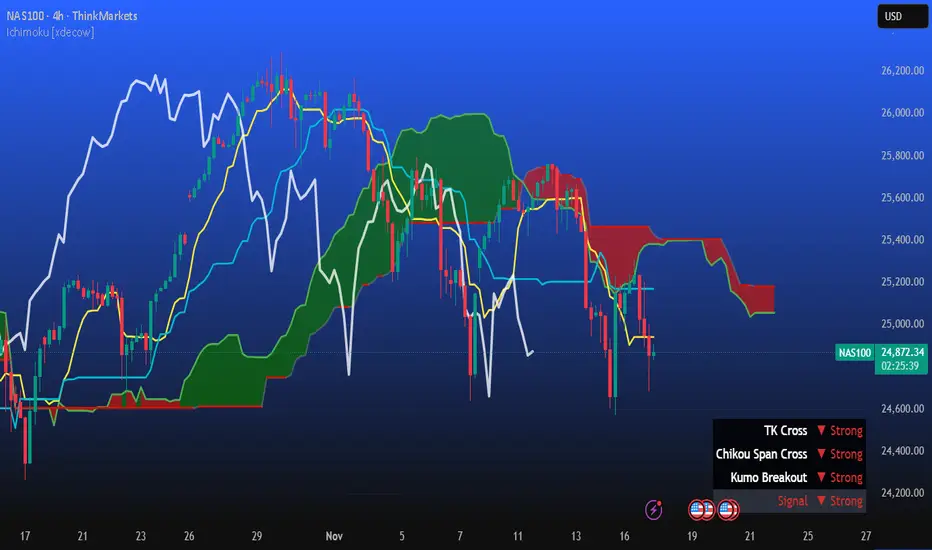
NAS100 - Waiting for buy setup on 4hr timeframeTimeframes Used: Monthly → Weekly → Daily → 4H
Current Market Condition:
Nas 100 is a valid trade according to my system rules:
Monthly: Price is above the Cloud → Bullish
Weekly: Price is above the Cloud → Bullish
Daily: Price is above the Cloud → Bullish
----------------------------------------------------------------------------------------------------------------
What I’m Waiting For:
I’ll be watching for the next 4H breakout opportunity.
Price to break above the 4hr timeframe.
Washout before santa rallyUS 100 Trade Plan - The December Washout
The Thesis We are trading a technical rotation within a seasonal washout. The market is currently undergoing its annual tax loss harvesting phase which typically pressures prices until mid-December. Technically we have printed a Lower High on the Daily chart and the Daily footprint shows clear signs of buying exhaustion. This is not a market crash it is a healthy pullback to fair value before the Santa Rally kicks in later this month. Im anticipating a HL to be formed on the daily chart which plays into the bullish trend.
1. The Setup (Short Rotation) On the 4-hour chart. We broke the local uptrend and established a Lower High around 25,700. The key signal here is the rejection from the Value Area High further up near the manipulation zone. When the market rejects the highs it usually rotates back to the Point of Control.
The Volume Signal: The Daily footprint confirms this idea. We saw positive Delta of +7K today yet price went nowhere and closed as a doji. That is a massive divergence. Buyers are spending money but passive sellers are absorbing everything. Plus the buying Delta has been decaying for three days straight which means the bulls are tired.
2. Execution Strategy I am splitting the entry to manage the risk of a stop hunt while ensuring I get filled on the move down.
Entry (Limit): Short 50% size at 25,750. There is a bearish supply zone and a Fair Value Gap sitting right there. If they try to run the stops above the recent highs I want to sell into that liquidity grab. then increase sizing if we close below 25500 after this rejection.
Stop Loss: Hard stop at 25,920. This clears the bearish gap and the recent daily wick. If we close above this the absorption failed and the structure is back to bullish. Note my outlook is still bullish overall, im thinking we will print HL after this LH. Any price movement above 25900 invalidates this idea. I am still long from 24000 level as my long term entry with trailing SL. This is solely for swing setups
3. The Target (The Flip Zone) I am taking profit at the top of the accumulation zone we identified on the 4-hour chart.
Take Profit: 25,160 to 24,800.
Reasoning: This green box on the chart is concrete support. We saw a Wyckoff Spring event here in late November where price dipped and violently reclaimed the level. That tells me institutions are defending this area.
4. The Reversal (Santa Rally) This short is just the bridge to the real trade. Once we hit that 25,290/25160 pocket I am closing all shorts and watching the footprint for absorption.
If I see aggressive selling with negative Delta but price refusing to go lower that is my trigger to flip Long. That will mark the higher low on the Daily chart and the start of the end of year rally.
Summary Short the tired buyers at 25,700/25800 down to the institutional buy zone at 25290/ 25,160. Bank the cash and wait for the signal to ride the trend into 2026.

Nq longIf price goes back down, i'll likely take this trade. seems strong volume here, plus Japan likely to buy NQ too in their morning.
if price goes back all the way all time high, cancel this trade.

Nasdaq breakout around the corner?The Nasdaq is pushing higher as weaker US employment data boosts risk sentiment and fuels expectations that the Fed will move ahead with rate cuts. With softer labor figures reducing pressure on monetary policy, investors are rotating back into growth and tech names, supporting the broader index. The year-end rally narrative is strengthening as well, with many market participants positioning early for seasonal upside.
Lower Treasury yields are adding momentum, making equities relatively more attractive and encouraging capital to flow back into high-beta sectors. Corporate earnings remain solid in key industries, which helps stabilise sentiment after recent volatility. On top of that, easing geopolitical tensions and improved liquidity conditions are giving markets another tailwind. Market breadth has been expanding too, indicating that the upside is supported by more than just a handful of mega-caps.
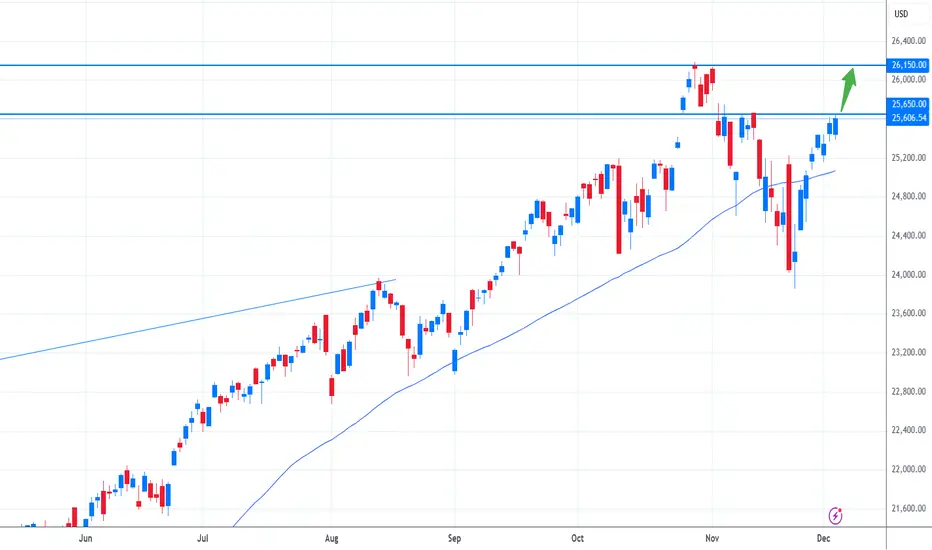
From a technical perspective, the critical level to watch is the 25,700 zone. A clean break above this resistance could trigger further upside and potentially send the index toward its old all-time high. Until that breakout occurs, short-term pullbacks are still possible, but the broader setup continues to point toward a constructive outlook as long as the index holds above key support areas.
NAS100 – Riding the Channel: Will Price Respect the MidlinePrice continues to move cleanly inside the long-term ascending channel, with the midline acting as dynamic support throughout the past week. Each retest of the dashed median line has produced bullish continuation, but momentum is starting to flatten at the upper boundary.
Key Observations:
Price is currently hovering near the upper half of the channel, showing signs of exhaustion.
The dashed median line has been respected repeatedly — a key structure level to watch.
Bullish structure remains intact as long as price stays above the recent internal higher-low zones (highlighted in green).
MACD shows slowing momentum despite higher prices, signalling a possible pullback into channel support before continuation.
Levels to Watch:
Bullish continuation: If price holds above the midline, we could see another leg into the upper boundary of the channel.
Pullback zone: Watch for a corrective move into the lower channel support if buyers fail to sustain momentum.
Invalidation: A clean break below the channel would shift bias to short-term bearish retracement.
This structure is still very clean — waiting for either a respectful retest or a decisive breakout.
📌 Bias
Bullish overall structure, but expecting a short-term pullback before continuation.
