US30 showing signs of potential bullish momentumThe US30 index is currently in a phase of price consolidation, showing signs of potential bullish momentum. The recent strong upward movement indicates that buyers are regaining control, and there’s a possibility of further growth continuation if bullish momentum sustains.
On Wednesday, Wall Street’s main indices inched higher following a stronger-than-expected private payrolls report. Additionally, ongoing U.S. tariff court hearings boosted investor sentiment. Meanwhile, technology stocks stabilized after the previous session’s sharp sell-off, helping to support broader market optimism.
If the price reacts positively and rebounds strongly to the upside, we could expect the bullish trend to resume. The next psychological resistance level to watch would be around 47,800, which could act as a potential upside target for bullish traders.
You may find more details in the chart,
Trade wisely best of Luck Buddies.
Ps; Support with like and comments for better analysis Thanks for Supporting.
Trade ideas

DOW JONES approaching the end of its Bull Cycle?Dow Jones (DJI) has been trading within a 16-year Channel Up ever sine the March 02 2009 market bottom of the U.S. Housing Crisis. As this chart shows, we have divided this pattern into three different phases.
Since the March 2020 COVID crash, it appears that the Cycle got restarted as the index broke below its 1W MA200 (orange trend-line) again after 10 years. Technically that was the only time that multi-year Support trend-line broke in 15 years.
In any case, following that Cycle 'restart', it appears that the index is currently inside the Megaphone pattern that in 2015 concluded Phase 2. The conclusion came with a second test on the 1W MA200 (Double Bottom). The first test was the April 07 2025 Low.
With their 1W RSI sequences also identical, having the first 1W MA200 forcing a 30.00 (oversold) RSI rebound, we expect the index to start a new Bearish Leg that might potentially test the 1W MA200 around 39000. For long-term investors, that is the market's next Buy Entry.
-------------------------------------------------------------------------------
** Please LIKE 👍, FOLLOW ✅, SHARE 🙌 and COMMENT ✍ if you enjoy this idea! Also share your ideas and charts in the comments section below! This is best way to keep it relevant, support us, keep the content here free and allow the idea to reach as many people as possible. **
-------------------------------------------------------------------------------
💸💸💸💸💸💸
👇 👇 👇 👇 👇 👇

US30 Eyes 47,200 for Potential BounceHey Traders, in today’s trading session we’re monitoring US30 for a potential buying opportunity around the 47,200 zone.
The Dow Jones continues to trade in a broader uptrend, and price action is currently in a correction phase, approaching the 47,200 support and resistance confluence area — a key zone where buyers may look to step back in.
Watching for a bullish reaction at this level to confirm continuation of the prevailing trend.
Share your view below — do you think US30 holds this zone or breaks lower?
Trade safe,
Joe.

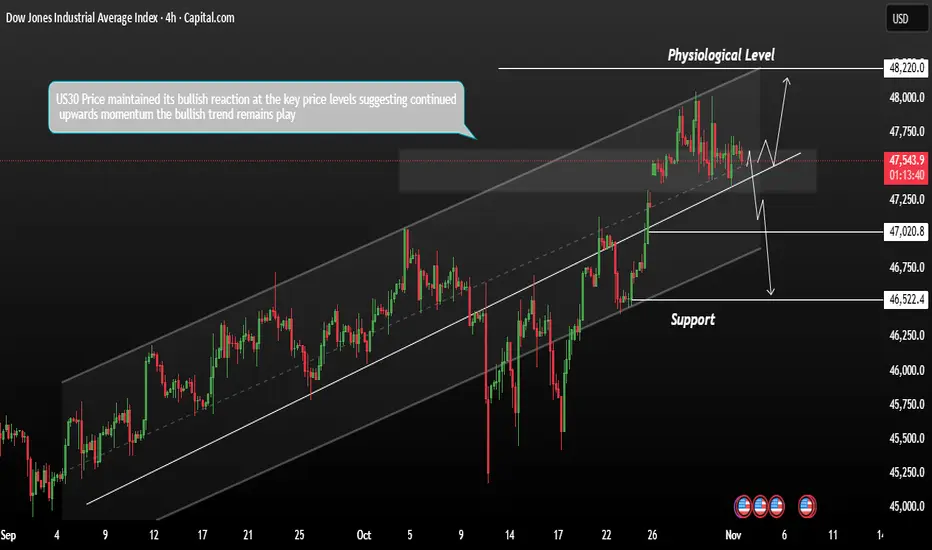
US30 Technical Outlook – Bullish Momentum IntactThe US30 maintained its bullish reaction at key price levels, suggesting continued upward momentum. As November begins, the index futures gained on Monday, supported by optimism around U.S.–China trade relations and stronger demand sentiment.
Currently, the bullish trend remains in play. If price continues to react positively to current support zones, we could see a potential move toward the next major psychological resistance level at 48,220.
However, if price fails to hold above current levels and we see a bearish reaction, a pullback could be triggered toward the support area between 47,030 and 46,520.
You may find more details in the chart.
Trade wisely best of Luck Buddies,
Ps; Support with like and comments for better analysis Thanks for Supporting.
Dow Jones – Bearish Leg Expected Toward 46,500
After several attempts to hold above the 48,000 zone, the **Dow Jones Index (US30)** is showing clear signs of exhaustion on the higher timeframes.
The current market structure suggests a potential **corrective move toward 46,500**, which aligns with the 0.618 Fibonacci retracement level and previous demand zone.
If the 47,800–48,000 resistance area continues to hold, sellers are likely to push the price lower in the coming sessions.
A clean break below **47,200** could confirm further downside momentum.
⚠️ I’ll be watching the 46,500 area for potential reversal signals or signs of accumulation.
---
#US30 #DowJones #DJI #Index #Trading #MarketStructure #TechnicalAnalysis #PriceAction #Bearish #Forex

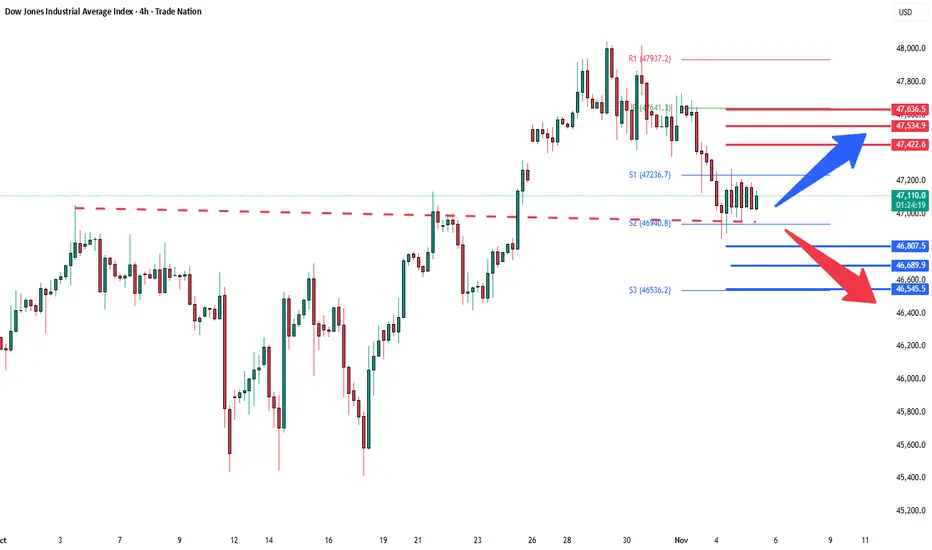
DowJones strong support retest Key Support and Resistance Levels
Resistance Level 1: 47433
Resistance Level 2: 47534
Resistance Level 3: 47636
Support Level 1: 46807
Support Level 2: 46690
Support Level 3: 46545
This communication is for informational purposes only and should not be viewed as any form of recommendation as to a particular course of action or as investment advice. It is not intended as an offer or solicitation for the purchase or sale of any financial instrument or as an official confirmation of any transaction. Opinions, estimates and assumptions expressed herein are made as of the date of this communication and are subject to change without notice. This communication has been prepared based upon information, including market prices, data and other information, believed to be reliable; however, Trade Nation does not warrant its completeness or accuracy. All market prices and market data contained in or attached to this communication are indicative and subject to change without notice.
Golds overperformance relative to the Dow will be dramatic !!The place to invest during the following decade is gold!!
The Dow Jones is projected to lose 96% relative to gold from now until August 2036!! (if history repeats itself as it did in 1968-1980).
In 12 years time, the DOW to GOLD ratio is expected to reach 0.44.
By 2026, we will be able to sell our gold by buying the Dow with less than half an ounce of gold (currently, it takes 12 ounces of gold to buy the Dow).
We're talking about a 24x outperformance!!
DO NOT ignore the historic break down in the stock market relative to gold which is happening right now !! For those who think that the gold bull is over: it is just about to start !!
This is a ratio graph, so don't get me wrong: the DOW could still hit 100'000 USD but that would imply that Gold would rise above 100'000 USD an ounce !

US30: Bulls Are Winning! Long!
My dear friends,
Today we will analyse US30 together☺️
The recent price action suggests a shift in mid-term momentum. A break above the current local range around 47,172.59 will confirm the new direction upwards with the target being the next key level of 47,302.90 and a reconvened placement of a stop-loss beyond the range.
❤️Sending you lots of Love and Hugs❤️

Is a Market Correction Coming? 10 Warning Signs You Can’t Ignore🚨 Markets look euphoric… but data says otherwise.
Hello @TradingView users, hope you are doing well
Here are 10 reasons why we think a sharp pullback could be near
(Not financial advice — just signals stacking up.)
1) Record yield-curve inversion: The 10y–2y spread was negative for a record ~783 days before ending in Sept 2024; such inversions have preceded every U.S. recession in recent decades.
2) Q1 2025 GDP dipped, Q2 rebounded: BEA shows real GDP fell in Q1 2025 (revised −0.6%), then rose +3.8% in Q2 2025. One more weak quarter would meet the “technical” definition, but Q2 strength complicates that path.
3) Cuts usually come with stress: Markets are pressuring the Fed to cut; historically, rate-cut cycles often start when growth/inflation risks tilt weaker (not typically in “booming” conditions).
4) LEI turned down again: After a tiny July uptick, the Conference Board’s LEI fell −0.5% in Aug 2025 and is −2.8% over the last 6 months, pointing to softer momentum (the “15+ straight months” stat is no longer current).
5) Valuations are stretched: The Shiller CAPE > 40, the highest since the dot-com era—historically linked to weaker forward returns.
6) Labor market showing cracks at the margin: Unemployment ~4.3% (Aug 2025) and job openings ~7.2M (Aug)—down from the 2022 peak—suggest some cooling, even if not severe. (I removed the unsourced “+35% layoffs” figure.)
7) Buffett’s record cash: Berkshire now holds roughly $381–$382B in cash & T-bills, an all-time high—interpreted by many as “waiting for better prices.” (Replaces the older $347.7B figure.)
8) Government shutdown risk/drag: The U.S. is in a prolonged federal shutdown (30+ days), with credible estimates of a material GDP hit if it persists—an added macro headwind.
9) Parabolic leaders, dot-com déjà vu vibes: Today’s rally is narrow and AI-led, and valuation gauges echo late-1990s extremes—a setup that can amplify drawdown risk on disappointments.
markets.businessinsider.com
10) Clustering of risks: Yield-curve history + LEI weakness + stretched valuations + policy uncertainty = elevated correction risk, even if timing is uncertain.
Please be cautious, more signals are starting to align, suggesting a potential market drop. From Warren Buffett holding significantly more cash, to the ongoing government shutdown, and even the recent sharp rally that mirrors patterns seen right before the dot-com bubble, the puzzle pieces are starting to fit together.
This message isn’t to cause panic, but rather to remind you to trade carefully and stay prepared either by keeping some cash ready to invest if the market drops, or by simply sticking to your existing long-term investment plan if you have any.
Comment below what YOU think, is this a healthy dip incoming or the start of something bigger?
@TradingView Appreciate it if you guys can feature this post so more traders and investors get the warning and stay safe if the drop happens.
Thank you
Alain M(Coach)
WTW Team
NYSE:DOW NASDAQ:NDX SP:SPX

US30 - Potential TargetsDear friends in trading,
As long as equities are making HH's it's going up...
The yellow line will serve as breakout support for the new ATH.
Keynote:
The government shutdown has the markets uneasy and unpredictable - BE SAFE
Thank you for taking the time to study my analysis.

DOW JONES recovered and is looking for a High at 48500.Exactly 2 weeks ago (October 22, see chart below), we gave a strong Buy Signal on Dow Jones (DJI), as the index had already initiated the new Bullish Leg of its 6-month Channel Up and quickly hit our 47700 Target:
That trading plan included a 2nd Target as well at 48500, which represented a +7.50% rise from the October 10 Low, which was a Higher Low for the Channel Up on its 1D MA50 (blue trend-line).
As Target 1 was on the 1.382 Fibonacci extension, the recent pull-back was technically expected as the sequence was similar to those of August 22 - September 02 among others. As you can see, all minor pull-backs that took place within this Channel Up, hit the 4H MA100 (red trend-line) and rebounded. Major ones found support lower on the 1D MA50, as did the October 10 Low.
Since the index hit yesterday its 4H MA100 and is rebounding today, the Bullish Leg remains valid and on the medium-term can reach our final 48500 Target.
-------------------------------------------------------------------------------
** Please LIKE 👍, FOLLOW ✅, SHARE 🙌 and COMMENT ✍ if you enjoy this idea! Also share your ideas and charts in the comments section below! This is best way to keep it relevant, support us, keep the content here free and allow the idea to reach as many people as possible. **
-------------------------------------------------------------------------------
💸💸💸💸💸💸
👇 👇 👇 👇 👇 👇

US30 Looking bearish trend a short-term ForecastThe US30 index has retested its recent highs, and a short-term pullback appears likely as the new trading week begins.
Technically, price action suggests that after reaching the top once again, the index may retrace to recover lost ground. Local investors are closely watching the midweek release of September economic data, which will provide further insight into the Federal Reserve’s potential interest rate path. Market participants largely anticipate a rate cut later this week, which could inject renewed volatility into equities.
The market opened with a gap, indicating possible short-term indecision If the gap is filled, a rejection from resistance could trigger a decline toward the support zone between 46,800 and 46,000 Sustained buying pressure above resistance would invalidate the bearish setup and could signal further upside momentum.
You may find more details in the chart.
Trade wisely best of Luck buddies.
Ps; Support with like and comments for better analysis Thanks for Supporting.

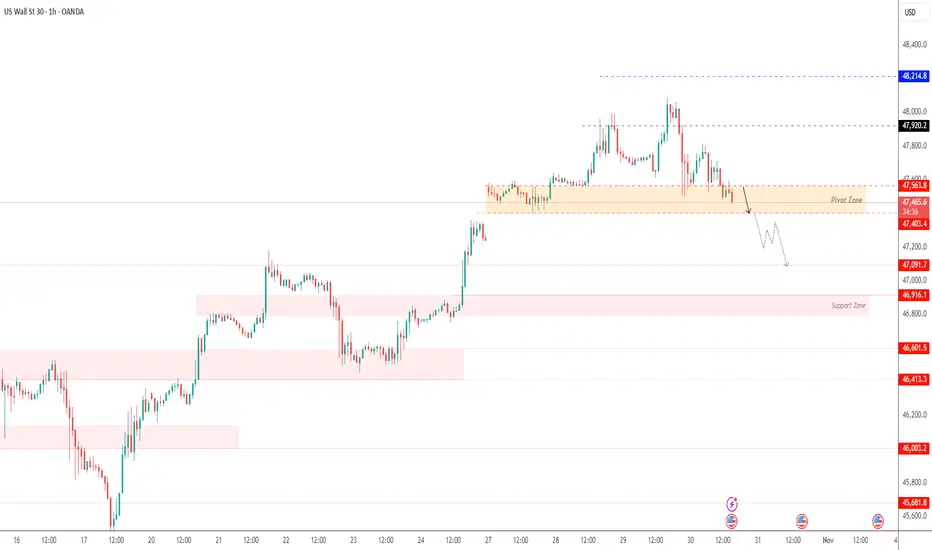
US30 | Dow Jones Extends Gains Above 47,565 SupportUS30 – MARKET OUTLOOK | Bullish Momentum Holds Above Pivot Zone 🇺🇸
The Dow Jones remains bullish after stabilizing above the pivot line at 47,565, supported by positive sentiment in earnings and broader risk appetite.
🔼 Above 47,565: Bullish bias toward 47,760 → 47,920 → 48,040.
🔽 Below 47,565: Bearish correction toward 47,460 → 47,250 → 47,100.
Pivot: 47,570
Support: 47,460 · 47,250 · 46,920
Resistance: 47,760 · 47,920 · 48,040
US30 stays bullish while above 47,565, but a break below could trigger a short-term pullback toward lower supports.

US30 - Bearish Momentum Extends After 1.5% DropUS30 – MARKET OUTLOOK | Bearish Momentum Extends After 1.5% Drop 🇺🇸
The Dow Jones remains under pressure after a sharp 1.5% decline, with sellers maintaining control in the short term.
🔽 Below 46,920: Bearish continuation toward 46,800 → 46,600 → 46,410.
🔼 Above 46,920: Bullish recovery toward 47,100 → 47,440.
Pivot: 46,920
Support: 46,790 · 46,450 · 46,020
Resistance: 47,100 · 47,440 · 47,560
US30 stays bearish while below 46,920, but a confirmed 1H close above this level could shift tone to bullish in the near term.

US30 – Correction Toward 47100 | Next Leg Up Toward 47920US30 – MARKET OUTLOOK | Bullish Bias Above 47100
US30 is showing a mild bearish correction after facing resistance near 47460, but the broader structure remains bullish while price holds above 47100.
🔼 Above 47460: Bullish continuation toward 47750 → 47920 → 48200.
🔽 Below 47100: Bearish correction possible toward 46920 → 46600.
Pivot: 47430
Support: 47100 · 46920 · 46600
Resistance: 47750 · 47920 · 48200
US30 stays bullish while above 47100, but a confirmed close below this level could trigger a short-term bearish correction toward 46920.

US30 - Testing Key Support Zone Amid Bearish PressureUS30 – MARKET OUTLOOK | Testing Key Support Zone Amid Bearish Pressure 🇺🇸
The Dow Jones is testing the 47,400 support zone, with downside pressure still dominant.
A 1H close below 47,400 would confirm continuation toward 47,090 → 46,920.
However, a 1H close above 47,620 may trigger a bullish rebound toward 47,920 → 48,000.
Pivot: 47,565
Support: 47,400 · 47,100 · 46,920
Resistance: 47,670 · 47,920 · 48,000
US30 remains bearish below 47,565, but a breakout above 47,620 could shift momentum to bullish.
US30(SHORT)
Us30 resecting trendline.
Rejected at resistance of trendline.
Expecting long term shorts

Dow Challenges 4-Year ResistanceFrom a monthly perspective, and filtering out short-term noise using the line chart, the Dow’s price action has been contracting since its bullish rebound from the 2020 lows, with overbought momentum previously recorded in November 2024 and April 2021.
This setup highlights the potential for long-term reversal risks near the upper boundary — specifically along the trendline connecting consecutive higher highs from November 2021 through November 2024.
If the trend extends beyond the 48,000 resistance, further advances could target 48,400 and 49,000, with 51,000 seen as an extreme projection before another major correction phase.
Conversely, a confirmed hold below 46,900 would indicate renewed pressure, potentially driving prices toward 46,600 and 46,200, where a technical rebound could occur.
If not, a deeper retracement toward the 45,000 region (previous significant resistance of 2025) may emerge.
Written by Razan Hilal, CMT

us30bias: sell
setup EW (Ride Wave 5)
EP: fvg-h4 (pening US Open)
SL: Previous Daily High
TP: Previous Daily Low

Us30 long US30 (Dow Jones Index) – Market Outlook & Trade Setup
Currently observing a potential bullish reaction from the demand zone around the 47,500 region after multiple rejections at this level.
If price maintains above this support, I’m anticipating a continuation toward the 48,180 area — aligning with prior liquidity and supply levels.
This setup combines:
• Structure confirmation from previous higher lows
• Demand zone retest for potential entry
• Clear risk-to-reward framework with defined targets
Patience and precision remain key. Let’s see how price action develops going into the next session. 📊
#US30 #MarketAnalysis #TradingInsights #DowJones #TechnicalAnalysis #FinancialMarkets

Bullish bounce off?DJ30 is falling towards the support level, which is a pullback support that aligns with the 38.2% Fibonacci retracement and could bounce from this level to our take-profit.
Entry: 47,0090.29
Why we like it:
There is a pullback support that aligns with the 38.2% Fibonacci retracement.
Stop loss: 46,642.72
Why we like it:
There is an overlap support that is slightly below the 50% Fibonacci retracement.
Take profit: 48,056.22
Why we like it:
There is a swing high resistance level.
Enjoying your TradingView experience? Review us!
Please be advised that the information presented on TradingView is provided to Vantage (‘Vantage Global Limited’, ‘we’) by a third-party provider (‘Everest Fortune Group’). Please be reminded that you are solely responsible for the trading decisions on your account. There is a very high degree of risk involved in trading. Any information and/or content is intended entirely for research, educational and informational purposes only and does not constitute investment or consultation advice or investment strategy. The information is not tailored to the investment needs of any specific person and therefore does not involve a consideration of any of the investment objectives, financial situation or needs of any viewer that may receive it. Kindly also note that past performance is not a reliable indicator of future results. Actual results may differ materially from those anticipated in forward-looking or past performance statements. We assume no liability as to the accuracy or completeness of any of the information and/or content provided herein and the Company cannot be held responsible for any omission, mistake nor for any loss or damage including without limitation to any loss of profit which may arise from reliance on any information supplied by Everest Fortune Group.

Potential bullish bounce off?Dow Jones (US30) has bounced off the pivot, which is a pullback support and could rise to the 1st resistance, which is a swing high resistance.
Pivot: 46,869.22
1st Support: 46,429.35
1st Resistance: 48,012.20
Disclaimer:
The above opinions given constitute general market commentary, and do not constitute the opinion or advice of IC Markets or any form of personal or investment advice.
Any opinions, news, research, analyses, prices, other information, or links to third-party sites contained on this website are provided on an "as-is" basis, are intended only to be informative, is not an advice nor a recommendation, nor research, or a record of our trading prices, or an offer of, or solicitation for a transaction in any financial instrument and thus should not be treated as such. The information provided does not involve any specific investment objectives, financial situation and needs of any specific person who may receive it. Please be aware, that past performance is not a reliable indicator of future performance and/or results. Past Performance or Forward-looking scenarios based upon the reasonable beliefs of the third-party provider are not a guarantee of future performance. Actual results may differ materially from those anticipated in forward-looking or past performance statements. IC Markets makes no representation or warranty and assumes no liability as to the accuracy or completeness of the information provided, nor any loss arising from any investment based on a recommendation, forecast or any information supplied by any third-party.

