WALLSTREETCFD trade ideas

US 30 Potential ShortHi Traders
1.Ascending channel
2.Bearish Impulse
2.Lower time frame correction structure
When we see a clear break out from the corrent structure followed by a smaller continuation correction we can expect the next bearish move

CHART BREAKDOWN US30: Key Levels, Targets and Thoughts!Trade Update: US30
We have some great news on our recent US30 trade! 💲
After analyzing the market conditions and identifying a solid setup, our trade has successfully Hit Take Profit 1 (TP1). This made sure that the majority of our positions have been secured and cashed out some of our gains, allowing us to lock in profits and reduce risk.
Following this, we moved our stop loss to breakeven to ensure no loss on the remaining position. This strategy not only protects our capital but also gives us the opportunity to capture further potential gains with zero risk on the table and cashing out on TP2s and TP3s.
Stay tuned for more updates and happy trading! 🚀


US30 06+06+2024 The Probable FallThis is an overall view of the trader H4Hubert.
As shown, US30 showing weakness to go higher.
Let's see what happens.


US30 - Under ADP PressureUS30
The price reached their resistance which is 38790 after realizing Job opening negatively,
Today the market will move under ADP pressure which expected with Negativity for USD, that means will support more bullish for indices
However, the price will try to do a retest till 38580 and then will consolidate between 38580 and 38790 till breaking.
Bullish scenario: stability above 38790 means uptrend to get 39050 and 39350
Bearish scenario: the price should break 38580 to get 38400 and then stability under 38400 means will be a downward area.
Pivot line: 38790
Resistance line: 39050, 39360, 39780
Support line: 38580, 38400, 38050
Today’s movement will be between support 38400 and Resistance 39350


US 30 - Ranges overview We just got the NY open and we've now taken both sides of the market.
Watch how we react from the 15min breaker (blue box)
Don't hesitate to zoom out for the HTF sellside liquidity and buyside liquidity.
Stay safe and never risk more than 1-5% of your capital per trade. The following analysis is merely a price action based analysis and does not constitute financial advice in any form.

Trading hours/ Trading scheduleWhy is it Important to Have a Clear Trading Schedule?
Avoid Costly Mistakes: When you're tired, you're more likely to make errors that could cost you money.
Market Expectations: Market behavior can vary greatly depending on the time of day and market hours, so it's essential to plan accordingly.
Market Hunts: Certain times of the day are prone to market hunts, where sudden movements can make it hard to control outcomes.
Opening Opportunities: Each market opening presents its own opportunities and challenges.
Time Zone Considerations: Your time zone and personal preferences might not align with every market opening, so it's crucial to choose your trading times wisely.
When Do I Trade? (GMT+2)
London late Session/ NY preopening: 12:00 - 1:30 PM
London-New York Overlap: 4:00 - 7:00 PM
Chart Analysis for the Next Day: Around 9:00 PM, sometimes with overnight trades if I see opportunity.
When Are the Hunts? (Avoid trading at those hours)
0:30 - 2:00 AM
8:30 - 10:00 AM
1:30 - 3:00 PM
8:30 - 10:00 PM
When Are the Best Hours in General?
Apart from evening sessions, consider trading during:
Asian Session (Tokyo-Sydney Overlap): 3:00 - 6:00 AM
London (-Opening): 7:00 - 8:30 AM and 10:00 - 11:00 AM
Having a structured trading schedule helps you stay focused, reduces errors, and maximizes your chances of success in the market. Happy trading!

US30 ( UPWARD)US30
Tendency the price is a long pressure in between 38,680 and 38,560
Turning level : The turning level between 38,680 and 38,560 so as long as the price above this level, there will be a bullish trend , but braking 38,569 , the price comes downward pressure
resistance level : trade above turning level between 38,680 and 38,560 , the price will rise to 39,015 and 39,185
support level : braking a turning level 38,560, the price will reach the support level of 38,280
and 37,940
corrective level : price will attempt between 38,680 and 38,560 , correct itself before long

US30 Will Grow! Long!
Please, check our technical outlook for US30.
Time Frame: 1D
Current Trend: Bullish
Sentiment: Oversold (based on 7-period RSI)
Forecast: Bullish
The market is trading around a solid horizontal structure 38,715.0.
The above observations make me that the market will inevitably achieve 39,991.0 level.
P.S
Please, note that an oversold/overbought condition can last for a long time, and therefore being oversold/overbought doesn't mean a price rally will come soon, or at all.
Like and subscribe and comment my ideas if you enjoy them!

US30Waiting on price to retest support, filling the spike just below current price and tapping new zone created below the spike to go long #Ib_Firm.


Buy US30 at Blue Lines Break out structure, also trendline has been broken. Market is going to fill up the trend line

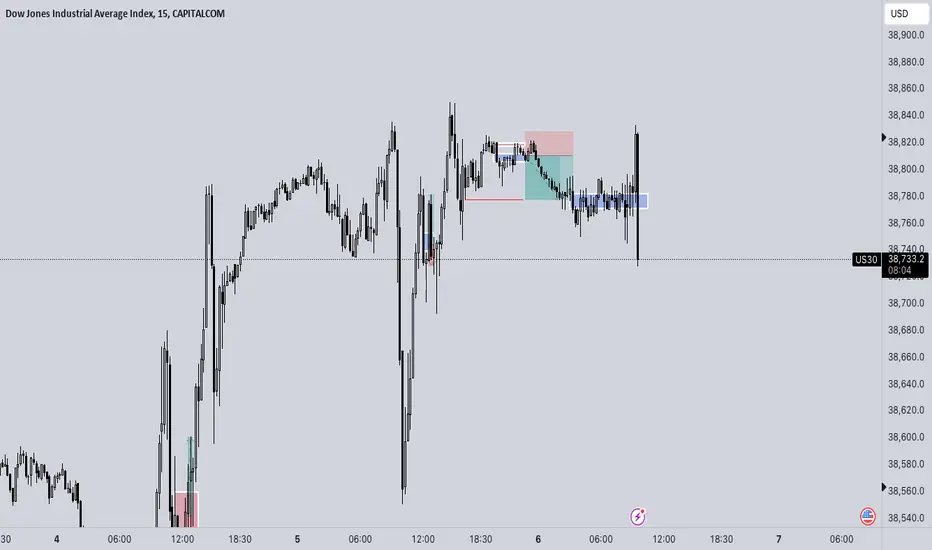
US 30 short - swing trade Taken a nice swing short on US 30
Entry 38810
TP 38777
SL 38828
Entered on on the 15min inverted FVG after a bit of drawdown as we went back into the 5min imbalance (red box) trapping the bulls before heading towards the 30min buyside liquidity sitting around 38777
As long as we do not close back above 38777 expect some further pa to the downside
Stay safe and never risk more than 1-5% your capital per trade. The following analysis is merely a price action based analysis and does not constitute financial advice in any form.

DowJones ready to Sell Dear Traders,
we are in correction phase (Dowjones), and i expect price will move down to 37700 Area,
What you think about my idea?
dont Forget Like &Comment please !
Regards,
Alireza!

US30US30 is looking in Bearish Trend as it is printing HH and HL
Order type : Buy stop
Entry : 38574.62
SL : 38233.57
TP1 : 39456.99

Trade Like A Sniper - Episode 20 - DJI - (6th June 2024)This video is part of a video series where I backtest a specific asset using the TradingView Replay function, and perform a top-down analysis using ICT's Concepts in order to frame ONE high-probability setup. I choose a random point of time to replay, and begin to work my way down the timeframes. Trading like a sniper is not about entries with no drawdown. It is about careful planning, discipline, and taking your shot at the right time in the best of conditions.
A couple of things to note:
- I cannot see news events.
- I cannot change timeframes without affecting my bias due to higher-timeframe candles revealing its entire range.
- I cannot go to a very low timeframe due to the limit in amount of replayed candlesticks
In this session I will be analyzing the Dow Jones Industrial Average Index (DJI), starting from the 6-Month chart.

DOW in H4 chart Hello
I have published my idea about DOW in an another chart and that's following our forecasts step by step, but I have decided to show you a little more detailed chart in EW aspect.
This is a simple model of Elliott counting that happens so common but there are some good points that's worth to be mentioned.
1. Alternation between (A) and (B) is "pattern".
2. The reactions to the cannel's midline can make it more valid.
3. almost always MACD and RSI tell you the truth but if you have an standard set up
4. be aware of fake weak shadows
5. ?
There is a unique analytical structure that can happen very rarely and it is mentioned in the chart; could you tell me what it is!!!!!
For trading set up: you have to wait till trend meet the confirmation or invalidation levels.
Thanks

CHART BREAKDOWN US30: Key Levels, Targets and Thoughts!Brief Description🖊️:
The chart provides insights into critical market levels, emphasizing an essential supply zone (low-risk sell zone) spanning from 39.030 to 39.130. Additionally, one low-risk buy zone between 38.160-18.100, respectively, is highlighted.
Things I Have Seen👀:
Important Supply Zone🟢: Identified between 39.030 to 39.130, serving as a low-risk sell.
Important Demand Zone🟢: Identified between 38.160-18.100, serving as a low-risk buy.
Bullish Targets📈:
38.300: Possible retracement area.
38.550: Possible retracement area.
38.800: Possible retracement area.
39.030: Significant supply zone.
Ultimate Target: 39.130- Liquidity area.
Bearish Targets📉:
38.900: Possible retracement area.
38.730: Possible retracement area.
38.480: Possible retracement area.
38.160: Essential Demand Zone
Ultimate Target: 38.050- Laying Low Liquidity
What's Important Now❗
Currently, the crucial approach is to wait and observe the price action at this level. We need to assess how the market reacts before considering any decisive moves. Stay observant and responsive to real-time developments in the market.

Dow Jones - All time high and 20% rally?Hello Traders and Investors, today I will take a look at the Dow Jones .
--------
Explanation of my video analysis:
For more than a decade, the Dow Jones has been trading in a rising channel formation. We had the first retest of support and resistance back in 2011 and ever since this was a massively profitable channel pattern. With the recent breakout above the $35.000 resistance level, the Dow Jones clearly looks like the next target is once again the upper resistance of the channel.
--------
Keep your long term vision,
Philip (BasicTrading)
