Dow Jones support levels to watchThe Dow was the star of the show yesterday. After chopping sideways for a few days above the 45,000 mark – a crucial resistance level taken out back in late August – we’ve finally got that breakout everyone was waiting for. Thursday's push through the resistance around 45,760 is a strong signal that the bulls are still in charge. As long as we hold above that level on any retest, the uptrend looks very healthy. If we slip back below, yes, things could get a bit messy, but honestly, the broader structure still screams bullish. The 45,000 level remains the real line in the sand – lose that and the tone changes, but for now, I’d be surprised if we don’t see higher highs from here.
By Fawad Razaqzada, market analyst with FOREX.com
WALLSTREETCFD trade ideas

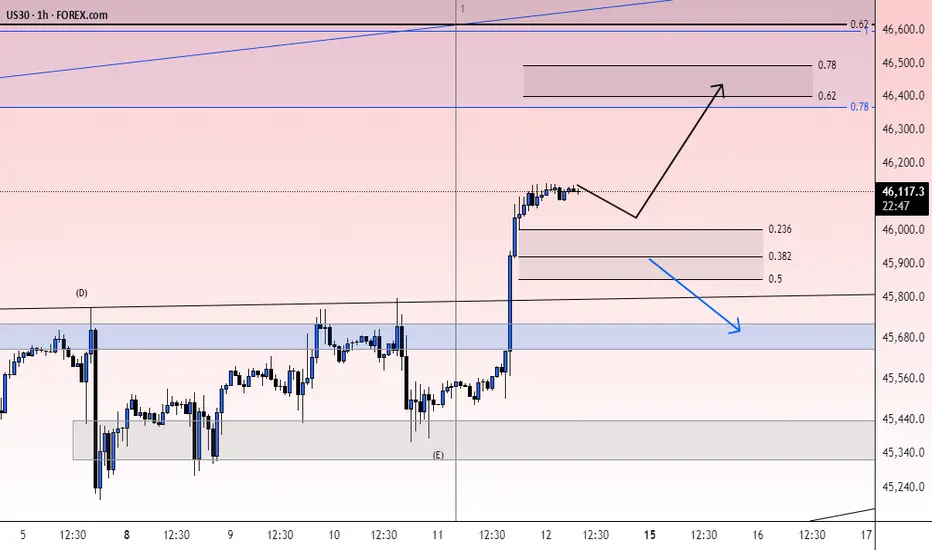
DOW JONES INDEX (US30): To the New Highs
Dow updated the all time high again yesterday.
A broken structure and a solid rising trend line will compose
a significant contracting demand zone from where I will look for buying.
The next resistance will be 46350.
Wait for a retracement first, and anticipate more growth then.
❤️Please, support my work with like, thank you!❤️
I am part of Trade Nation's Influencer program and receive a monthly fee for using their TradingView charts in my analysis.

US30, Selling pressurePotential market reversal on US30. H1 showing sell opportunities for Intraday Trading despite bullish market trend on H4 and long term.

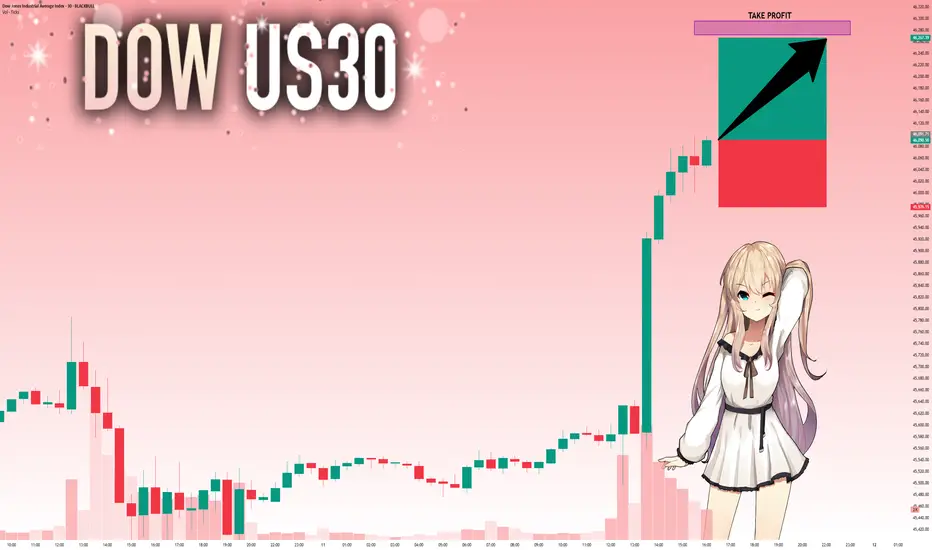
uptrend After the amount of correction and fluctuation to the support levels, the trend change will take place in four forms and we will see a continuation of the upward trend.
US30: Will Go Up! Long!
My dear friends,
Today we will analyse US30 together☺️
The recent price action suggests a shift in mid-term momentum. A break above the current local range around 46,091.71 will confirm the new direction upwards with the target being the next key level of 46,272.39 and a reconvened placement of a stop-loss beyond the range.
❤️Sending you lots of Love and Hugs❤️
US30 Technical Breakdown – 09/11/2025📍 US30 Technical Breakdown – 09/11/2025
US30 has finally broken out 🚀 after weeks of coiling below the 45,760 ceiling. Bulls smashed through resistance and printed new highs around 46,100, confirming strong upside momentum.
This breakout clears a major liquidity zone, putting buyers in full control. If price can hold above 45,760, we could see continuation into fresh territory.
📊 Current Market Behavior:
🚀 Clean breakout above 45,760 supply
📈 Momentum accelerating with strong bullish candles
🧱 Previous resistance now acting as new support (45,760 zone)
⚠️ Watch for retest before continuation
📌 Key Levels:
🔹 Resistance Zones:
46,100 → Fresh breakout high
46,250 → Expansion target
46,400 → Next resistance
🔹 Support Zones:
45,760 → Key breakout retest level
45,456 → Intraday demand
45,320 → Structural support
44,988 → Strong floor
🧠 Bias:
✅ Bullish above 45,760
Continuation higher likely if breakout holds
Pullback into 45,760–45,500 could offer re-entries
DOW30/US30 ANOTHER OPPORTUNITY TO SHORTTeam, I been waiting for this price 45880 AND 45915
STOP LOSS AT 46050
TARGET 1 AT 45735-65 - take partial 70% bring stop loss to BE
TARGET 2 AT 45575-45615
LETS GO
Us30 Trade Set Up Sep 11 2025www.tradingview.com
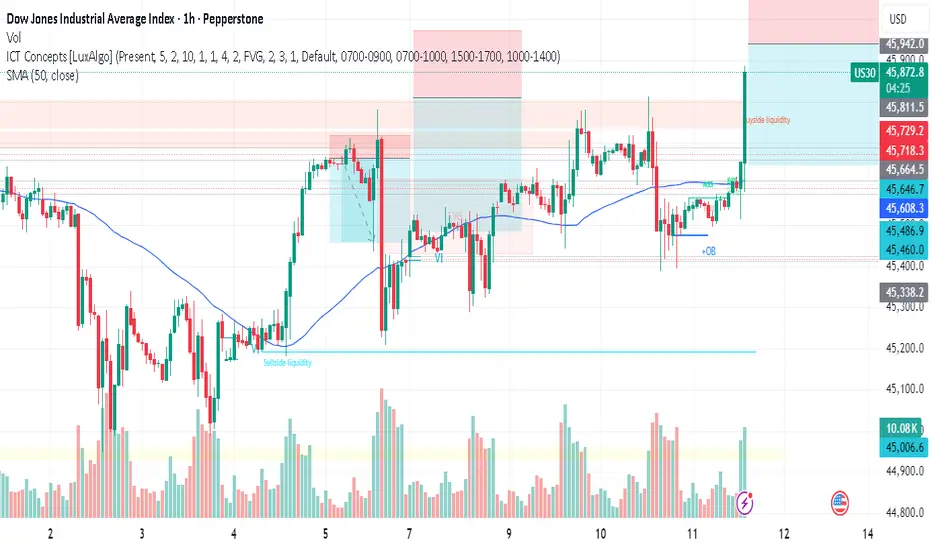
Price has pushed up above a key zone but left a SSL so i will expect price to sweep it before making internal structure on the 1m-2m creating a IFVG before going higher to PDH

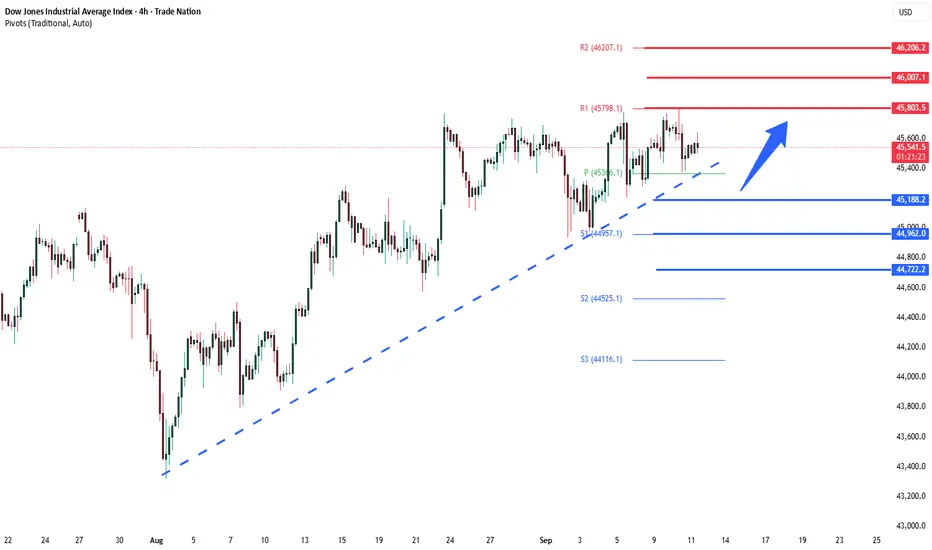
DowJones consolidation after US CPI data Key Support and Resistance Levels
Resistance Level 1: 45800
Resistance Level 2: 46000
Resistance Level 3: 46200
Support Level 1: 45190
Support Level 2: 44960
Support Level 3: 44720
This communication is for informational purposes only and should not be viewed as any form of recommendation as to a particular course of action or as investment advice. It is not intended as an offer or solicitation for the purchase or sale of any financial instrument or as an official confirmation of any transaction. Opinions, estimates and assumptions expressed herein are made as of the date of this communication and are subject to change without notice. This communication has been prepared based upon information, including market prices, data and other information, believed to be reliable; however, Trade Nation does not warrant its completeness or accuracy. All market prices and market data contained in or attached to this communication are indicative and subject to change without notice.
US30 ShortElite Analysis
All confirmations have been met
Executed off 15m TOB
Targeting lower liquidity pools

DOW JONES HIGH PROBABILITY SETUPS SOON!!!🚨 US30 HIGH PROBABILITY SETUPS 🚨
* Here We Can See Clearly The Next Potential Moves For US30 Coming Hours/Days.
* Keep Your Eyes Close On Your Trading Positions.
* Happy PIP Hunting Traders.
FXKILLA.

US30 SHORT FROM RESISTANCE
US30 SIGNAL
Trade Direction: short
Entry Level: 45,509.9
Target Level: 43,969.8
Stop Loss: 46,527.7
RISK PROFILE
Risk level: medium
Suggested risk: 1%
Timeframe: 1D
Disclosure: I am part of Trade Nation's Influencer program and receive a monthly fee for using their TradingView charts in my analysis.
✅LIKE AND COMMENT MY IDEAS✅

SUPPORT and RESISTANCE_RUN ON BUYSIDE LIQUIDITY_SELLThe market has Created a new high at 45,790, the market may start to trade to the sell side during London expecting 45,201 to be taken. There is also news on 9.11 and 9.12 that may take out new high created at 45,790, then trade to the sell side to 45,201 level.

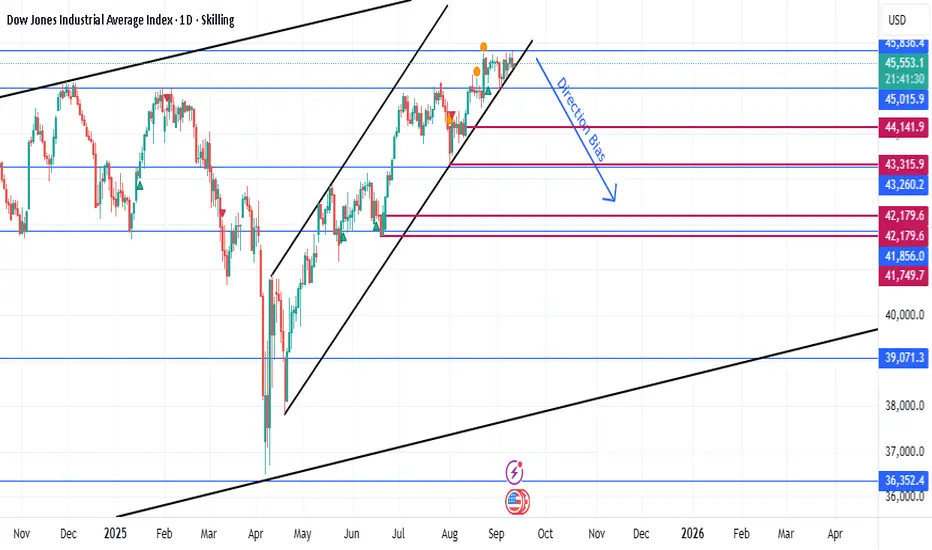
US 30 INDEX 11 SEPTEMBER 2025 TRADE IDEAThe US30 is currently trading near the top of an ascending channel, showing signs of exhaustion after a strong bullish run since April. Price is struggling to hold above the 45,500 area, suggesting the possibility of a pullback as liquidity builds up beneath recent higher lows. From a Smart Money Concepts perspective, the market structure remains bullish on higher timeframes, but with equal lows and inefficiencies below, a corrective move is likely. A clean break of the channel support could trigger a retracement toward key demand zones around 45,015, 44,141, and possibly deeper into 43,315–43,260, where institutional buyers may re-enter for continuation to the upside. Fundamentally, the short-term outlook is cautious, as traders await fresh US inflation and labor market data; softer economic releases would strengthen the case for Fed rate cuts later in 2025, which supports equities, while stronger-than-expected figures could put pressure on risk assets and fuel a temporary correction. Overall, the directional bias for the week is leaning bearish in the short term as price tests the upper channel, with expectations of a corrective dip into demand before resuming the broader bullish trend.
SHORT TERM DOW - REVERSE (H & S ) PATTERN FORMATION🔹 Pattern Observed
The chart shows a reverse Head & Shoulders (H&S) attempt.
Left shoulder, head, and right shoulder are marked clearly.
But note: written that “8 out of 10 times H&S fails”, which is important — H&S is powerful, but also prone to false breakouts. AND FALSE BREAKOUT ITSELF IS VERY STONG SETUP!5
🔹 Short-Term Technical View
Structure:
Price attempted to form an inverse H&S, but neckline is not yet broken decisively.
Instead of breakout, Dow is showing weakness near the right shoulder.
Bearish Bias Active:
Failure of the reversal pattern often triggers sharp declines (trapped longs exit).
Breakdown projection is already plotted on your chart.
Target Zone:
Immediate downside target highlighted = 41,125.
That’s consistent with measuring the depth from head to neckline and projecting downward.
Invalidation:
If price reclaims and sustains above the neckline (~45,000–45,200 zone), the bearish view weakens.
🔹 Short-Term Trading Implication
Bias: Bearish as long as below neckline.
Target: 41,125 (short-term).
Stops: Above neckline (45,000+).
R:R: If entered near 44,600–44,800, reward to risk is favorable (2.5:1+).
✅ Conclusion
The Dow shows a failed inverse H&S, which typically results in downside continuation. Short-term target is 41,125, with risk managed above 45,000.
⚠️ Disclaimer:
This analysis is provided purely for educational and informational purposes only. It is not investment advice or a recommendation to buy, sell, or hold any security, index, or derivative. Trading carries significant risk of loss and may not be suitable for all investors. Please do your own due diligence or consult with a registered financial advisor before making any trading or investment decisions.

US30 Resistance Ahead!
HI,Traders !
#US30 keeps growing
In an uptrend but the
Index will soon hit the
Horizontal resistance
Of 45700.0 from where
We will be expecting a
Local bearish correction !
Comment and subscribe to help us grow !

US30 Trade OutlookPrimary Bias: 🔻 Looking for short opportunities
I’ll be waiting for price to retest the 45,650 – 45,700 resistance zone. If the retest holds with bearish confirmation, I’ll look to enter sells targeting the 45,250 – 45,150 support area.
Alternative Scenario: 🔼 Possible buy setup
If price manages to break above the 45,750 resistance and retest it successfully, I’ll consider short-term buys towards 45,900.
👉 The main focus remains on sells at the resistance retest, unless the breakout and retest scenario invalidates it.

Us30 Trade Set Up Sep 10 2025FX:US30
www.tradingview.com
price has testes PDH and has made a BSL and SSL with a 15m FVG so i want to see either price test BSL, close under, form 1m-2m IFVG to target SSL or come to test 15m FVG, respect it, form 1m-2m IFVG and go higher

DowJones Resistance retest at 45800Key Support and Resistance Levels
Resistance Level 1: 45800
Resistance Level 2: 46000
Resistance Level 3: 46200
Support Level 1: 45190
Support Level 2: 44960
Support Level 3: 44720
This communication is for informational purposes only and should not be viewed as any form of recommendation as to a particular course of action or as investment advice. It is not intended as an offer or solicitation for the purchase or sale of any financial instrument or as an official confirmation of any transaction. Opinions, estimates and assumptions expressed herein are made as of the date of this communication and are subject to change without notice. This communication has been prepared based upon information, including market prices, data and other information, believed to be reliable; however, Trade Nation does not warrant its completeness or accuracy. All market prices and market data contained in or attached to this communication are indicative and subject to change without notice.

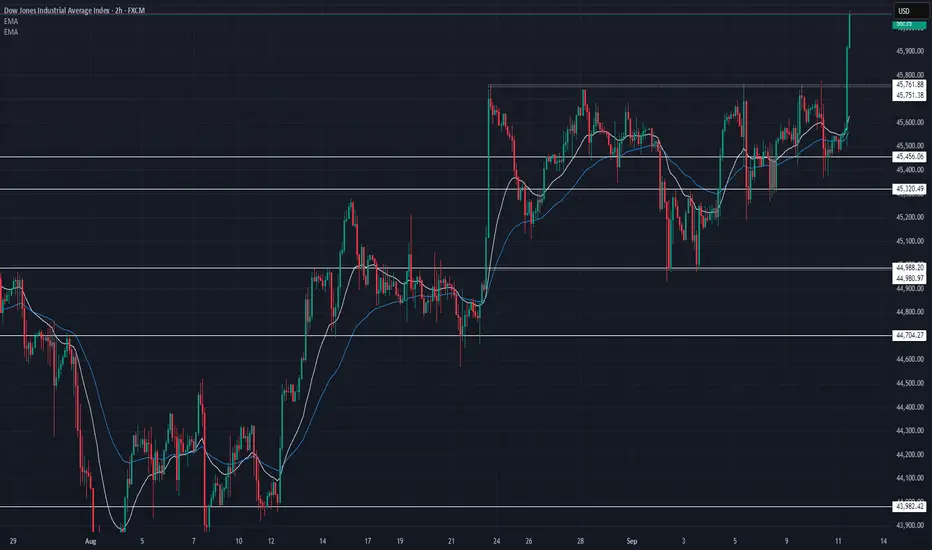
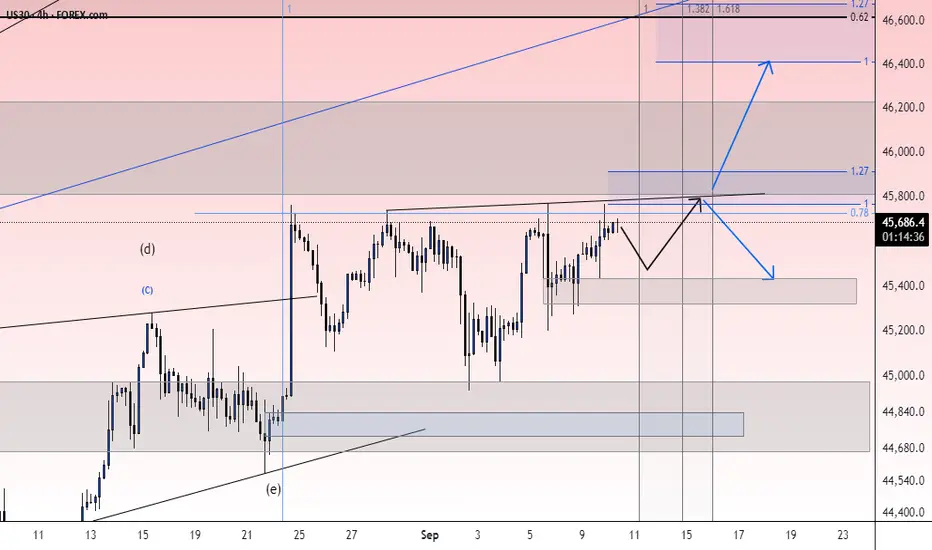
DOW JONES close to a Triangle break-out leading to 47500!Dow Jones (DJI) has been trading within a Channel Up pattern since April 24. Following the August 21 Low, it entered a short-term Ascending Triangle pattern, looking identical to May - June, which also started after a 4H MA50 (blue trend-line) test.
That pattern was a re-Accumulation phase, which after breaking upwards pushed the price just below its 2.5 Fibonacci extension.
With also similar 4H RSI sequences, we expect a similar reaction upon a Triangle break-out, targeting 47500 (Fib 2.5 extension).
-------------------------------------------------------------------------------
** Please LIKE 👍, FOLLOW ✅, SHARE 🙌 and COMMENT ✍ if you enjoy this idea! Also share your ideas and charts in the comments section below! This is best way to keep it relevant, support us, keep the content here free and allow the idea to reach as many people as possible. **
-------------------------------------------------------------------------------
💸💸💸💸💸💸
👇 👇 👇 👇 👇 👇

check the trend The upward trend is expected to advance to the resistance trend line. Then the possibility of a trend change and the start of a correction will be likely.
Dow for September 10thA very messy bar chart.Using the line/close to see thru the mess.needs to get a bid to get thru rez

US30 | Testing 45,800 Supply Zone – Bullish or Bearish?📌 US30 Daily Analysis – Key Decision Zone
US30 has been moving inside a rising wedge structure, making consistent higher highs and higher lows. Price is now testing a critical resistance zone around 45,700 – 45,800, which also aligns with the wedge top.
🔎 Key Observations:
Market is in a strong uptrend, but has reached a major supply area.
Liquidity rests above 45,800 (equal highs & breakout traders).
Demand zone sits around 45,200 – 45,000, which may act as support if rejection occurs.
✅ Possible Scenarios:
🟢 Bullish Continuation
A strong daily/4H close above 45,800 would confirm continuation.
Next upside targets: 46,200 → 46,600 → 47,000.
🔴 Bearish Rejection
If price rejects 45,800, watch for a Break of Structure (BoS) on 4H/1H.
Downside targets: 45,200 → 44,800 → 44,400.
🎯 Trading Plan
Wait for clear confirmation:
Break & Retest above 45,800 → look for longs.
Rejection + BoS on lower TF → look for shorts toward demand zones.
