US30 - Potential LongHi Traders,
US30 has been in an UPTREND for a long time and looking for buy trades is only logical.
What now?
Wait for a retracement or a pull back
Look for lower time frame buy.
Good Luck
WALLSTREETCFD trade ideas
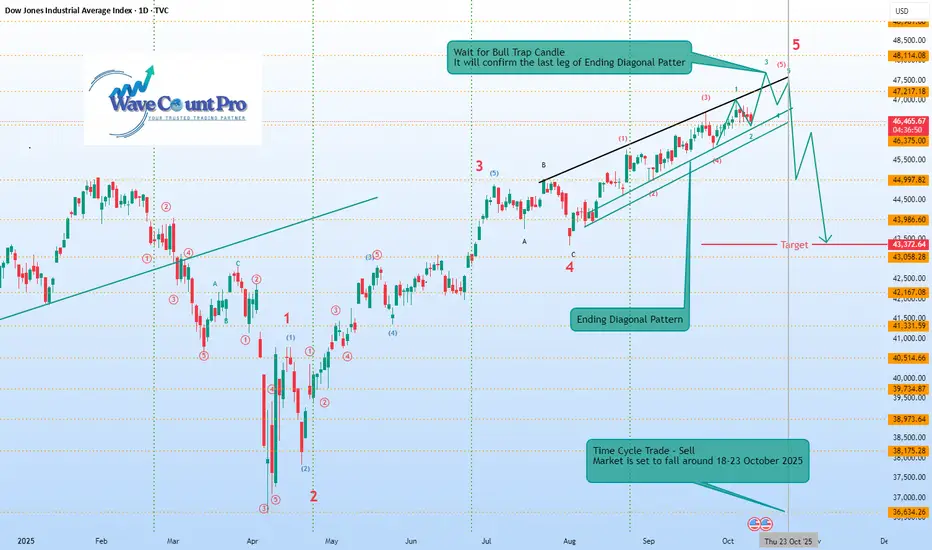
US30 all set to fall 5% starting 18-23rd OctHere’s a summary of the chart you provided:
Index: Dow Jones Industrial Average (DJIA), Daily timeframe (2025).
Pattern: Ending Diagonal Pattern forming in Wave 5.
Wave Count:
Major impulse structure labeled 1–5, with sub-waves marked inside the Ending Diagonal.
Current move is in the final 5th wave, nearing completion.
Key Message:
A Bull Trap Candle is expected — it will confirm the final leg of the Ending Diagonal.
After that, a sharp correction (sell-off) is anticipated.
Target Zone: Around 43,372–43,058.
Time Cycle Note:
A Time Cycle Trade (Sell) is suggested.
Market is projected to fall between October 18–23, 2025.
In short, the chart forecasts the completion of an Ending Diagonal near 47,200–47,500 levels, followed by a significant downside move toward the 43,000 zone starting late October 2025.
DOW JONES Can the 4H MA100 initiate a comeback??Dow Jones (DJI) has been trading within a 2-month Channel Up and today touched its 4H MA100 (green trend-line) for a second time after September 25.
Both in terms of price and 4H RSI action, this sequence is similar to the September 02 rebound fractal, which also following a Bull Flag, it touched the 4H MA100 for a 2nd time and then moved on to a rally that peaked on the 1.5 Fibonacci extension.
The 1.5 Fib ext also priced the Higher High of the first Bullish Leg of the pattern, thus offers currently the highest probability for our next Higher High. Our long Target is slightly below it at 47000, representing a +2.80% rise from the recent Low.
-------------------------------------------------------------------------------
** Please LIKE 👍, FOLLOW ✅, SHARE 🙌 and COMMENT ✍ if you enjoy this idea! Also share your ideas and charts in the comments section below! This is best way to keep it relevant, support us, keep the content here free and allow the idea to reach as many people as possible. **
-------------------------------------------------------------------------------
💸💸💸💸💸💸
👇 👇 👇 👇 👇 👇

Watch the Dow Industrial TrendlinesNext week 10/06/25 to 10/10/25 could see the convergence of two long- term Dow Jones Industrial Average (DJI) trendlines.
The trendline connecting the DJI January 2022 and December 2024 peaks is near the current DJI level.
Sometime prior support trendlines can become resistance.
The trendline connecting the bottoms made in October 2023, August 2024, and January 2025 converges with the peaks trendline next week!
The area of DJI 47,200 to 47,400 could be important resitance.
Watch the DJI trendlines!

US30 Bearish Breakout!
HI,Traders !
#US30 made a bearish
Breakout of the rising support
Line and we are bearish biased
So we will be expecting a
Further bearish move down !
Comment and subscribe to help us grow !
US30 1H🔹 Overall Outlook and Potential Price Movements
In the charts above, we have outlined the overall outlook and possible price movement paths.
As shown, each analysis highlights a key support or resistance zone near the current market price. The market’s reaction to these zones — whether a breakout or rejection — will likely determine the next direction of the price toward the specified levels.
⚠️ Important Note:
The purpose of these trading perspectives is to identify key upcoming price levels and assess potential market reactions. The provided analyses are not trading signals in any way.
✅ Recommendation for Use:
To make effective use of these analyses, it is advised to manually draw the marked zones on your chart. Then, on the 15-minute time frame, monitor the candlestick behavior and look for valid entry triggers before making any trading decisions.

US30 Bulliash BiasLooking at US30 bullish idea today . Volume more likely to be created at 2.30pm uk time for me . looking for a rection from these zones

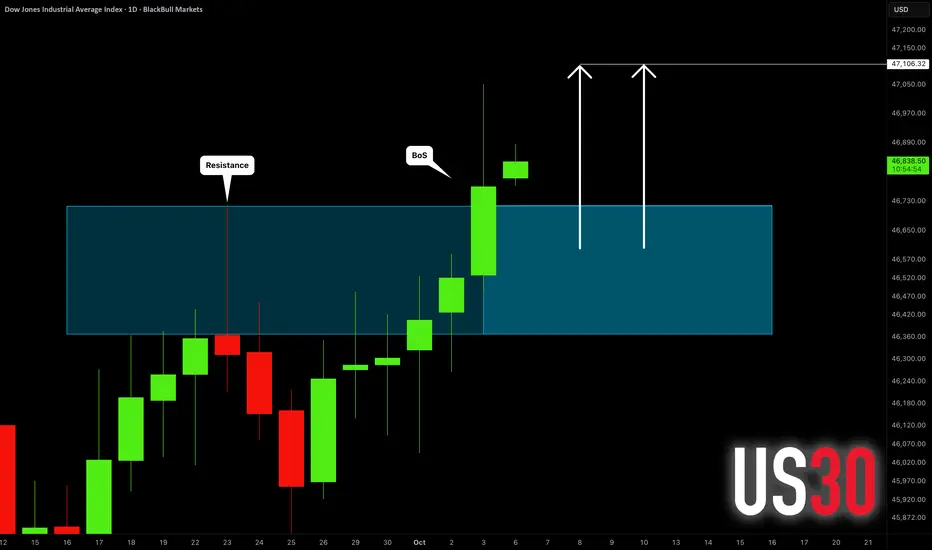
DOW JONES INDEX (US30): Another BoS Confirmed
US30 updated the all-time high on Friday, breaking and closing
above a major daily horizontal resistance cluster.
It opens a potential for more growth now.
Next resistance is 47100.
❤️Please, support my work with like, thank you!❤️
I am part of Trade Nation's Influencer program and receive a monthly fee for using their TradingView charts in my analysis.
US30 LongDow is in a bullish trend and the current wedge has given a fakeout, therefore going long on US30, aiming for higher highs and higher lows.

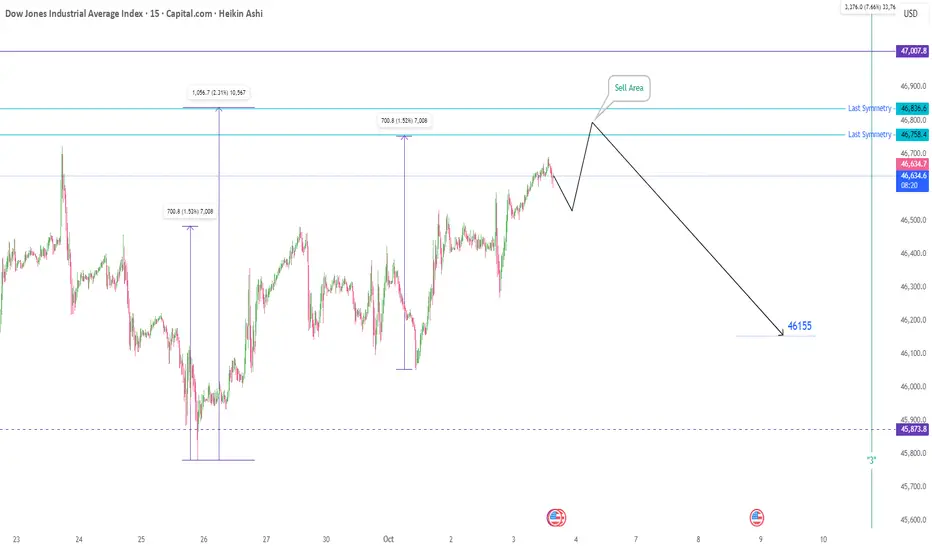
Us30 in FridayToday is Friday, the last trading day of the week. Despite the absence of major economic news releases, the following forecast for the Dow Jones Index is highly probable.
Upon market open and with an increase in trading volume, we anticipate an upward move. After registering a new price high, the index is expected to decline to approximately the 46,160 level.
Entering short positions within the specified target zone presents a favorable opportunity to capture profits. May it be profitable.
Please note: This is solely a trading idea. The responsibility for any trading decision rests entirely with the individual.
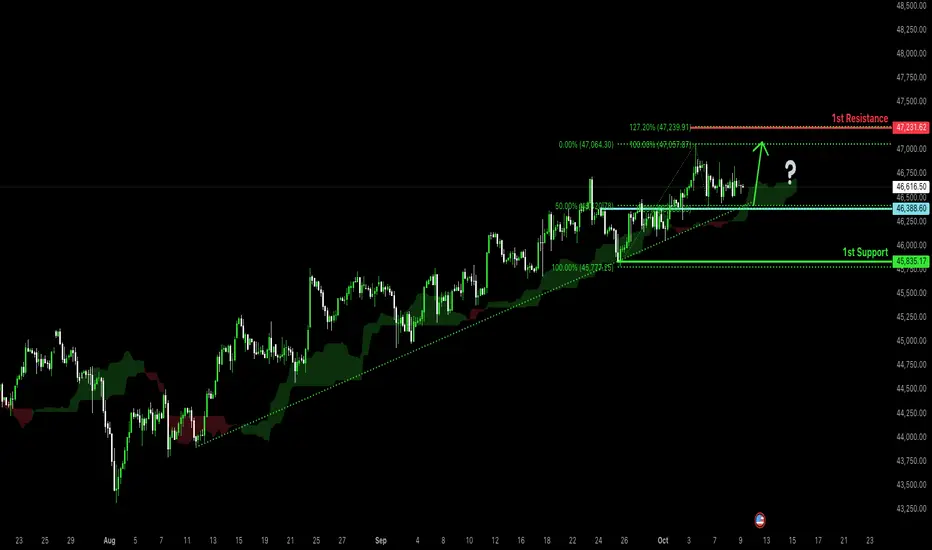
Bullish continuation?Dow Jones (US30) is falling towards the pivot, which acts as a pullback support that aligns with the 50% Fibonacci retracement and could bounce to the 1st resistance.
Pivot: 46,388.60
1st Support: 45,835.17
1st Resistance: 47,231.62
Disclaimer:
The above opinions given constitute general market commentary, and do not constitute the opinion or advice of IC Markets or any form of personal or investment advice.
Any opinions, news, research, analyses, prices, other information, or links to third-party sites contained on this website are provided on an "as-is" basis, are intended only to be informative, is not an advice nor a recommendation, nor research, or a record of our trading prices, or an offer of, or solicitation for a transaction in any financial instrument and thus should not be treated as such. The information provided does not involve any specific investment objectives, financial situation and needs of any specific person who may receive it. Please be aware, that past performance is not a reliable indicator of future performance and/or results. Past Performance or Forward-looking scenarios based upon the reasonable beliefs of the third-party provider are not a guarantee of future performance. Actual results may differ materially from those anticipated in forward-looking or past performance statements. IC Markets makes no representation or warranty and assumes no liability as to the accuracy or completeness of the information provided, nor any loss arising from any investment based on a recommendation, forecast or any information supplied by any third-party.
Buy at the weekly low to target the weekly opening price.The market has been forming two accumulations — a monthly one of buyers and a weekly one of sellers. This week, we can see the market holding at a price level that is generating seller accumulation. In my view, the price has the potential to break the bullish trend to sweep out the buyers involved in it and then create an institutional buy in this weekly liquidity zone, aiming again for the price level where the market opened this Monday.
Price action tends to seek equilibrium between Monday’s opening and Friday’s closing, often closing and opening within the same zone. Therefore, if the price drops, we could look for a buying opportunity. Let’s wait for the setup to form in the coming hours or tomorrow.

DowJones pre US Open key trading levelsKey Support and Resistance Levels
Resistance Level 1: 46908
Resistance Level 2: 47014
Resistance Level 3: 47210
Support Level 1: 46493
Support Level 2: 46409
Support Level 3: 46270
This communication is for informational purposes only and should not be viewed as any form of recommendation as to a particular course of action or as investment advice. It is not intended as an offer or solicitation for the purchase or sale of any financial instrument or as an official confirmation of any transaction. Opinions, estimates and assumptions expressed herein are made as of the date of this communication and are subject to change without notice. This communication has been prepared based upon information, including market prices, data and other information, believed to be reliable; however, Trade Nation does not warrant its completeness or accuracy. All market prices and market data contained in or attached to this communication are indicative and subject to change without notice.

US30US30 – H4 Chart Analysis
Price action currently forming Higher Highs and Higher Lows, confirming a bullish structure.
After the recent Higher High, price retraced back to the zone where it had previously formed a Higher Low.
📍 From this Higher Low to Higher High, a Fibonacci Retracement was applied.
✅ Entry taken from the 0.5 Fibonacci level, aligning with a potential bullish continuation.
🛑 Stop Loss (SL) placed just below the previous Higher Low for structure-based invalidation.
🎯 Risk to Reward: 1:1
Structure: Bullish
Strategy: Pullback Entry in Uptrend
Timeframe: H4
Tool: Fibonacci Retracement

Will DOW JONES Repeat History???The Dow Jones 125-Year Timeline
- The oldest US Stock index is at the 125-year resistance trendline.
- The last time it perfectly tested the trendline - a period of The Great Depression started - 1929
- After, which the Dow fell around 90% - Check the blue supporting trendline.
A similar trendline could be perfectly drawn:
- The support of the trendline is 90% lower than the current market levels


Dow Jones US30 Analysis: Bullish Trend, Trade Plan📊 The US30 (Dow Jones) remains in a strong bullish trend, showing a clear sequence of higher highs and higher lows on the 4-hour chart 📈. However, when viewed on the daily timeframe, price now appears somewhat overextended ⚠️.
🔎 Dropping down to the lower timeframes and applying the Anchored VWAP (AVWAP) indicator, it’s evident that price is trading well above VWAP, signaling a premium zone. The risk here is that traders may continue buying into strength without acknowledging that price could easily retrace back into VWAP.
💡 Remember — smart money buys at a discount, not at a premium. In bullish trends like this, patience is crucial.
📹 In the video, I outline my trade plan, which focuses on waiting for a healthy pullback and then looking for a bullish setup if the structure aligns in our favor. I’m not interested in chasing price when it’s this extended — instead, I prefer to wait for the retracement and enter at better value, reducing risk and improving trade quality 🎯.
⚠️ Disclaimer: This analysis is for educational purposes only and not financial advice. Always trade responsibly and manage risk carefully.

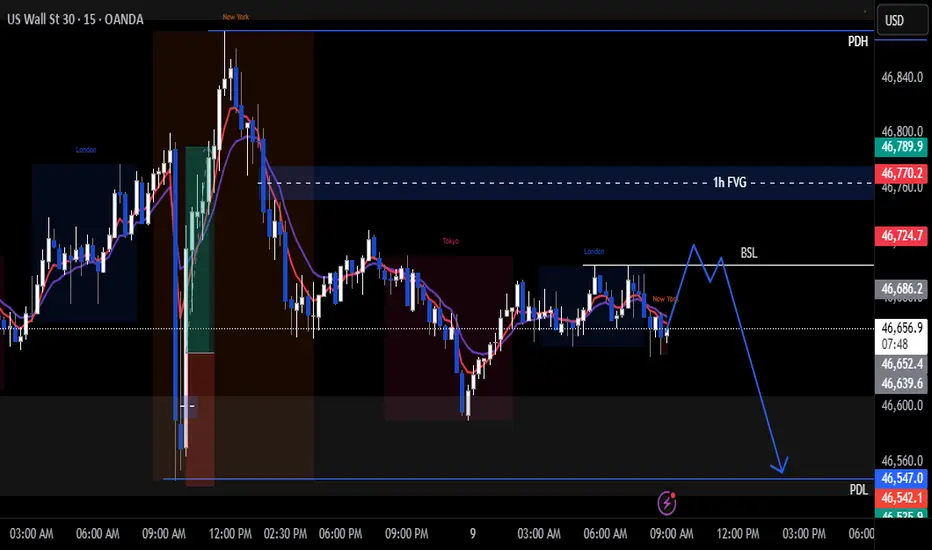
Us30 Trade Set Up Secured 1500 Pips!Set Up played out perfectly with BSL being swept, CISD on the 1m and 5m to target PDL
cant get any cleaner then that

Us30 Trade Set Up Oct 9 2025overall i am bearish so i will be looking for sells after BSL/London highs get swept or the 1h FVG gets tapped to target PDL
www.tradingview.com
DOW JonesUS 30 - DJI Dow Jones
- Bullish Channel as an corrective pattern in Short Time Frame
- Break of Structure
- Demand Zone
- Completed " 1234 " Impulsive Waves
- RSI - Divergence

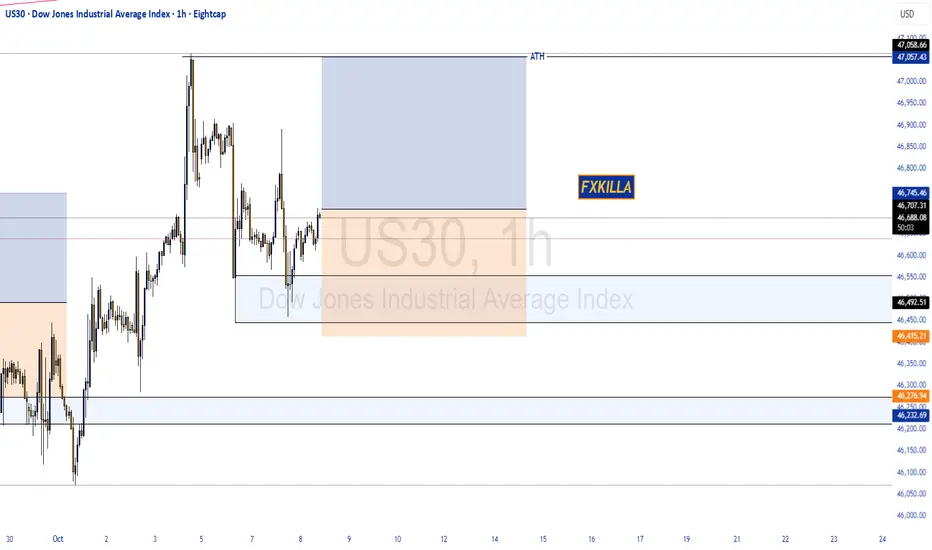
DOW JONES HIGH PROBABILITY SETUP SOON!!!🚨 DOW30 HIGH PROBABILITY BUY SETUP 🚨
* Here We Can See Clearly The Next Potential Move For US30 Coming Hours/Days.
* Keep Your Eyes Close On Your Trading Positions.
* Happy PIP Hunting Traders.
FXKILLA.
US30 - Potential BuyHi traders,
We are looking to BUY CMCMARKETS:US30
Stay tuned :)
Price Action:
Short-term sell bias toward 41,700 zone based on lower high and projected weakness.
Watch reaction at 41,700—if buyers return strong with a new higher low, it resumes uptrend.
Invalidation: If price breaks above 42,800 with strength and closes above, sellers are overwhelmed—trend continues.
Good Luck :)
Study, Study, Study! Lorenzo Tarati

Believe or not, it's not TrumpThis is where all your dollars are about to be made or lost depending on your faith. Watch and learn.
