Are you still ready to buy the American market?After working as an analyst for nearly 20 years, I have noticed a clear trend of recovery in all drawdowns in the US market. Money does make money, and the printing press can fill all corrections.
Will it always be like this?
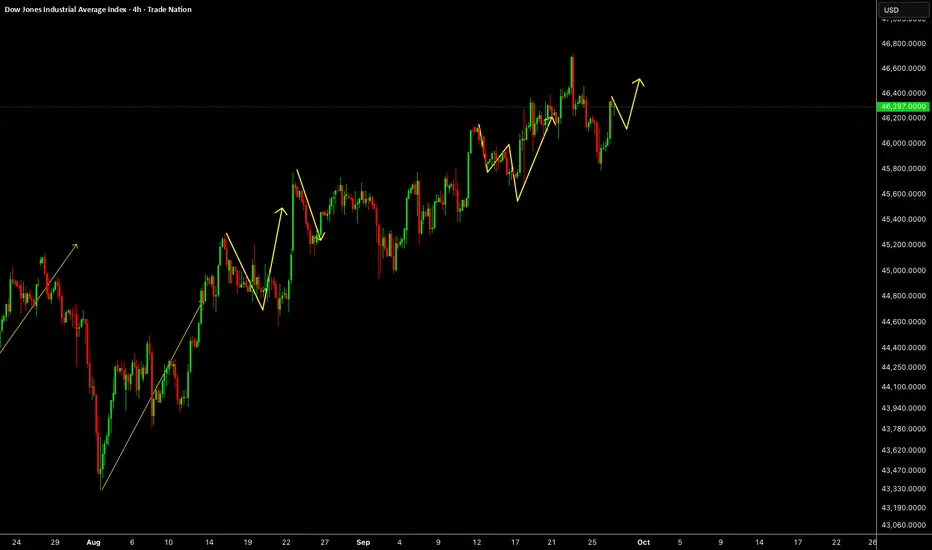
It was this question that made me analyze in more detail the charts of the American indices - DJI and DJT.In fact, you can connect a larger data spector here, including the dynamics of the S&P, the S&P Small Cap 600 index, the S&P Mid Cap 400, index and the Value Line Composite index (geometric) and see the same situations.
I'll add some of them to the graph for clarity.As you can see, there are discrepancies between the charts, which are called intermarket divergences. However, the Dow theory has its own reasons for this.
1. According to the Dow theory, signals about the current trend and trend reversal should be confirmed by both indexes. This statement applies to the Dow Jones Industrial Average and the Dow Jones Transportation Average.
2. At the same time, there may be some discrepancy in the timing of the signals, that is, one of the indices may signal a trend change earlier than the other.
What do you see on the chart?
Personally, I see a notable contradiction. While the industrial index has reached new all-time highs, the transportation index is trading significantly below them. The Value Line Composite Index (geometric) shows a similar picture. That is, we have an non confirmation of the strength of growth and strength of buyers, which is a bad signal!
And no, I'm not saying that you need to sell urgently, but you need to understand that the market is in the final phase of its long-term growth. And a reversal towards the bearish phase is just around the corner.
It is enough to look at the waves to understand that we are already sitting in the last carriage of the train, which is ready to start reversing.In addition, inside wave 5, we had a stretch in the subwave (1), which means that the subwaves (3) and (5) cannot continue stretching.
Wave (1)=18465.79 points, wave (3)=16357.78 points, which means (1)>(3)>(5), then the movement in the basement (5) is limited to the level of 52969.5 points, before reaching it, the market should already begin to show signs of a downward reversal.
At the same time, the 5th waves often give a truncation and already now the subwave (5) = 0.5 of the length (1). The growth may end prematurely if condition (5) is fulfilled=0.618 from (1) or (5)=0.764 from (1).
PS All extremes are usually formed either on euphoria or on general optimism.
Are you still an optimist?
WALLSTREETCFD trade ideas

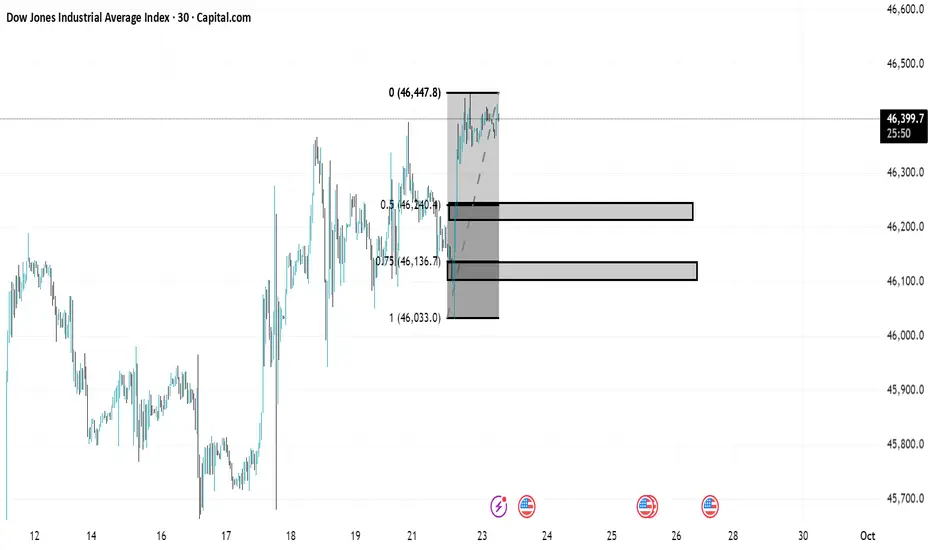
US30 TREND ANALYSISIn US30 there is a clear uptrend important areas are marked as always one is 50 percent area and the other one is 75 percent area .Once the market comeback for retest we will shift to smaller timeframe and look for trendshift after observing everything. When the market again comeback for the retest on smaller timeframe we will look for buy side trade.
important areas
50 percent zone(46245.3)
75 percent zone(46134.3)
bigger timeframe (30 minutes)
smaller timeframe(5 minutes)

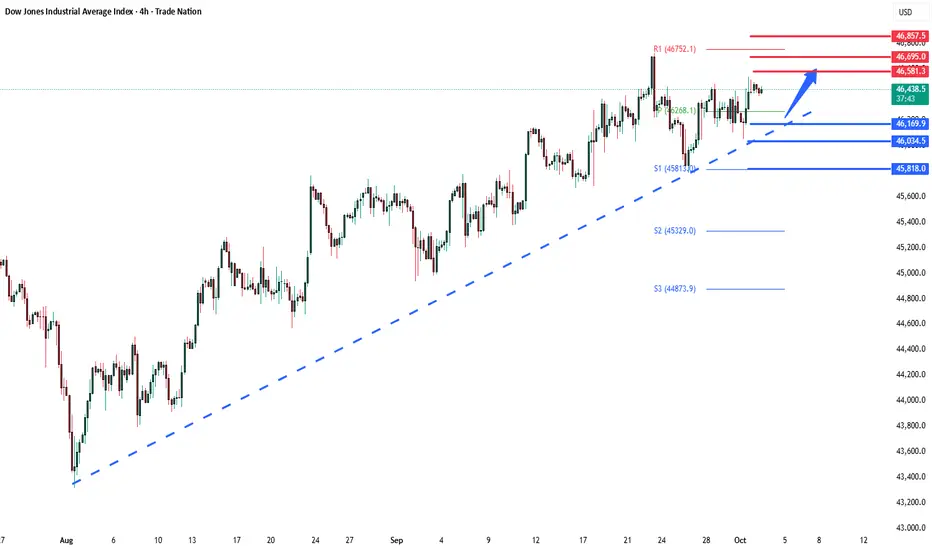
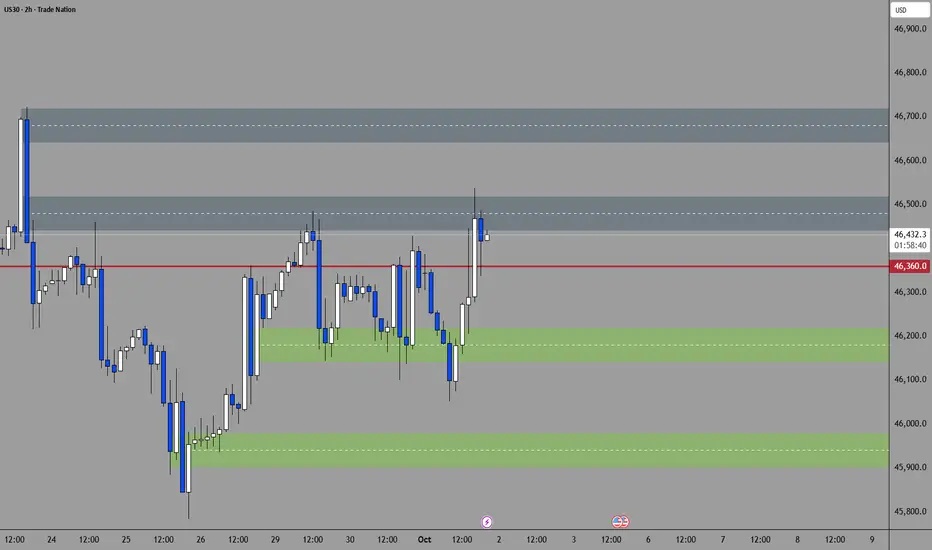
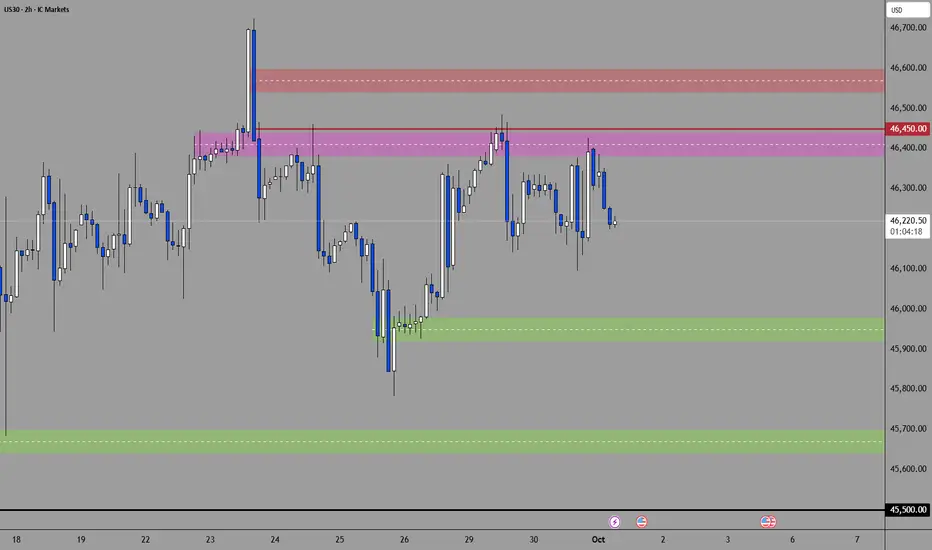
Dow Key Trading LevelsKey Support and Resistance Levels
Resistance Level 1: 46580
Resistance Level 2: 46690
Resistance Level 3: 46850
Support Level 1: 46170
Support Level 2: 46040
Support Level 3: 45800
This communication is for informational purposes only and should not be viewed as any form of recommendation as to a particular course of action or as investment advice. It is not intended as an offer or solicitation for the purchase or sale of any financial instrument or as an official confirmation of any transaction. Opinions, estimates and assumptions expressed herein are made as of the date of this communication and are subject to change without notice. This communication has been prepared based upon information, including market prices, data and other information, believed to be reliable; however, Trade Nation does not warrant its completeness or accuracy. All market prices and market data contained in or attached to this communication are indicative and subject to change without notice.
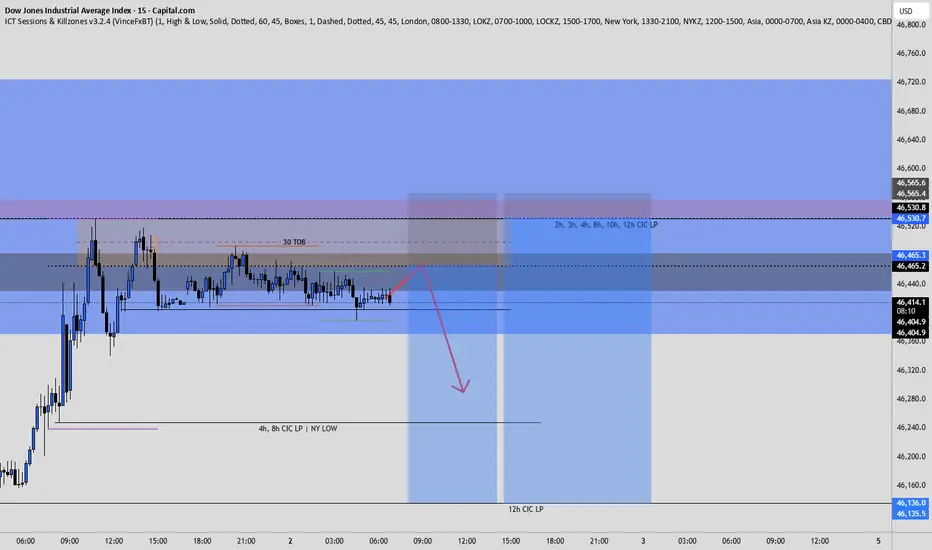
US30 ShortElite Analysis
Price is acquiring liquidity inside Daily and 4H structured liquidity zone
We are looking for price to come up, react off a FVG and liquidity marked out by various time frames
Targeting lower liquidity pools
US30US30 needs some correction and one more push up to take ATH.
Disclosure: We are part of Trade Nation's Influencer program and receive a monthly fee for using their TradingView charts in our analysis.
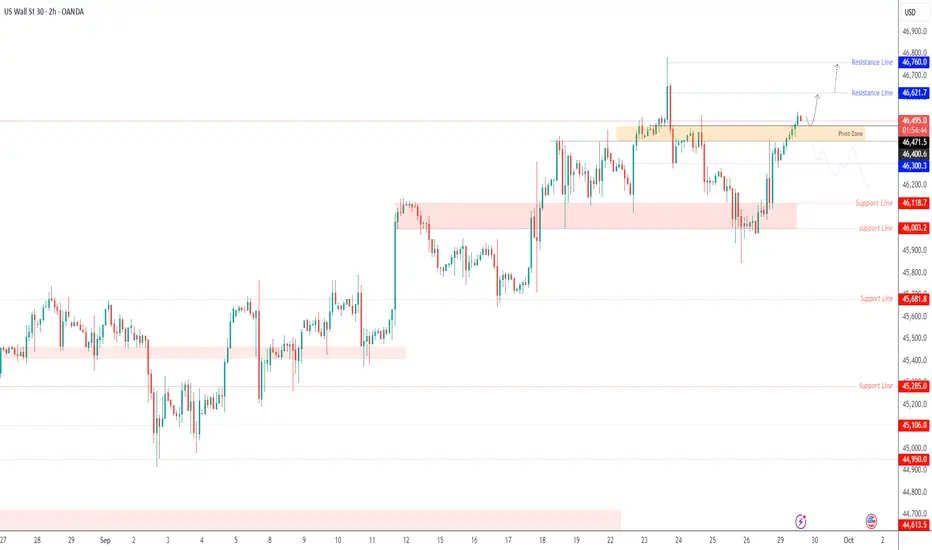
US30 Technical AnalysisPrice has been respecting the uptrend supported by the 50 SMA, with pullbacks finding buyers around the dynamic support zones. Recently, US30 rejected 46,400.0 resistance and is consolidating above 45,700.0 support, while the broader trend remains bullish.
Support at: 45,700.0 🔽 / 45,000.0 🔽
Resistance at: 46,400.0 🔼 / 47,115.8 🔼
🔎 Bias:
🔼 Bullish: A sustained hold above 46,000.0 and a breakout over 46,400.0 could extend the rally toward 47,115.8.
🔽 Bearish: A breakdown below 45,700.0 would expose 45,000.0 and weaken the uptrend momentum.
📛 Disclaimer: This is not financial advice. Trade at your own risk.


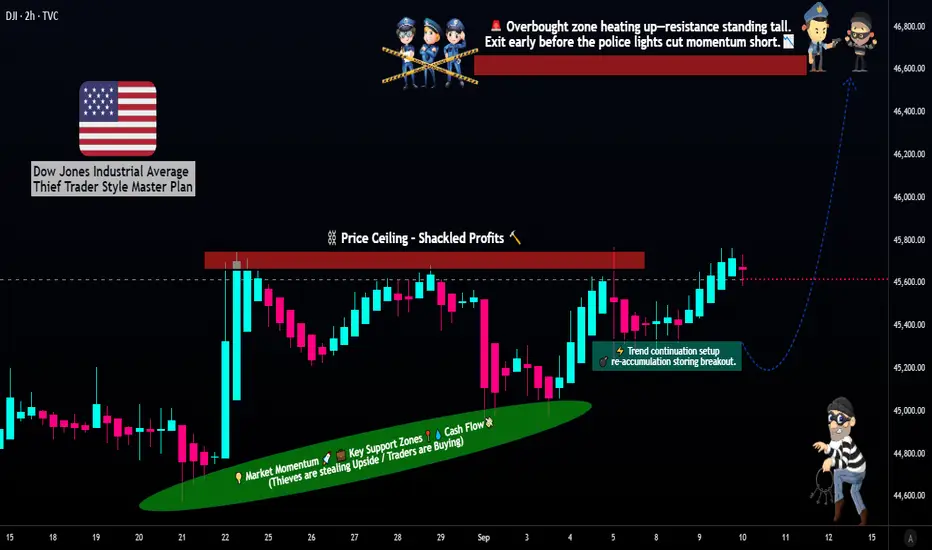
Can the DJIA Maintain Its Momentum? A Strategic Long Setup📈 DJIA Money-Making Plan: Thief Strategy (Swing/Day Trade) 🕵️♂️
🚀 Swing/Day Trade Setup for Dow Jones Industrial Average (DJIA) CFD
Join the "Thief OG" crew with this bullish plan to navigate the market with precision! Using a layered limit order strategy, this setup targets smart entries and calculated exits while keeping risk management first. Let’s dive into the plan! 💥
📊 Trade Plan Overview
Asset: Dow Jones Industrial Average (DJIA) CFD 💰
Direction: Bullish 🐂
Current Price (Sep 10, 2025): 45,711 🟢 (+0.43% from previous close)
Strategy: Thief Layered Limit Order Strategy 🕵️♂️
Place multiple buy limit orders at key levels to "steal" entries during pullbacks.
Suggested Entry Levels: $45,400, $45,500, $45,600, $45,700 (or customize based on your analysis).
Note: You can add more layers or adjust levels to suit your risk appetite. Flexibility is key! 🔧
Stop Loss (SL): $45,100 (Thief OG’s starting point).
Important: Adjust your SL based on your strategy and risk tolerance. This is a suggestion, not a rule! ⚠️
Target Price (TP): $46,600 (Escape before the "police barricade"!).
Note: Set your own TP based on your goals. Take profits at your discretion—don’t follow blindly! 💸
Risk Disclaimer: Dear Traders (Thief OG’s), this plan is a guide, not a guarantee. Always trade at your own risk and adjust SL/TP to your strategy. Protect your capital! 🛡️
🧠 Why This Plan? Thief Strategy + Market Insights
The "Thief" strategy uses layered limit orders to capitalize on pullbacks in a bullish trend, backed by solid market data. Here’s why this setup shines:
Thief Technical Strategy 🕵️♂️:
Layered Entries: Multiple buy limit orders ($45,400–$45,700) allow you to scale into the trade during dips, maximizing entry precision.
Risk Management: Suggested SL at $45,100 protects against unexpected reversals. Customize to your comfort level.
Profit Potential: Target $46,600 aligns with resistance levels and recent momentum. Exit strategically to lock in gains.
Fundamental & Macro Score: 7/10 (Solid Foundation) 🟢
Earnings Growth: Expected 7-10% for 2025, driven by strong corporate balance sheets.
Sector Strength: 10/11 S&P sectors up YTD, with tech and industrials leading.
Macro Environment:
Cooling inflation (CPI ~3.1% YoY).
Fed rate cuts expected, supporting growth.
Mild headwinds from tariffs and global trade risks.
Resilient labor market (unemployment 4.3%) and consumer spending fuel upside.
Trader Sentiment Outlook 😊:
Retail: 51% Bullish 🟢 | 34% Bearish 🔴 | 15% Neutral ⚪
Optimism driven by dip-buying in tech and industrials.
Institutional: 45% Bullish 🟢 | 40% Bearish 🔴 | 15% Neutral ⚪
Cautious positivity, focusing on corporate fundamentals amid policy uncertainties.
Overall Mood: Mildly positive, but stay alert for volatility from trade talks or inflation data.
Fear & Greed Index: 51 (Neutral) ⚖️
Balanced emotions: Not too scared, not too greedy.
Steady momentum, but watch for volatility spikes with upcoming data (e.g., inflation reports).
Market Outlook: Bullish 🚀
Bullish trend intact with no recession signals.
Expect modest single-digit % gains, led by earnings.
Stay cautious of pullbacks from policy news, but avoid shorting for now.
🔗 Related Pairs to Watch (in USD)
S&P 500 CFD ( SP:SPX ): Tracks broader market trends, often moves in tandem with DJIA.
NASDAQ 100 CFD ( NASDAQ:NDX ): Tech-heavy index, great for confirming bullish momentum.
FX:USDJPY : Currency pair sensitive to U.S. economic data and Fed policy.
OANDA:XAUUSD (Gold): Safe-haven asset; monitor for risk-off moves if sentiment shifts.
📝 Final Notes
This DJIA setup combines the tactical "Thief" layered entry strategy with robust market data to guide your trades. Stay disciplined, manage risk, and adapt the plan to your style. Let’s make smart moves together! 💪
✨ “If you find value in my analysis, a 👍 and 🚀 boost is much appreciated — it helps me share more setups with the community!”
#TradingView #DJIA #SwingTrading #DayTrading #ThiefStrategy #Bullish #TechnicalAnalysis #MarketAnalysis
Wyckoff Distribution schematicsThis count is based on my assumptions so anything can happen not a trading or financial advice just for educational purposes only kindly do your own ta thanks trade with care good luck.

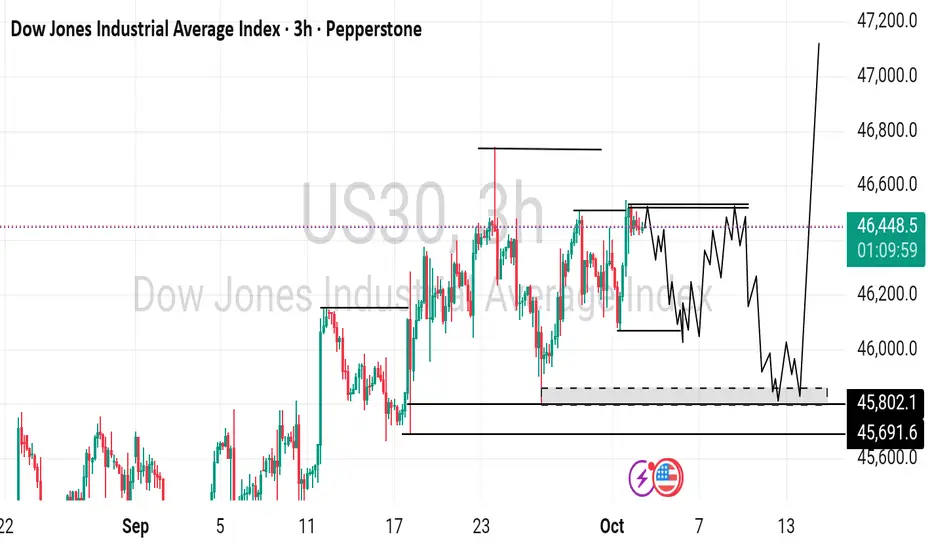
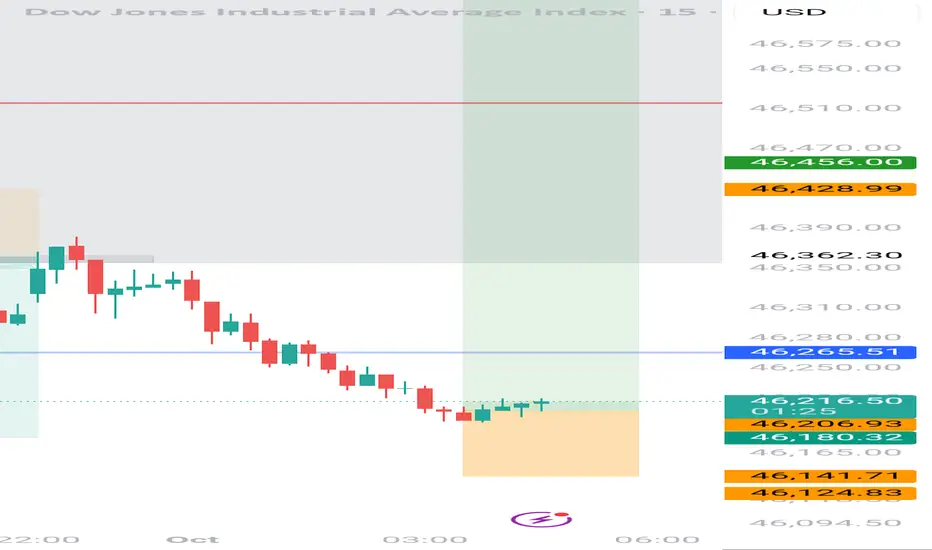
US30 – Bearish Below 46,300 With Downside Targets at 46,120 US30 – Overview
US30 is holding a bearish bias after stabilizing below 46,300.
As long as price trades below the pivot, the index is expected to extend the decline toward 46,120, with a further drop to 46,000 possible.
A confirmed 1H close below 46,000 would strengthen the bearish trend and expose deeper support at 45,690.
On the other hand, a 1H close above 46,300 would neutralize the bearish pressure and support a rebound toward 46,400 – 46,470.
Pivot: 46,300
Support: 46,120 – 46,000 – 45,690
Resistance: 46,400 – 46,470 – 46,620

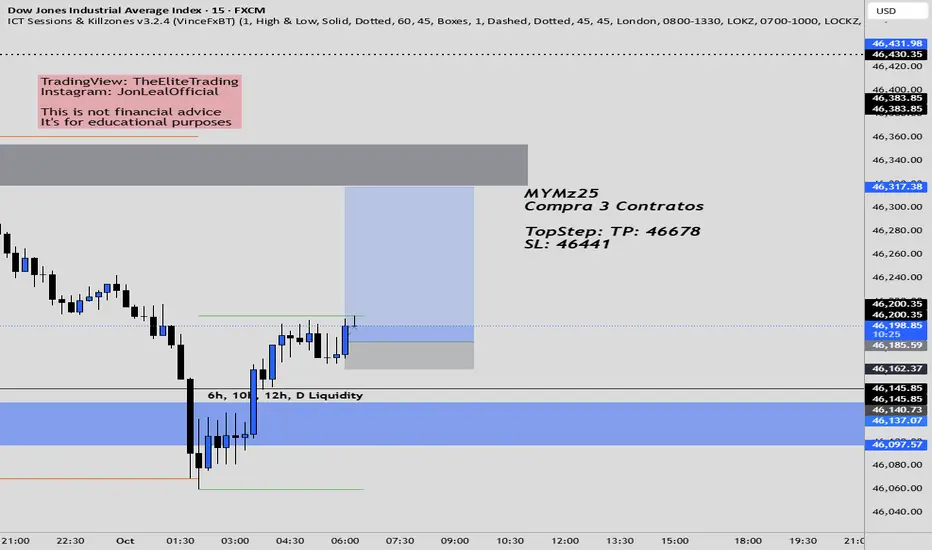
Us30 Trade Set Up Oct 2 2025Price is overall bullish making HH/HL and has created a 4h FVG so i want to see price first sweep SSL/London lows, tap into 4h FVG to then look for 1m IFVG/CISD to target PDH
www.tradingview.com

US30 : BULLISH PATTERNI am going to wait until it mitigate my continuation demand area ... And HoLD !
I will see how it goes . Happi Trading
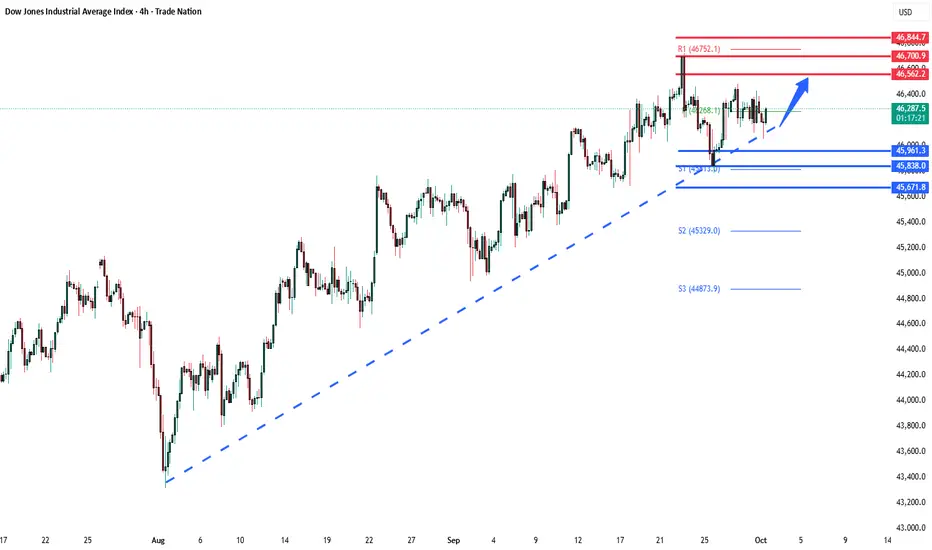
US30 – Bullish Above 46,470 as Fed Comments and Shutdown Risks US30 – Overview
U.S. index futures started the week firmer as investors await remarks from Fed policymakers and monitor the ongoing government shutdown risk, which could delay key economic data and impact Fed rate-cut expectations.
Technically, US30 maintains bullish momentum after stabilizing above the 46,470 pivot zone.
A sustained move above 46,620 would open the way toward 46,760, with a possible extension to 46,900 if broader U.S. indices continue to firm.
However, a break below 46,400 would weaken sentiment and expose 46,300 and 46,120 as the next supports.
Pivot: 46,470
Resistance: 46,620 – 46,760 – 46,900
Support: 46,400 – 46,300 – 46,120
US30 - Updated Trader EdgeI will appreciate some feedback please, likes, questions ??🙏
🎯 KEY PIVOT ZONE
BREAKOUT LEVEL: 46,440.0-46,520.0
✅Dense HVN cluster (7+ stacked bars) with 3 POC alignment at right edge of VRVP
✅Untested high-volume area near all-time high with no significant rejection history above
✅51.7 points above current price - price consolidating before potential breakout
📊 PRICE TARGETS
UPSIDE TARGETS ⬆️
🎯T1: 46,440.0-46,520.0 (Breakout through primary HVN cluster)
🎯T2: 46,640.0-46,720.0 (Secondary breakout continuation)
DOWNSIDE TARGETS ⬇️
🎯T1: 46,140.0-46,220.0 (Primary Demand)
🎯T2: 45,900.0-45,980.0 (Secondary Demand)
⚡💎⚡ EDGE - HIGHEST PROBABILITY PLAY
Long from 46,280.0-46,340.0 pullback zone targeting breakout through 46,440.0-46,520.0
then continuation to 46,640.0-46,720.0
🔍 PRE-ENTRY CONFIRMATION SIGNALS
✅ Volume expansion on move toward 46,440.0 with bullish candle structure
✅ Break and hold above 46,460.0 with momentum or successful retest of 46,380.0
✅ Continuation pattern above 46,520.0 confirming breakout into new territory
📈 TRADE SETUP
🟢PRIMARY BIAS: BULLISH-BREAKOUT
Long Setup:
Entry: 46,280.0-46,340.0 on pullback
OR
Entry: 46,460.0+ on breakout confirmation
Stop Loss: 46,240.0
🎯Target 1: 46,520.0-46,580.0
🎯Target 2: 46,640.0-46,720.0
Risk/Reward: 1:2.4 / 1:4.0
🔄 BIAS FLIP CONDITIONS
🔴TURNS BEARISH IF:
✅Hard rejection at 46,440.0-46,520.0 with close back below 46,360.0 and volume
✅Break and sustained move below 46,240.0 with bearish momentum shift
✅Failed breakout creating distribution pattern below 46,420.0
⚡Then Target:
🎯46,140.0-46,220.0
🎯45,900.0-45,980.0
⚠️ RISK MANAGEMENT
Max Risk: 100-120 points from entry to stop
Position Size: Risk 1-1.5% of capital maximum
Time Stop: Exit by end of session if consolidation extends without breakout
Us30 Trade Set Up Oct 1 2025price swept PDL and flew up so i will wait to see a sweep of 15m SSL followed by 1m IFVG/CISD to target PDH or a sweep of BSL/Asia highs followed by a pullback into internal FVG to then go higher
www.tradingview.com

DowJones Key Trading levelsKey Support and Resistance Levels
Resistance Level 1: 46560
Resistance Level 2: 46700
Resistance Level 3: 46850
Support Level 1: 45960
Support Level 2: 45840
Support Level 3: 45670
This communication is for informational purposes only and should not be viewed as any form of recommendation as to a particular course of action or as investment advice. It is not intended as an offer or solicitation for the purchase or sale of any financial instrument or as an official confirmation of any transaction. Opinions, estimates and assumptions expressed herein are made as of the date of this communication and are subject to change without notice. This communication has been prepared based upon information, including market prices, data and other information, believed to be reliable; however, Trade Nation does not warrant its completeness or accuracy. All market prices and market data contained in or attached to this communication are indicative and subject to change without notice.
US30 Technical Breakdown – 10/01/2025📍 US30 Technical Breakdown – 10/01/2025
US30 slipped under 46,200, testing the 46,100 zone as support. EMAs rolling bearish → momentum shifting lower unless buyers defend.
📊 Market Behavior:
🔹 Lower highs forming after 46,500 rejection
🔹 46,100 acting as intraday demand
🔹 Below 45,837 → stronger sell-off risk
📌 Key Levels:
🔹 Resistance Zones:
46,250 → intraday barrier
46,400 → breakout ceiling
46,650 → bull target if regained
🔹 Support Zones:
46,100 → short-term demand
45,837 → key pivot
45,722 → deeper support
45,456 → bear target
🧠 Bias:
Leaning bearish ⚠️ unless price reclaims 46,250+
Bullish momentum only confirmed above 46,400 🚀
US30 - TRADER EDGE
🎯 KEY PIVOT ZONE
SUPPLY ZONE: 46,380-46,440
➡️4 POC lines converge with prominent VRVP node forming major resistance
➡️Dense volume accumulation zone with multiple failed breakout attempts
➡️Price currently BELOW pivot - bearish structure intact
📊 PRICE TARGETS-
UPSIDE TARGETS ⬆️
T1: 46,380-46,440
T2: 46,540-46,600
DOWNSIDE TARGETS ⬇️
T1: 45,920-45,980
T2: 45,640-45,700
⚡💎⚡ EDGE - HIGHEST PROBABILITY PLAY
Short from 46,320-46,380 rejection targeting 45,920-45,980 then 45,640-45,700
🔍 PRE-ENTRY CONFIRMATION SIGNALS
✅ Price rallies to 46,340+ showing bearish reversal pattern (shooting star/bearish engulfing)
✅ Rejection wick forms at supply zone with failure to sustain above 46,360
✅ Volume surge on reversal candle confirming selling pressure activation
📈 TRADE SETUP
🔴PRIMARY BIAS: BEARISH
Short Setup:
Entry: 46,340-46,370 after confirmations
Stop Loss: 46,465
🎯Target 1: 45,920-45,980
🎯Target 2: 45,640-45,700
Risk/Reward: 1:3.8 / 1:6.5
🔄 BIAS FLIP CONDITIONS
🟢TURNS BULLISH IF:
Decisive break and 2H close above 46,450
Volume expansion exceeds 1.5x recent average on breakout
Successful retest of 46,400-46,420 as new support floor
⚡Then Target:
🎯46,540-46,600
🎯46,700-46,760
⚠️ RISK MANAGEMENT:
Max Risk: 110 points per contract
Position Size: Risk 1-2% of account capital
Time Stop: Only trade within NYSE's peak volume segments
US30 - Bullish PUSHI definitely see US30 fighting to crash. But I do see another push to the upside.
US30 - Math Never Lies: Dow Jones Key Levels AheadDow Jones – Bullish Trend but a Short-Term Correction Possible
The main trend remains bullish, but the current market sentiment suggests a correction, which will be confirmed only if 46,630 holds.
Possible downside targets are:
45,560 – key level confirming deeper correction if price breaks and holds below.
45,050
44,460
and
43,600
and possibly 42,930.
All these levels are based on mathematical calculations, and each of them can provide a good risk/reward trading opportunity in lower timeframes — even if price breaks through them.
In the bigger picture, a correction confirmation sits around 45,560, while the main direction remains bullish, with upside targets already shared in my previous analyses, up to 48,000.
Enjoy the analysis and please support the post if you find it helpful — your support helps quality content get seen! 🚀📈

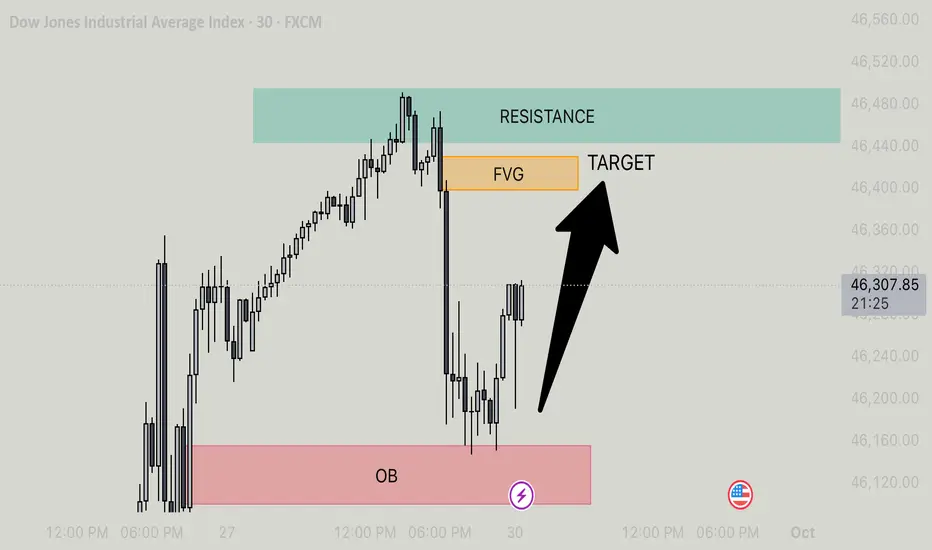
US30 - BULLISH MOMENTUM TARGETING FVG AFTER OB REJECTION Price is currently in a clear bullish phase following a strong reaction from the marked Order Block (OB) zone. This OB acted as a high-probability demand area, where institutional buying likely stepped in, reversing the prior bearish move and initiating a shift in market structure. The subsequent price action has formed a series of higher lows and bullish candles, indicating sustained buying pressure and a potential continuation toward the upside.
The next key area of interest is the Fair Value Gap (FVG), which represents an inefficiency in price where no trading occurred. These imbalances are often targeted by institutions to rebalance the market, and price tends to gravitate toward them. In this case, the FVG is positioned just below a well-defined resistance zone, creating a high-probability target for the current bullish move.
Given the lack of immediate overhead resistance before the FVG, and the presence of strong bullish momentum, price is expected to continue climbing until it reaches the FVG zone. Once this area is filled, we may see a reaction or potential rejection, but for now, the structure supports a move upward. Traders should watch for continuation patterns, such as bullish flags or breakouts, as confirmation that price will tap into the FVG before any significant reversal occurs.