WALLSTREETCFD trade ideas

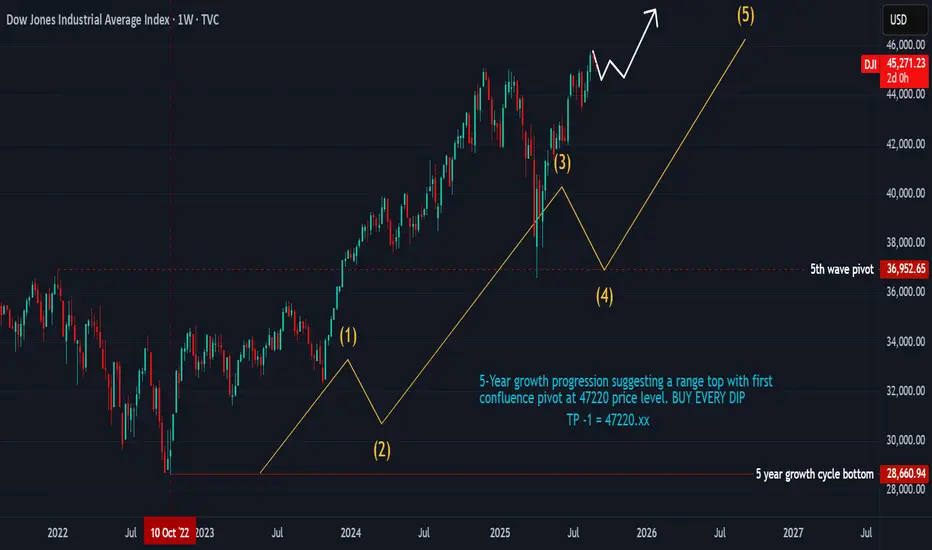
BUY EVERY DIP, HOLD FOR THE NEXT 7-MONTH CYCLE UNTIL OCTOBERThere are the current turmoil by tariffs and perceived recession, yet, the cycles strongly support a further advance from the March lows until October 2025. The bottom in March 2020 formed the base for the 5 year bull cycle nested within the larger 13 year cycle.
PRICE
The 2020 crash low formed at 18213.65, the decline in 2022 formed a bottom at 28660.94. We would have a price range Low - Low of (+10447.29 pts)
(28660.94 - 18213.65) = 10447.29 units
By projection if the range between the first two bottoms is 10447.29 we would expect the third bottom connecting three expanding points to be at 1.618 of 10447.29 points from 28660.94
28660.94 + (10447.29 x 1.618) = 45564.66
This makes the current top at 45073.63 through 45564.66 level a major support whereas its also a minor resistance for some correction and we expect price to move through this level.
TIME
Time connecting the three points 23/03/2020 - 03/01/2022 - 10/10/2022 with March 2020 as starting point would give us a time count (0.0 - 651 days - 931 days).
We find that between the two bottoms the top in Jan 2022 came in at 651 days. By projection we expect the next bottom to be at least 209 weeks or 1463 days from 10/10/2022 with a top located at a Phi variation of 651.
We would project a time range 1064 - 1099 days for a top and a decline into the third bottom 1463 days from 10/10/2022 and 2394 days from 23/03/2020. Trade safe, good luck.

THE BIG TOP ... THE MID-CYCLE CORRECTION COMES SOONTHE BULL IS NOT DEAD YET...
Alternate Cycle progression puts 1942 - 1947, 1982 - 1987. and 2022 - 2027 on the same phase of a larger 20-year cycle. This is the smallest growth cycle that completes in approximately five (5) years. It forms the first section of every alternate 20-year cycle and carves out a very identical fractal. This fractal remerges every 40 to 43 years. This is the basis of Gann's 43-year cycle repetition.
1942 - 1947 5-year cycle
1982 - 1987 Cycle
2022 - 2027 Cycle in progression
Putting the price and time advances into a cumulative progression suggests that we are getting closer to a first correction at 47200 level. It also suggests that the next time and price for the current cycle is measurable and quantifiable with a very slim margin for error.
27th October is a major timeline to watch
Beyond that we have March 2026
TRADE PLAN:
We will close all buy entries in October
We will buy again in May 2026 for another 2-year bull cycle.
Follow for more updates

US30 ShortElite Analysis
Confirmations have not been met
Will execute once confirmations are fully met

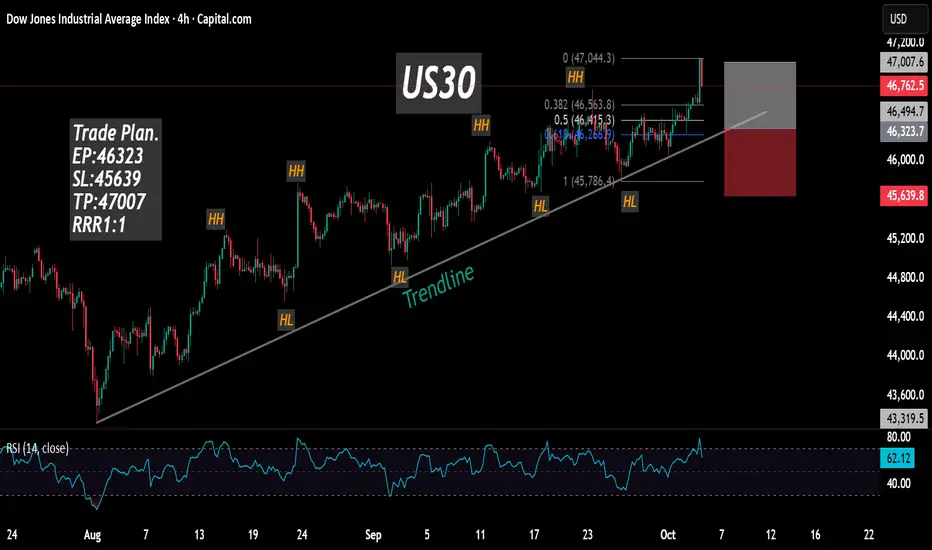
Us30 Trade Set Up Oct 6 2025Price made made ATH last week and is bullish making HH/HL on the 1h. There is a bullish 4h FVG under SSL and a bearish 1h FVG above BSL so i want to see either one tapped into first followed by a 1m IFVG/CISD to take to the level that wasnt tapped yet
www.tradingview.com

DOW JONES ANALYSIS💸 DOW JONES 💸
Chart: 1H
Overall Trend: Bullish
Current Market Structure: Short-Term Bearish
After the initial gap up & bullish push, price has been ranging in a tight consolidation zone with small candles — indicating indecision.
Scenario 1:
Bullish Continuation (Preferred if Demand Holds)
• Price retraces into the GAP UP demand zone (≈ 46,770–46,730).
• Bullish reaction here (strong wick / engulfing candle) could provide a buy setup targeting:
• First target: 46,910–46,960 (recent high)
• Final target: New ATH zone (47,051–47,088)
Scenario 2:
Deeper Pullback
• If price fails to hold the gap demand zone, expect a deeper retracement toward 46,600–46,560, which is the next structural support.
✅ Summary:
The bias remains bullish, but a short-term retracement to fill the gap demand zone is likely before a push toward new highs. A clean rejection or bullish engulfing in that zone would offer a high-probability long setup.

$DJI📊 Key Market Predictions This Week
1️⃣ NY Fed Inflation Data (Tuesday): Prices in NY are already climbing inflation is back in the market.
2️⃣ Fed Meeting Minutes (Wednesday): Expect signals that the Fed is trying to better manage the economy. With the government shutdown, money and policy are being rearranged.
3️⃣ Powell Speaks (Thursday): His tone could set the stage for how aggressive or cautious the Fed will be moving forward.
4️⃣ MI Consumer Data (Friday): Sentiment may look steady as “buy now, pay later” options continue to keep spending alive.
5️⃣ Jobs Report (Friday, if shutdown ends): We could see a pickup, reflecting that investments are still entering the market despite uncertainty.
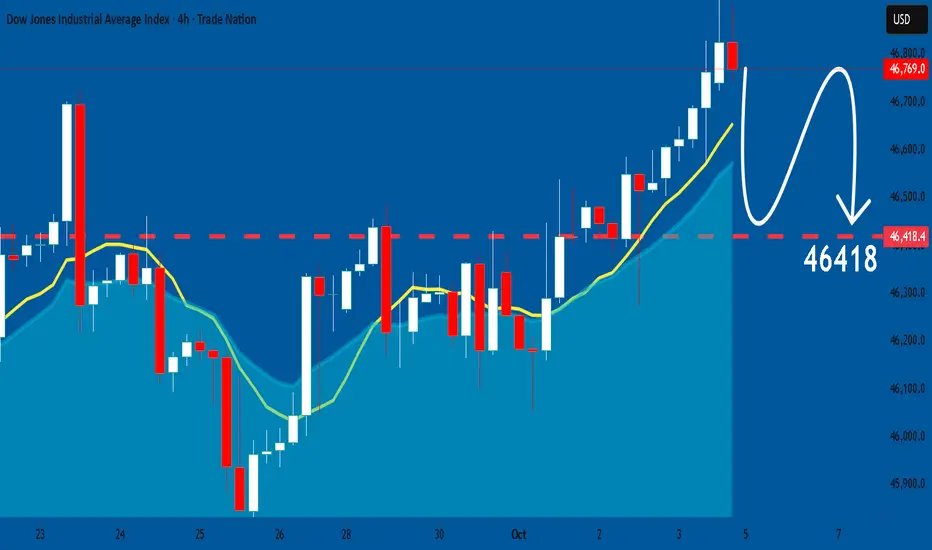
Dow updatedLooks like we had too much tequila.Seems hung over now.Buyers could come in and push it up.Lets see what happens

US30: Bearish Continuation is Expected! Here is Why:
Looking at the chart of US30 right now we are seeing some interesting price action on the lower timeframes. Thus a local move down seems to be quite likely.
Disclosure: I am part of Trade Nation's Influencer program and receive a monthly fee for using their TradingView charts in my analysis.
❤️ Please, support our work with like & comment! ❤️
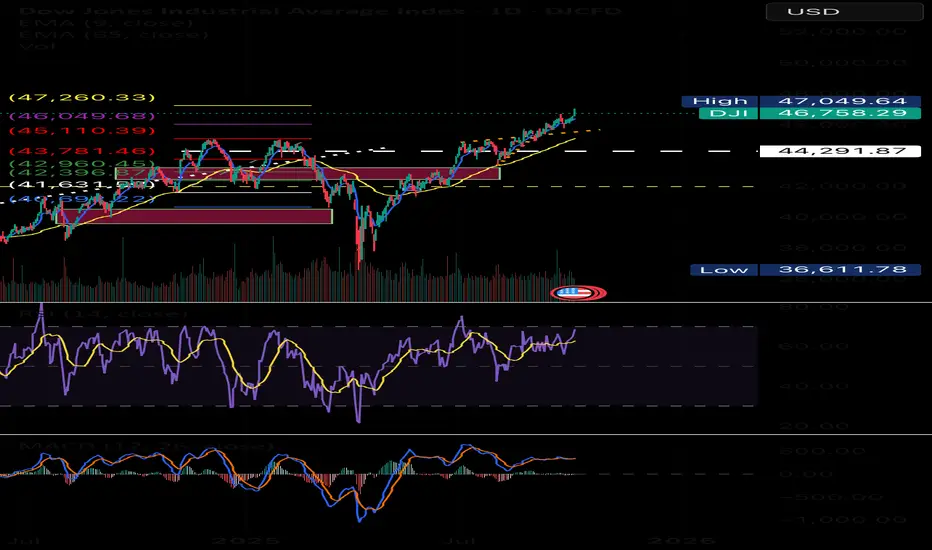
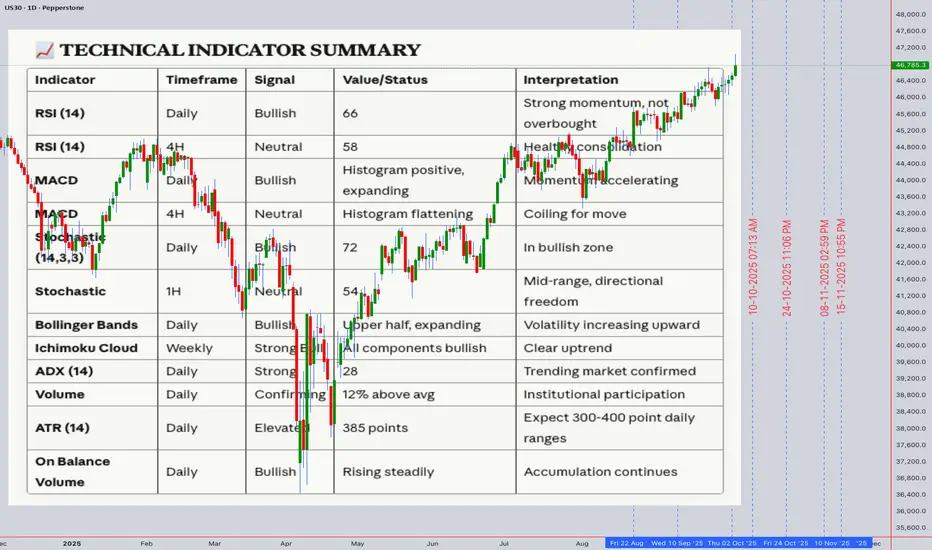
US30 -Dow Jones Industrial Average Technical Analysis & ForecastCurrent Price: 46,785.30 | 4th October 2025, 12:54 AM UTC+4
EXECUTIVE SUMMARY
The Dow Jones Industrial Average is trading at 46,785.30, showing consolidation near all-time highs. Multi-timeframe analysis reveals a bullish trend with caution signals emerging on shorter timeframes. Key resistance at 47,000-47,200 zone presents a critical decision point for continuation versus correction.
Bottom Line: Bullish bias remains intact on daily/weekly charts, but intraday traders should watch for potential pullback to 46,500-46,300 support zone before next leg higher.
MULTI-TIMEFRAME MARKET STRUCTURE
Monthly/Weekly Context (Swing Trading)
Trend: Strong bullish momentum maintained since October 2023 lows
Elliott Wave Count: Potential Wave 5 of larger degree impulse, suggesting final push before correction
Key Levels: Major support at 45,800-46,000 (previous breakout zone); resistance at 47,200-47,500
Daily Chart Analysis
Structure: Higher highs and higher lows pattern intact
Ichimoku Cloud: Price trading above bullish cloud; Tenkan-sen/Kijun-sen bullish cross active
Pattern Recognition: Ascending channel formation with upper boundary at 47,150
4-Hour Chart (Critical Timeframe)
Candlestick Patterns: Recent doji and spinning tops indicating indecision
RSI: Divergence warning - price making higher highs while RSI shows lower highs (bearish divergence)
Volume Profile: Declining volume on recent push higher suggests weakening momentum
1-Hour/30-Minute (Intraday Focus)
Microstructure: Double top formation developing at 46,850-46,900 zone
Bollinger Bands: Price touching upper band with band width expanding
VWAP: Trading 0.2% above daily VWAP (46,692) - moderately extended
TECHNICAL INDICATOR DEEP DIVE
Momentum Indicators
RSI (14):
Daily: 62 (neutral-bullish)
4H: 58 (declining from 72 two days ago)
1H: 54 (bearish divergence present)
Interpretation: Momentum cooling after recent rally; not yet oversold
Trend Indicators
Moving Averages:
20 EMA: 46,580 (immediate support)
50 EMA: 46,200 (critical support)
200 EMA: 44,800 (long-term trend support)
Golden Cross Status: Active and bullish (50 MA above 200 MA)
Volatility Indicators
Bollinger Bands (20,2): Price at upper band; squeeze releasing suggests increased volatility ahead
ATR (14): 285 points (elevated) - expect 250-350 point daily ranges
Volume Analysis
Volume Weighted Average Price: 46,692
Volume Trend: Declining on up-moves (distribution warning)
Anchored VWAP: From October 1st low at 46,450 - price 0.7% above anchor
HARMONIC & PATTERN ANALYSIS
Gann Analysis
Square of 9: Next resistance at 47,088 (90° from current cycle low); support at 46,488
Gann Angles: 1x1 angle from September low projects support at 46,550
Time Cycles: October 8-10 represents potential reversal window (45-48 trading days from last pivot)
Harmonic Patterns
Potential Bat Pattern: Monitoring for completion at 46,950-47,000 (0.886 retracement level)
Fibonacci Confluence: 1.618 extension of recent corrective wave targets 47,150
Wyckoff Analysis
Phase: Appears to be in Distribution Phase B (preliminary supply)
Spring/Shakeout Watch: False breakout above 47,000 could trigger sell-off
Elliott Wave Count
Primary Count: Wave 5 of Intermediate (3), targeting 47,400-47,800
Alternate Count: Wave B corrective triangle forming; expect breakdown if 46,500 breaks
SUPPORT & RESISTANCE FRAMEWORK
Immediate Resistance Zones
46,850-46,900 - Intraday double top / psychological
47,000-47,050 - Major psychological / round number / Gann level
47,150-47,200 - Channel top / Fibonacci 1.618 / weekly pivot
47,500-47,600 - All-time high extension target
Support Zones
46,650-46,700 - VWAP / hourly demand zone
46,500-46,550 - 20 EMA / Gann 1x1 angle / pivot
46,200-46,300 - 50 EMA / gap fill / strong demand
45,800-46,000 - Daily cloud / major breakout point
TRAP SCENARIOS
Bull Trap Alert
Setup: Break above 47,000 with low volume followed by immediate reversal
Confirmation: Close below 46,800 same day with volume spike
Target: Retest 46,300-46,500 zone
Bear Trap Potential
Setup: Quick spike below 46,500 followed by rapid recovery
Confirmation: Close above 46,650 with strong volume
Target: Resume rally toward 47,200+
INTRADAY TRADING PLAN (October 4-11, 2025)
Day Trading Strategy - Scalp Setups
Bullish Scenario (60% Probability)
Entry Criteria:
Pullback to 46,650-46,700 with bullish engulfing or hammer on 15M chart
RSI (15M) reaches 40-45 oversold region
Volume contraction during pullback, expansion on reversal
Trade Setup:
Entry: 46,680-46,720
Stop Loss: 46,580 (100 points risk)
Target 1: 46,850 (130 points, 1.3:1 R/R) - scale out 50%
Target 2: 47,000 (280 points, 2.8:1 R/R) - scale out 30%
Target 3: 47,150 (430 points, 4.3:1 R/R) - let 20% run
Optimal Entry Times:
9:45-10:15 AM EST (post-opening volatility)
2:00-3:00 PM EST (afternoon momentum)
Bearish Scenario (40% Probability)
Entry Criteria:
Rejection at 46,900-47,000 with bearish engulfing on 15M/30M
RSI (15M) overbought above 70
Break below 46,780 (short-term support)
Trade Setup:
Entry: 46,760-46,800 (after break confirmation)
Stop Loss: 46,920 (120-160 points risk)
Target 1: 46,650 (110-150 points) - cover 50%
Target 2: 46,500 (260-300 points) - cover 30%
Target 3: 46,300 (460-500 points) - trail remainder
Optimal Entry Times:
10:30-11:00 AM EST (if morning rally fails)
3:00-3:45 PM EST (late-day profit taking)
SWING TRADING PLAN (1-4 Week Horizon)
Primary Swing Setup - Bullish Continuation
Entry Strategy:
Ideal Entry Zone: 46,300-46,500 (if pullback materializes)
Aggressive Entry: Current levels with 46,450 stop
Pattern: Bull flag/ascending channel continuation
Position Management:
Entry: 46,400 (scale in 30% at 46,500, 40% at 46,400, 30% at 46,300 if available)
Stop Loss: 46,100 (300 points, daily close below)
Target 1: 47,200 (700-800 points) - reduce 40%
Target 2: 47,800 (1,300-1,400 points) - reduce 30%
Target 3: 48,500 (2,000+ points) - trail with 50 EMA
Timeframe: 2-4 weeks
Confidence Level: 65%
Alternative Swing Setup - Mean Reversion Short
Activation Criteria:
Daily close below 46,500 with volume above 20-day average
RSI daily breaks below 50
Break of ascending trendline from September
Trade Setup:
Entry: 46,450-46,500 (after confirmation)
Stop Loss: 46,850 (350-400 points)
Target 1: 46,000 (450-500 points) - cover 50%
Target 2: 45,600 (850-900 points) - cover 30%
Target 3: 45,200 (1,250-1,300 points) - trail remainder
Timeframe: 1-3 weeks
Confidence Level: 35% (lower probability setup)
WEEKLY ROADMAP (October 4-11)
Monday-Tuesday (Oct 6-7):
Expected Range: 46,500-47,100
Bias: Neutral to bullish - watch for pullback completion
Key Level: 46,700 (holding above maintains bullish structure)
Wednesday-Thursday (Oct 8-9):
Gann Time Window: Potential reversal period
Strategy: Reduce position size; let patterns develop
Watch: Economic data releases could spike volatility
Friday (Oct 10):
Weekly Close: Critical for swing positioning
Bullish Confirmation: Close above 46,850
Bearish Warning: Close below 46,600
RISK MANAGEMENT GUIDELINES
Position Sizing
Intraday: Risk 0.5-1% of capital per trade
Swing Trades: Risk 1-2% of capital per trade
Max Portfolio Heat: 4-5% across all positions
Key Risk Levels
Invalidation Point (Bulls): Daily close below 46,100
Invalidation Point (Bears): Daily close above 47,300
Correlation Monitoring
Watch US10Y yields (inverse correlation currently strong)
S&P 500 and Nasdaq leading/lagging analysis
Dollar Index impact on risk appetite
MARKET CONTEXT & EXTERNAL FACTORS
Macroeconomic Considerations
Federal Reserve policy stance remains influential
Q3 earnings season beginning - watch corporate guidance
Geopolitical tensions requiring monitoring (Middle East, US-China)
Sentiment Indicators
VIX below 15 suggests complacency - potential volatility spike risk
Put/Call ratios showing neutral sentiment
Institutional flows appear distributive near highs
Seasonal Patterns
October historically volatile (correction risk)
Year-end rally potential if correction occurs early month
FINAL TRADING RECOMMENDATIONS
For Intraday Traders:
Best Setup: Wait for pullback to 46,650-46,700 for low-risk long entries
Avoid: Chasing above 46,900 without confirmation
Focus Timeframes: 15-minute and 1-hour charts for entries; 5-minute for exits
For Swing Traders:
Patience Required: Current levels are extended; wait for 46,300-46,500 zone
Alternative: Small position at current levels with very tight stops (46,650)
Best Risk/Reward: Appears in the 46,300-46,400 region
Overall Market Outlook:
Bullish bias maintained with 60-65% probability of testing 47,200+ in coming 2-3 weeks. However, near-term consolidation or shallow pullback (5-7%) is healthy and would provide better entry opportunities. The combination of weakening momentum indicators and potential Gann time reversal window suggests patience will be rewarded.
TRADING PSYCHOLOGY NOTES
FOMO Warning: Resist urge to chase at current elevated levels
Discipline: Stick to predefined entry zones even if price continues higher
Flexibility: Be ready to flip bias if key levels break (46,100 bears / 47,300 bulls)
Disclaimer: This analysis is for educational purposes only. Trading involves substantial risk of loss. Always conduct your own research and consult with financial advisors before making investment decisions. Past performance does not guarantee future results.
Next Update: October 7, 2025 (Mid-week review with refined levels)
Analysis combines multiple technical methodologies for comprehensive market perspective. No single indicator should be used in isolation. Confluence of signals increases probability of success.
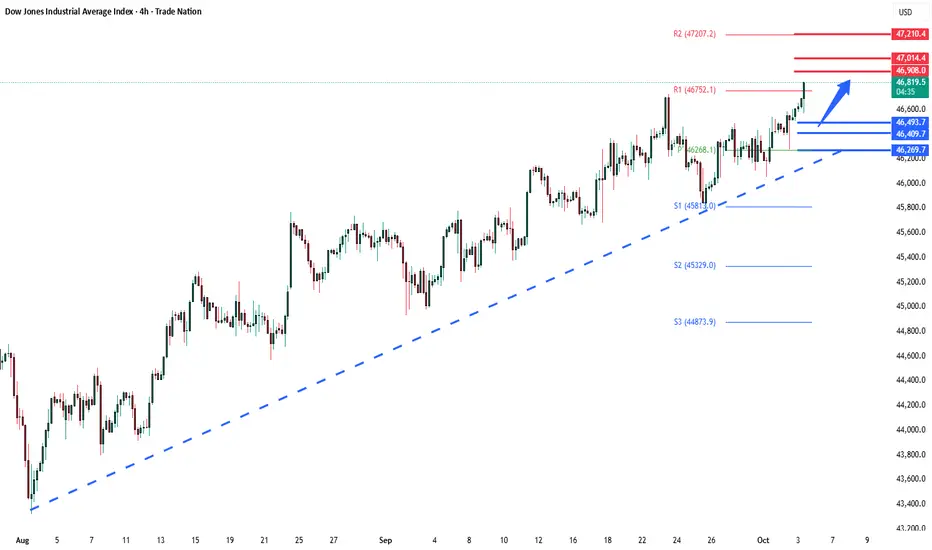
DowJones Key Trading levels Key Support and Resistance Levels
Resistance Level 1: 46900
Resistance Level 2: 47000
Resistance Level 3: 47210
Support Level 1: 46490
Support Level 2: 46410
Support Level 3: 46270
This communication is for informational purposes only and should not be viewed as any form of recommendation as to a particular course of action or as investment advice. It is not intended as an offer or solicitation for the purchase or sale of any financial instrument or as an official confirmation of any transaction. Opinions, estimates and assumptions expressed herein are made as of the date of this communication and are subject to change without notice. This communication has been prepared based upon information, including market prices, data and other information, believed to be reliable; however, Trade Nation does not warrant its completeness or accuracy. All market prices and market data contained in or attached to this communication are indicative and subject to change without notice.
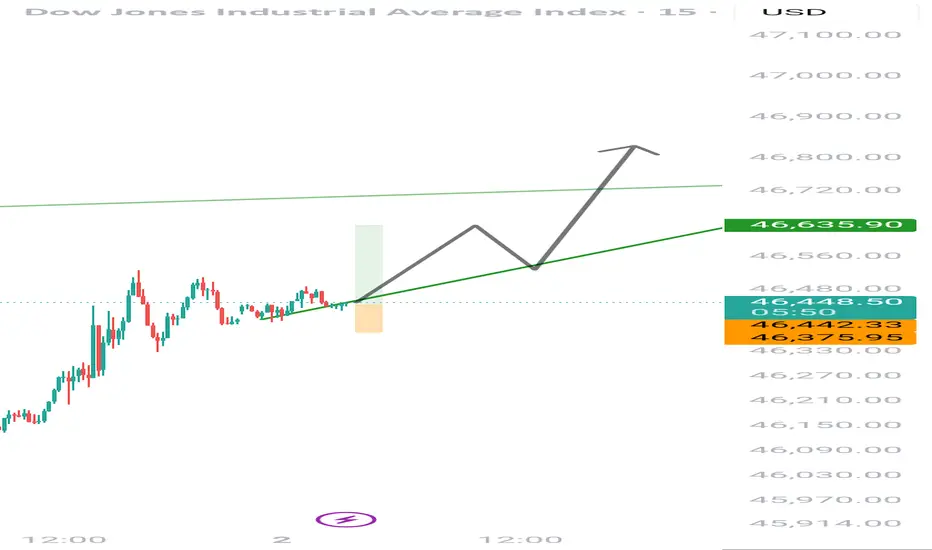
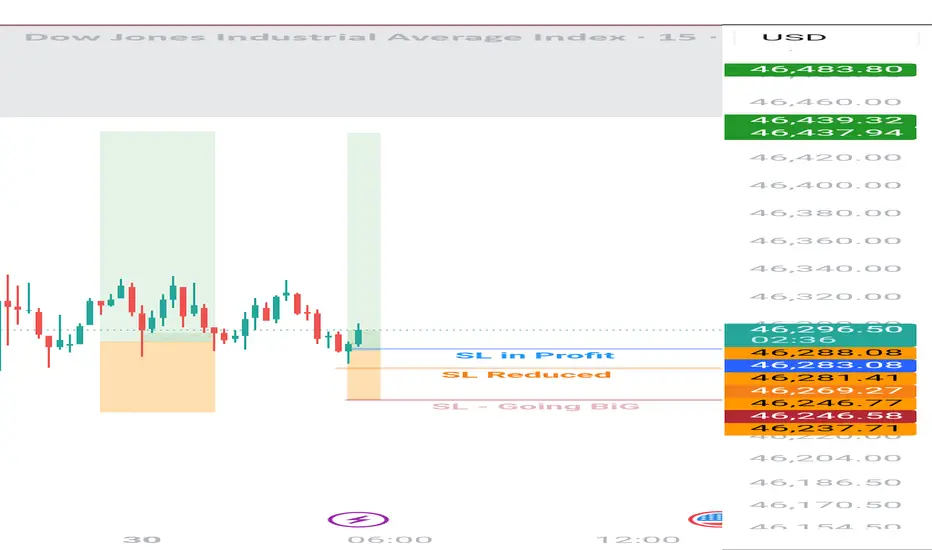
Us30 Trade Set Up Oct 3 2025Price is trading above PDH so still bullish. If this 4h FVG gets respected and SSL gets swept i will look for buys to BSL/ATH but price has changed state on the 15m and 1h so i price comes to retest the 15m CISD and respects it i will look for IFVG on the 1m to take to lower SSL
www.tradingview.com

long Dow JonesIndexes turn bullish after a government shutdown because the disruption is temporary, the Fed is seen as more dovish, sidelined cash comes back into risk assets, and earnings aren’t really hurt. Once uncertainty lifts, markets reprice higher

Looking to SHORT US30Thou we are in a Bullish Trend and All time High which might be difficult to time or predict the local top or major Resistance level, however IMO we have been moving up with a Rising Wedge Pattern on the daily which symbolize a potential "Massive Pullback"

Us30 Trade Set Up Sep 30 2025Price is making HH/HL now so structure is bullish. I will want to see a close above the 15m FVG for price to go higher into the 4h FVG and higher to PDH
www.tradingview.com

Dow Oversold bounce back?Key Support and Resistance Levels
Resistance Level 1: 46560
Resistance Level 2: 46700
Resistance Level 3: 46850
Support Level 1: 45960
Support Level 2: 45840
Support Level 3: 45670
This communication is for informational purposes only and should not be viewed as any form of recommendation as to a particular course of action or as investment advice. It is not intended as an offer or solicitation for the purchase or sale of any financial instrument or as an official confirmation of any transaction. Opinions, estimates and assumptions expressed herein are made as of the date of this communication and are subject to change without notice. This communication has been prepared based upon information, including market prices, data and other information, believed to be reliable; however, Trade Nation does not warrant its completeness or accuracy. All market prices and market data contained in or attached to this communication are indicative and subject to change without notice.

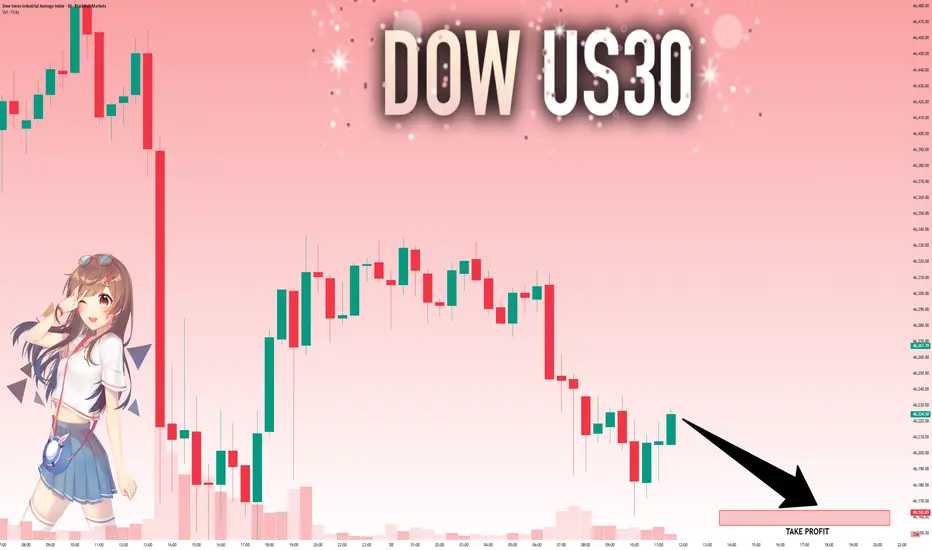
US30: Absolute Price Collapse Ahead! Short!
My dear friends,
Today we will analyse US30 together☺️
The recent price action suggests a shift in mid-term momentum. A break below the current local range around 46,224.50 will confirm the new direction downwards with the target being the next key level of 46,164.12 and a reconvened placement of a stop-loss beyond the range.
❤️Sending you lots of Love and Hugs❤️
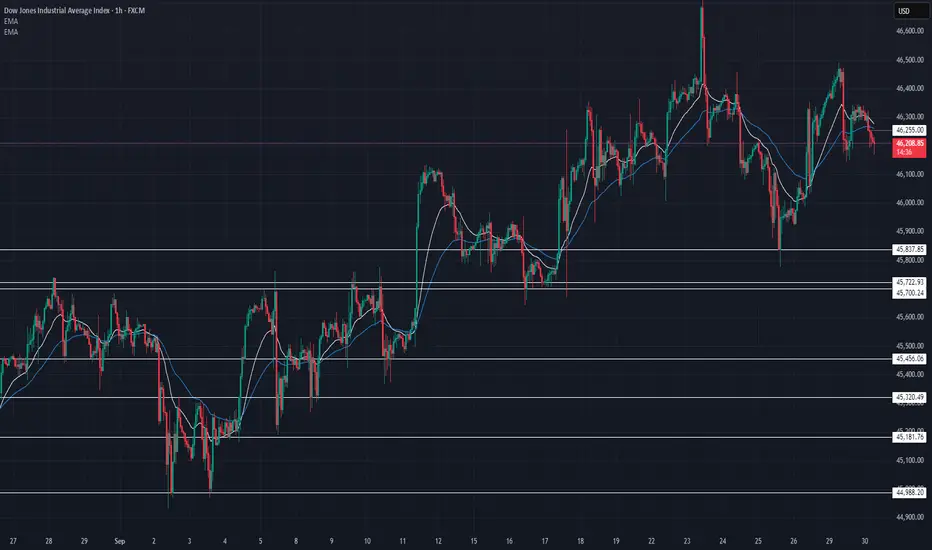
US30 Technical Breakdown – 09/30/2025📍 US30 Technical Breakdown – 09/30/2025
US30 is consolidating after rejecting 46,450, holding above 46,100 support. EMAs are tightening → market waiting for direction.
📊 Market Behavior:
🔹 Sideways chop between 46,100 – 46,400
🔹 Sellers defending the upper zone
🔹 Buyers still holding structure above 45,800
📌 Key Levels:
🔹 Resistance Zones:
46,400 → rejection zone
46,650 → breakout trigger
🔹 Support Zones:
46,100 → short-term demand
45,837 → key pivot
45,722 → deeper support
45,181 → bear target if broken
🧠 Bias:
Neutral → breakout mode.
Bullish above 46,400 🚀 / Bearish below 46,100 ⚠️
possibility of uptrend The index is expected to consolidate above the support level and then start an upward trend.
Otherwise, a downward trend will form and the support level will be broken.
