Us30 Trade Set Up Sep 29 2025Price is now bullish creating HH/HL and closed above PDH so i will look for internal SSL to be swept then a 1m IFVG/CISD retest to price higher towards BSL
www.tradingview.com
WALLSTREETCFD trade ideas

#DJI - Pivot Point is 45258Date: 09-09-2025
#DJI - Current Price: 45515
Pivot Point: 45258
Upside Resistance Levels:
Resistance 1: 45796
Resistance 2: 46147
Resistance 3: 46498
Resistance 4: 46964
Resistance 5: 47429
Downside Support Levels:
Support 1: 44723
Support 2: 44371
Support 3: 44018
Support 4: 43553
Support 5: 43088
#TradingView #Nifty #BankNifty #DJI #NDQ #SENSEX #DAX #USOIL #GOLD #SILVER

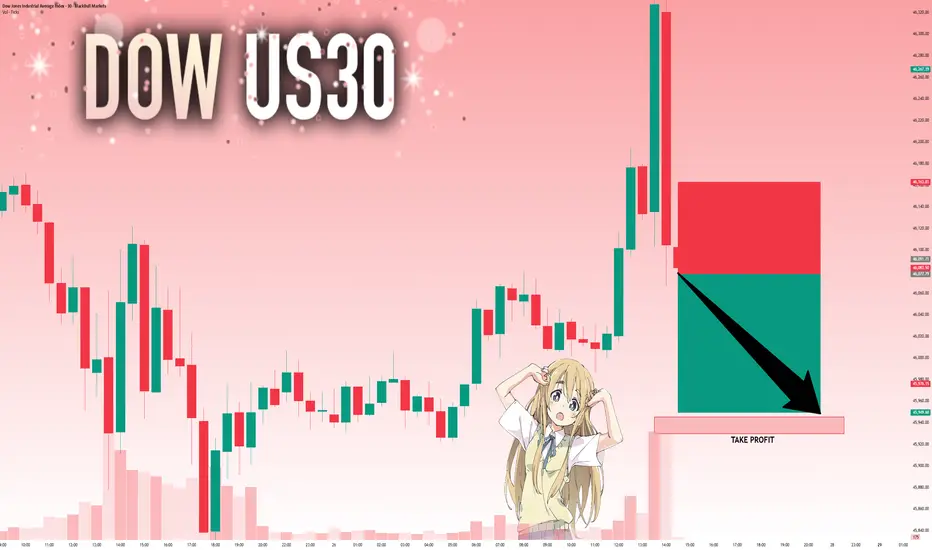
Us30 - bullish push before a big DropI see US30 rising another 150 points before a possible pullback.
Kwrwshmhmdy4 We saw signs of a decline in the US30 chart last week. And this decline was enough to convince retail traders to enter a sell trade and place a stop at the highest peak. And this is exactly the wrong thing to do, because the market will turn around and hit all the stop losses and with the volume that enters the market, the price will flow down. So the market will first go up and eventually fall more sharply.

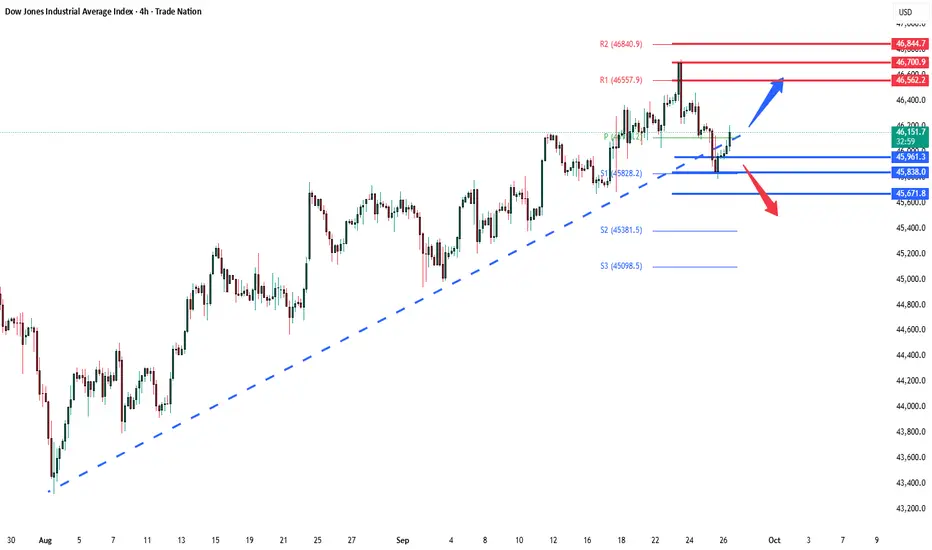
US30 A Fall Expected! SELL
My dear subscribers,
My technical analysis for US30 is below:
The price is coiling around a solid key level - 46250
Bias - Bearish
Technical Indicators: Pivot Points High anticipates a potential price reversal.
Super trend shows a clear sell, giving a perfect indicators' convergence.
Goal - 46113
My Stop Loss - 46325
About Used Indicators:
By the very nature of the supertrend indicator, it offers firm support and resistance levels for traders to enter and exit trades. Additionally, it also provides signals for setting stop losses
Disclosure: I am part of Trade Nation's Influencer program and receive a monthly fee for using their TradingView charts in my analysis.
———————————
WISH YOU ALL LUCK

US30: 50K MAGNET ACTIVATED! Historic Breakout Loading# 🚀 US30: 50K MAGNET ACTIVATED! Historic Breakout Loading 📊
Current Price: 49,269.7 | Date: Sept 27, 2025 ⏰
📈 INTRADAY TRADING SETUPS (Next 5 Days)
🎯 BULLISH SCENARIO
Entry Zone: 49,200 - 49,300 📍
Stop Loss: 49,000 🛑
Target 1: 49,600 🎯
Target 2: 49,850 🚀
🎯 BEARISH SCENARIO
Entry Zone: 49,350 - 49,400 📍
Stop Loss: 49,500 🛑
Target 1: 48,900 🎯
Target 2: 48,650 📉
🔍 TECHNICAL ANALYSIS BREAKDOWN
📊 KEY INDICATORS STATUS:
RSI (14): 64.8 ⚡ *Bullish Momentum Zone*
Bollinger Bands: Upper Band Squeeze 🔥
VWAP: 49,180 - Strong Support Base 💪
EMA 20: 49,150 ✅ *Golden Cross Active*
Volume: Above Average 📊 *Institutional Flow*
🌊 WAVE ANALYSIS:
Elliott Wave: Wave 3 Extension in Progress 🌊
Fibonacci Target: 50,200 (161.8% Extension) 🎯
🔄 HARMONIC PATTERNS:
Bullish Cypher Completion at 49,100 ✨
Gartley PRZ Active - 49,050 Zone 🔄
⚖️ SWING TRADING OUTLOOK (1-4 Weeks)
🚀 BULLISH TARGETS:
Psychological: 50,000 🏆
Weekly Target: 50,300 🌙
Gann Square: 50,625 ⭐
📉 BEARISH INVALIDATION:
Weekly Support: 48,800 ⚠️
Critical Break: 48,500 🚨
🎭 MARKET STRUCTURE:
Trend: Strong Bullish Impulse 💪
Momentum: Accelerating 🔥
Wyckoff Phase: Mark-up Phase 📈
Ichimoku: All Systems Green 🟢
🏆 HISTORIC LEVELS:
50K Psychological: Major Magnet 🧲
All-Time High: 49,450 (Breaking Soon!) 💥
Monthly Pivot: 49,100 Support 🛡️
⚡ RISK MANAGEMENT:
Max Risk per Trade: 1% 🛡️
R:R Ratio: Minimum 1:3 ⚖️
Trailing Stops: Every 200 points 📏
🌍 MARKET CATALYSTS:
Economic Data Supporting Rally 📈
Corporate Earnings Momentum 💼
Fed Policy Tailwinds Continue 🏛️
🔥 CRITICAL WATCH ZONES:
Breakout: 49,350 confirmed close 💥
Support: 49,100 | 48,950 | 48,800 🛡️
Resistance: 49,500 | 49,750 | 50,000 🚧
🎯 FINAL VERDICT:
US30 poised for HISTORIC BREAKOUT to 50K! 🚀
Multiple confluences aligning perfectly! 💯
Bull flag formation targeting new ATH! 📈
Trade Management: Buy dips to VWAP support 💎
Key Level: Hold above 49,100 crucial 🔑
---
*⚠️ Disclaimer: Trading involves significant risk. Use proper position sizing. Educational purposes only.*
For individuals seeking to enhance their trading abilities based on the analyses provided, I recommend exploring the mentoring program offered by Shunya Trade. (Website: shunya dot trade)
I would appreciate your feedback on this analysis, as it will serve as a valuable resource for future endeavors.
Sincerely,
Shunya.Trade
Website: shunya dot trade
🔔 Follow for Live Updates | 💬 Drop Your 50K Predictions Below

US30: Bearish Continuation & Short Trade
US30
- Classic bearish setup
- Our team expects bearish continuation
SUGGESTED TRADE:
Swing Trade
Short US30
Entry Point - 46297
Stop Loss - 46377
Take Profit - 46148
Our Risk - 1%
Start protection of your profits from lower levels
Disclosure: I am part of Trade Nation's Influencer program and receive a monthly fee for using their TradingView charts in my analysis.
❤️ Please, support our work with like & comment! ❤️

US30 - TRADER EDGE💎 Diamond Difference Maker:
Everyone sees the same chart, but only those who read the full breakdown see the edge.
The complete setup is served on a silver platter - you still have to pick up the fork -
Take action and apply your own special skills, insight, and adaptability with ever-changing markets.
🎯 KEY PIVOT ZONE
SUPPLY ZONE: 46,400 - 46,500
Heavy volume concentration at VRVP node around 46,450
Multiple session POCs aligning in upper range
Major resistance showing institutional distribution
📊 PRICE TARGETS
UPSIDE TARGETS ⬆️
T1: 46,400 - 46,500 (Primary supply test)
T2: 46,600 - 46,700 (Higher resistance node)
DOWNSIDE TARGETS ⬇️
T1: 46,000 - 46,100 (Support POC cluster)
T2: 45,800 - 45,900 (Lower volume concentration)
⚡⚡ EDGE - HIGHEST PROBABILITY PLAY
Short from 46,400-46,500 supply rejection for move to 46,000-46,100
🔍 KEY CONFIRMATION SIGNALS
✅ Rejection at 46,400-46,500 with increased volume
✅ Break below 46,200 current support level
✅ Session POCs providing dynamic resistance on rallies
📈 TRADE SETUP
🔴PRIMARY BIAS: BEARISH
Short Setup:
Entry: 46,400 - 46,500 (on supply zone rejection)
Stop Loss: 46,550 (above supply invalidation)
Target 1: 46,000 - 46,100
Target 2: 45,800 - 45,900
Risk/Reward: 1:3
🔄 BIAS FLIP CONDITIONS
🟢TURNS BULLISH IF:
Break and hold above 46,550 with strong volume
Reclaim 46,400-46,500 as support on retest
POCs start acting as support levels
⚡Then Target:
46,700 - 46,800 (next resistance cluster)
46,900 - 47,000 (higher volume node)
⚠️ RISK MANAGEMENT
Max Risk: 250 points per position
Position Size: Risk 1-2% of account per trade
Time Stop: Close before major news or market close

Dow Jones Industrial to 65kFrom the fib extension and intersection with upper channel, let's see
Not financial advice

We are close to a very RARE and HISTORICAL event.We are close to a very RARE and HISTORICAL event.
This would be only the 2nd time in over 125 years that we get a "SUPER" Capital Rotation Event.
Stock markets get destroyed when adjusted for inflation...
While gold, silver and friends enjoy their BEST years of outperformance!

US30: Target Is Down! Short!
My dear friends,
Today we will analyse US30 together☺️
The recent price action suggests a shift in mid-term momentum. A break below the current local range around 46,077.79 will confirm the new direction downwards with the target being the next key level of 45,945.23 and a reconvened placement of a stop-loss beyond the range.
❤️Sending you lots of Love and Hugs❤️
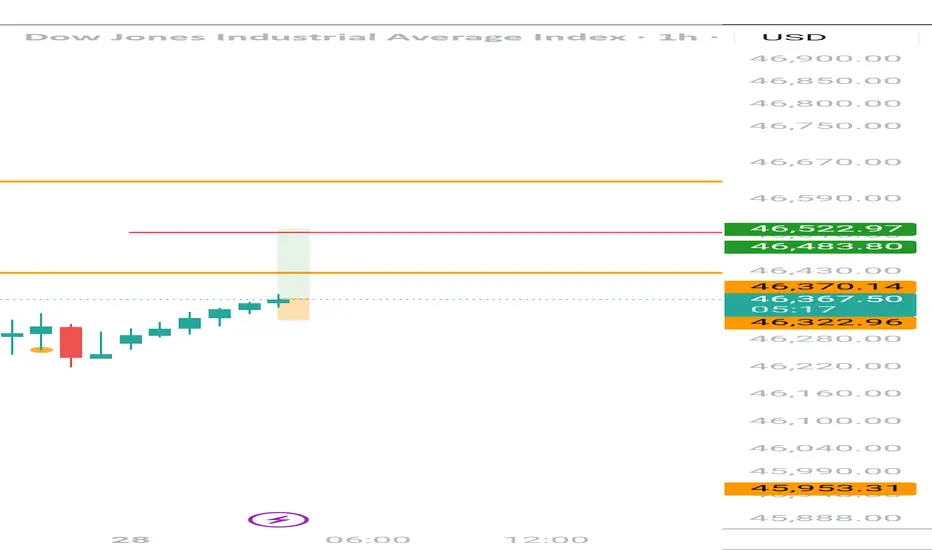
Us30 US30 is approaching a key demand zone where strong buying pressure has previously emerged. If buyers step in again, we could see a bullish reversal or continuation. However, a clean break below this zone may indicate weakening momentum and open the door to further downside.

DowJones Key Trading Levels Key Support and Resistance Levels
Resistance Level 1: 46560
Resistance Level 2: 46700
Resistance Level 3: 46850
Support Level 1: 45960
Support Level 2: 45840
Support Level 3: 45670
This communication is for informational purposes only and should not be viewed as any form of recommendation as to a particular course of action or as investment advice. It is not intended as an offer or solicitation for the purchase or sale of any financial instrument or as an official confirmation of any transaction. Opinions, estimates and assumptions expressed herein are made as of the date of this communication and are subject to change without notice. This communication has been prepared based upon information, including market prices, data and other information, believed to be reliable; however, Trade Nation does not warrant its completeness or accuracy. All market prices and market data contained in or attached to this communication are indicative and subject to change without notice.
Us30 Trade Set Up Sep 26 2025Price pushed up from the daily FVG yesterday and has formed a 4h bearish FVG which acts has imbalance to be filled to if price continues to make internal bullish structure i will look for buys to target 50% of the 4h FVG/PDH
www.tradingview.com

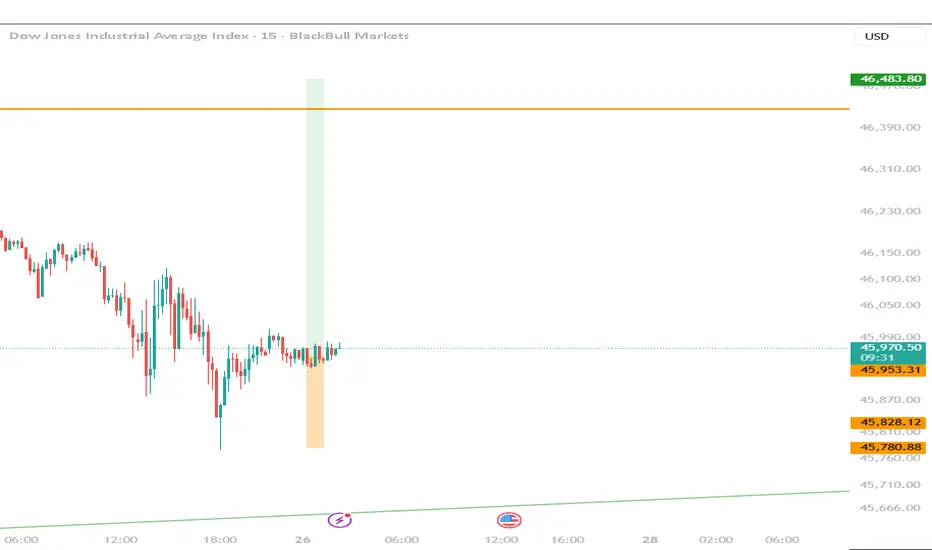
US30 DropsUS30 looks bearish on the M30 timeframe with one price target of 46,108.7 and a bias of 46,002.2.
The setup will be invalidated if the price breaches 46,463.5, which is derived from bearish pressure at the H4 to Daily resistance.
The high at 46,363.4 is held by the 46,417 area zone, and the bulls' momentum is also challenged by the bearish highs at 46,353.8. Overall, the sentiment is therefore bearish.
Happy Trading,
K.
Not trading advice

US30 – Bears Eye 46,000 Ahead of Key GDP ReleaseUS30 – Overview
The Dow Jones remains under bearish momentum as traders await the key U.S. GDP report.
Markets expect a sharp rebound from the previous -0.5% reading to around 3.3%.
A stronger-than-expected result would likely pressure US30 lower, while a print closer to 2.0% could spark volatility and choppy price action.
Technical View
Bearish Scenario:
Price is expected to test 46,000 first.
🔻 A confirmed 1H close below 46,000 would extend the bearish trend toward 45,680 → 45,520.
Bullish Scenario:
If price stabilizes above 46,120, US30 is likely to consolidate within the 46,120 – 46,300 range.
A confirmed breakout above 46,300 would open the way toward 46,400 → 46,620.
Key Levels
Pivot: 46,120
Resistance: 46,300 – 46,400 – 46,620
Support: 46,000 – 45,680 – 45,520
The GDP release will be the main driver.
Above 46,120: consolidation with bullish attempts.
Below 46,000: continuation of the bearish trend toward deeper supports.

US30 Analysis (Short Bias)I expect US30 to remain bearish this week. Current price action suggests weakness, with momentum favoring sellers. If market conditions hold, we may see a continuation to the downside, and today’s session is also likely to close bearish. A short position looks favorable at this point, but as always, risk management is key.
The last week’s predictions toyed with my analysis, but this week might just be the setup for a stronger sell opportunity.

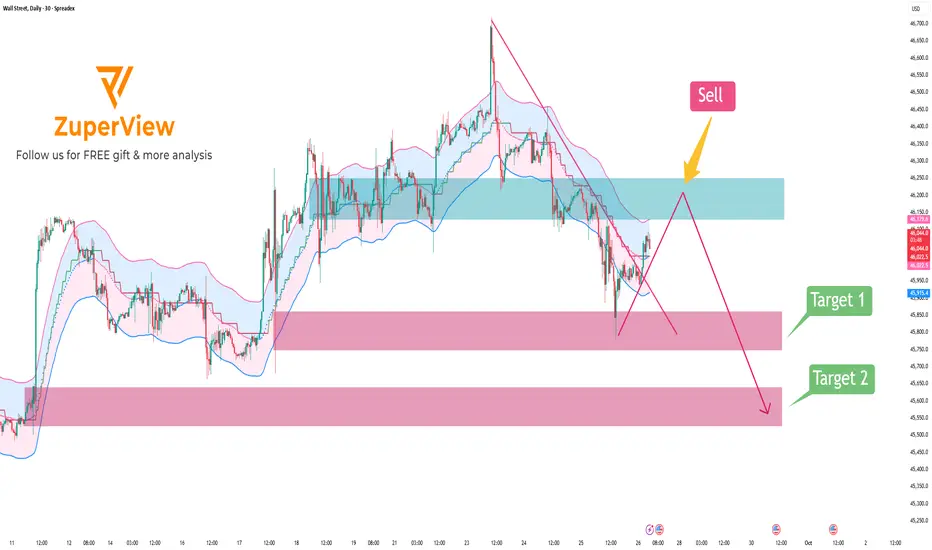
US30: Rebound to resistance & continue to break down
📝 1. Market Context
The SPREADEX:DJI dropped sharply from the recent high around 46,700 down to near 45,700, showing that sellers are currently in control in the short term. After this sharp decline, price is experiencing a mild recovery but still remains within a clearly defined downtrend channel and below key resistance.
🟥 2. Resistance Zone
The major resistance is located around 46,250 – 46,130 (highlighted in blue on the chart):
• This zone overlaps with the EMA and the upper band of the Keltner Channel.
• It was previously a sideways consolidation area that has now turned into resistance.
• It also intersects with the descending trendline, making a bearish rejection likely.
🟩 3. Support Zone
The nearest support lies at 45,858 – 45,748 (first pink zone).
If price breaks below this level, it is likely to continue falling toward the lower support zone at 45,520 – 45,640 (second pink zone).
🚨 4. Bearish Scenario
• Main scenario: Wait for a price pullback into the 46,250 – 46,130 area and watch for bearish signals → then SELL.
• Target: First target at 45,860 – 45,750 → if broken, expect further decline toward 45,520 – 45,640.
• Invalidation: A daily close above 46,250 would invalidate this bearish setup.
Please like and comment to support our traders. Your feedback motivates us to produce more analysis in the future 🙏✨
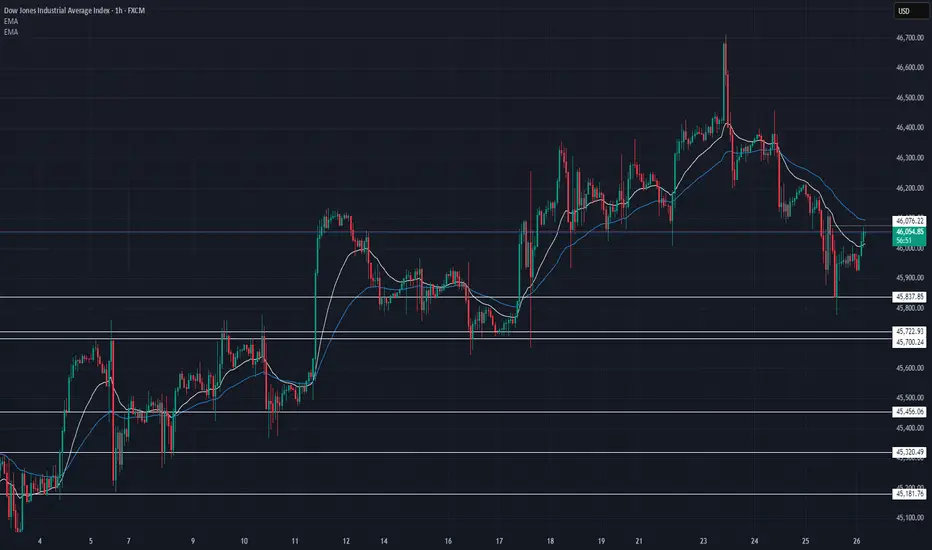
US30 Technical Breakdown – 09/26/2025📍 US30 Technical Breakdown – 09/26/2025
Dow Jones pulled back from its 46,650 peak and dipped under 46,000, now retesting the 46,050 zone. Momentum has shifted bearish short-term, but bulls defending key supports could spark a bounce.
📊 Market Behavior:
🔹 Sharp rejection from recent highs
🔹 EMA crossover showing weakness ⚠️
🔹 Buyers stepping in at 45,800–45,700
📌 Key Levels:
🔹 Resistance Zones:
46,100 → intraday test zone
46,300 → breakout confirmation
46,650 → major top
🔹 Support Zones:
45,837 → first demand
45,722 → key pivot support
45,456 → deeper retracement
45,181 → strong buffer
🧠 Bias:
Short-term bearish 🔴
Holding 45,700 keeps mid-term bullish case alive.
US30 - Buy - RR 2:1Price is being at a H4 demand zone with a lot of buy orders waiting to be triggered. Ready for the move up high

Dow rolls over, shifting directional risksDirectional risks in the Dow Jones contract appear more balanced following the break of uptrend support earlier this week, a view supported by momentum indicators such as RSI (14) and MACD, which have also rolled over, delivering a neutral signal. More weight should be placed on price action in the near term rather than maintaining a specific bias.
If the price can hold above support at 45,762, longs could be established above the level with a stop beneath for protection, targeting the record high of 46,723 set earlier this month. Should the uptrend break lead to an extension of the bearish move beneath 45,762, the setup could be flipped, with shorts placed below the level and a stop above for protection. The 50DMA, 45,000 or 44,500 screen as potential targets.
Good luck!
DS

US30 - Pullback The Dow has been on a very aggressive bullish run but a pullback is due in my opinion. The volume has diminished will continue to drop before it continues to move on up.
US30 Technical Analysis 1 Hour chart 📉 US30 Technical Analysis (1H Chart)
US30 is currently trading at 45,936 and remains inside a well-defined descending channel, showing strong bearish momentum.
• Trend: Price broke below the previous support (around 46,105 – 46,133) and retested it as resistance, confirming bearish continuation.
• Entry Zone: The rejection candle around the retest zone suggests sellers are still in control.
• Target Levels:
• First support: 45,911
• Next bearish target zone: 45,774 – 45,590 (lower channel support)
• Invalidation: A clean break and 1H close above 46,133 would invalidate the bearish setup and open room for bullish correction.
👉 Bias remains bearish as long as price stays under 46,100. Short-term downside continuation expected toward 45,700 – 45,600.
