Trade ideas

Potential bullish bounce off?Dow Jones (US30) has bounced off the pivot, which is a pullback support and could rise to the 1st resistance, which is a swing high resistance.
Pivot: 46,869.22
1st Support: 46,429.35
1st Resistance: 48,012.20
Disclaimer:
The above opinions given constitute general market commentary, and do not constitute the opinion or advice of IC Markets or any form of personal or investment advice.
Any opinions, news, research, analyses, prices, other information, or links to third-party sites contained on this website are provided on an "as-is" basis, are intended only to be informative, is not an advice nor a recommendation, nor research, or a record of our trading prices, or an offer of, or solicitation for a transaction in any financial instrument and thus should not be treated as such. The information provided does not involve any specific investment objectives, financial situation and needs of any specific person who may receive it. Please be aware, that past performance is not a reliable indicator of future performance and/or results. Past Performance or Forward-looking scenarios based upon the reasonable beliefs of the third-party provider are not a guarantee of future performance. Actual results may differ materially from those anticipated in forward-looking or past performance statements. IC Markets makes no representation or warranty and assumes no liability as to the accuracy or completeness of the information provided, nor any loss arising from any investment based on a recommendation, forecast or any information supplied by any third-party.

US30 Double topDouble top with multipal Divergence
Going for Short
Sell stop
47261.0
SL: 48101
TP: 46420
RRR 1:1

Us30-reversal pattern spotted
-will be scalping since there's no break and retest
-shorts will be my investment

US30 Ready for shorts?Momentum on US30 is finally slowing. Character of price action is indicating short term shorts for a continuation of longs. Price is very overextended currently. I would have preferred a few pips in longs to major key level before sells, but current price action is hinting at shorts, and you do not want to miss it if that is the case. Waiting for my entry criteria to enter sells. Best of luck. Manage Risk!

US30 Technical Breakdown – 11/04/2025📍 US30 Technical Breakdown – 11/04/2025
US30 faced heavy selling pressure after rejecting the 48,000 psychological resistance 🚫 The index has been in a steady decline since, currently sitting near 46,950, testing the mid-range structure support 👀
📊 Market Behavior:
🔹 Clean rejection from 48,000 → clear short-term shift in sentiment
🔹 Price trading below both EMAs → momentum favoring sellers
🔹 47,000 area acting as temporary support — watch for a bounce or breakdown
📌 Key Levels:
🔹 Resistance Zones:
47,400 → intraday EMA resistance
47,700 → lower high zone
48,000 → key breakout barrier
🔹 Support Zones:
46,900 → current structure support
46,520 → major demand area
46,000 → deeper correction level
🧠 Bias:
Short-term bearish ⚠️
➡️ Below 46,900 → sellers in control
⬆️ Break above 47,400 → potential reversal zone
us30Dow Jones on the 4H timeframe is moving in a downtrend in my view. Based on the data on the chart, it’s time for a correction. The price may rise to the highlighted area 1 hour timeframe before continuing the corrective targets shown on the chart, or it may complete the correction around the 50% Fibonacci retracement level. It’s unlikely to rise beyond that level."

London Manipulation, New York Expansion – US30 Outlook-Tokyo session built accumulation after liquidity sweep, setting a clean base.
-London delivered a perfect manipulation below Asian lows, leaving a fresh bullish FVG.
As long as price holds above 47,650–47,700,
-New York is likely to continue the expansion phase toward 48,050–48,100.
Below 47,600, a CHOCH may form before another push.
Smart Money narrative stays bullish — accumulation, manipulation, and now distribution.
#US30 #SmartMoneyConcepts #PriceAction #FVG #ICT #MarketStructure

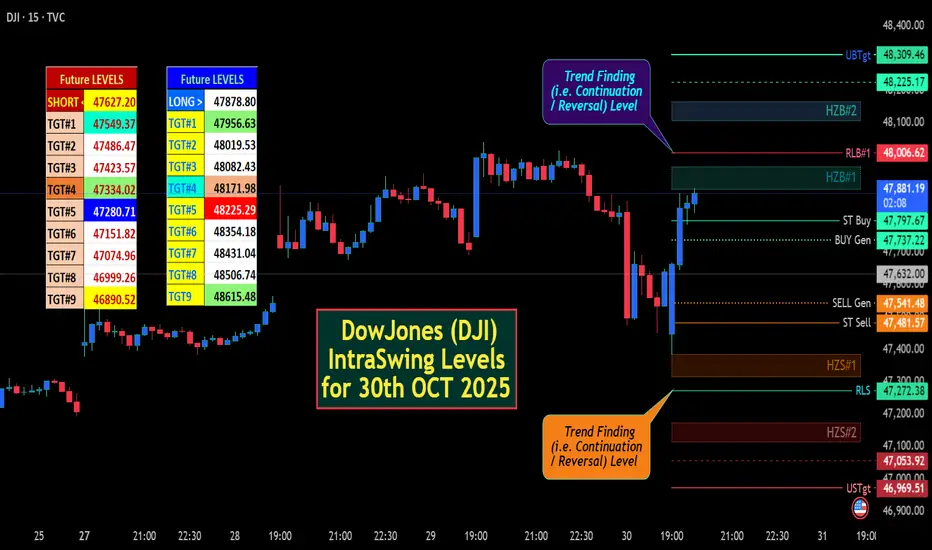
DowJones (DJI) IntraSwing Levels for 30th OCT 2025✍🏼️ "FUTUREY Levels" mentioned in BOX format.
🌡️Plot Levels Using 3 Min, 5 Min Time frame in your Chart for Better Analysis
L#1: If the candle crossed & stays above the “Buy Gen”, it is treated / considered as Bullish bias.
L#2: Possibility / Probability of REVERSAL near RLB#1 & UBTgt
L#3: If the candle stays above “Sell Gen” but below “Buy Gen”, it is treated / considered as Sidewise. Aggressive Traders can take Long position near “Sell Gen” either retesting or crossed from Below & vice-versa i.e. can take Short position near “Buy Gen” either retesting or crossed downward from Above.
L#4: If the candle crossed & stays below the “Sell Gen”, it is treated / considered a Bearish bias.
L#5: Possibility / Probability of REVERSAL near RLS#1 & USTgt
HZB (Buy side) & HZS (Sell side) => Hurdle Zone,
*** Specialty of “HZB#1, HZB#2 HZS#1 & HZS#2” is Sidewise (behaviour in Nature)
Rest Plotted and Mentioned on Chart
Color code Used:
Green =. Positive bias.
Red =. Negative bias.
RED in Between Green means Trend Finder / Momentum Change
/ CYCLE Change and Vice Versa.
Notice One thing: HOW LEVELS are Working.
Use any Momentum Indicator / Oscillator or as you "USED to" to Take entry.
⚠️ DISCLAIMER:
The information, views, and ideas shared here are purely for educational and informational purposes only. They are not intended as investment advice or a recommendation to buy, sell, or hold any financial instruments. I am not a SEBI-registered financial adviser.
Trading and investing in the stock market involves risk, and you should do your own research and analysis. You are solely responsible for any decisions made based on this research.
"As HARD EARNED MONEY IS YOUR's, So DECISION SHOULD HAVE TO BE YOUR's".
Do comment if Helpful .
In depth Analysis will be added later (If time Permits)
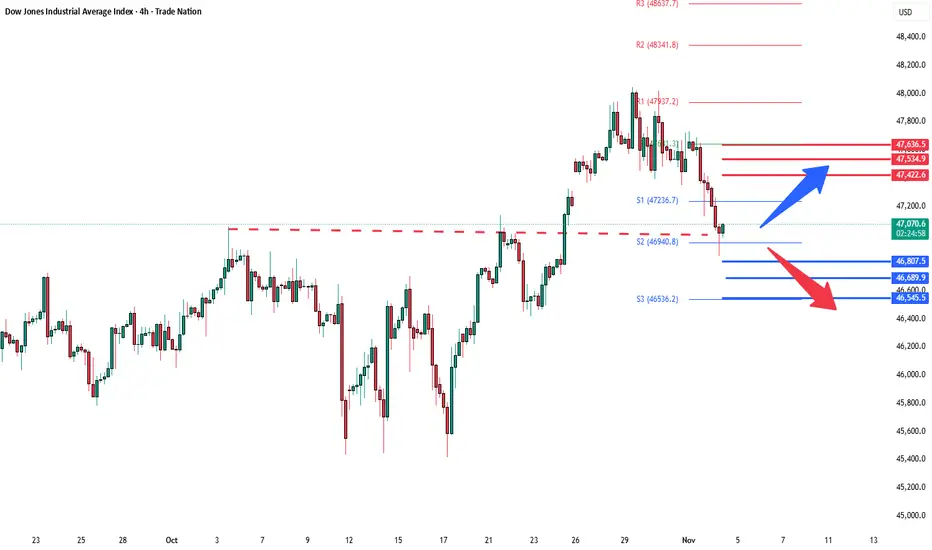
DowJones - Pullback or Reversal?Key Support and Resistance Levels
Resistance Level 1: 47433
Resistance Level 2: 47534
Resistance Level 3: 47636
Support Level 1: 46807
Support Level 2: 46690
Support Level 3: 46545
This communication is for informational purposes only and should not be viewed as any form of recommendation as to a particular course of action or as investment advice. It is not intended as an offer or solicitation for the purchase or sale of any financial instrument or as an official confirmation of any transaction. Opinions, estimates and assumptions expressed herein are made as of the date of this communication and are subject to change without notice. This communication has been prepared based upon information, including market prices, data and other information, believed to be reliable; however, Trade Nation does not warrant its completeness or accuracy. All market prices and market data contained in or attached to this communication are indicative and subject to change without notice.
DowJones at pivotal trading zoneKey Support and Resistance Levels
Resistance Level 1: 48085
Resistance Level 2: 48255
Resistance Level 3: 48500
Support Level 1: 47260
Support Level 2: 47040
Support Level 3: 46880
This communication is for informational purposes only and should not be viewed as any form of recommendation as to a particular course of action or as investment advice. It is not intended as an offer or solicitation for the purchase or sale of any financial instrument or as an official confirmation of any transaction. Opinions, estimates and assumptions expressed herein are made as of the date of this communication and are subject to change without notice. This communication has been prepared based upon information, including market prices, data and other information, believed to be reliable; however, Trade Nation does not warrant its completeness or accuracy. All market prices and market data contained in or attached to this communication are indicative and subject to change without notice.

US30 Trade Set Up Nov 4 2025Price pushed down hard during Asia and London and is making bearish structure so i will be looking for sells either after a sweep of BSL and tap into 4h FVG or if we invert this 15m FVG with a retest i will take sells down to SSL/London lows and lower 4h FVG

US30US30 is almost completing correction before further upside follows.
Disclosure: We are part of Trade Nation's Influencer program and receive a monthly fee for using their TradingView charts in our analysis.

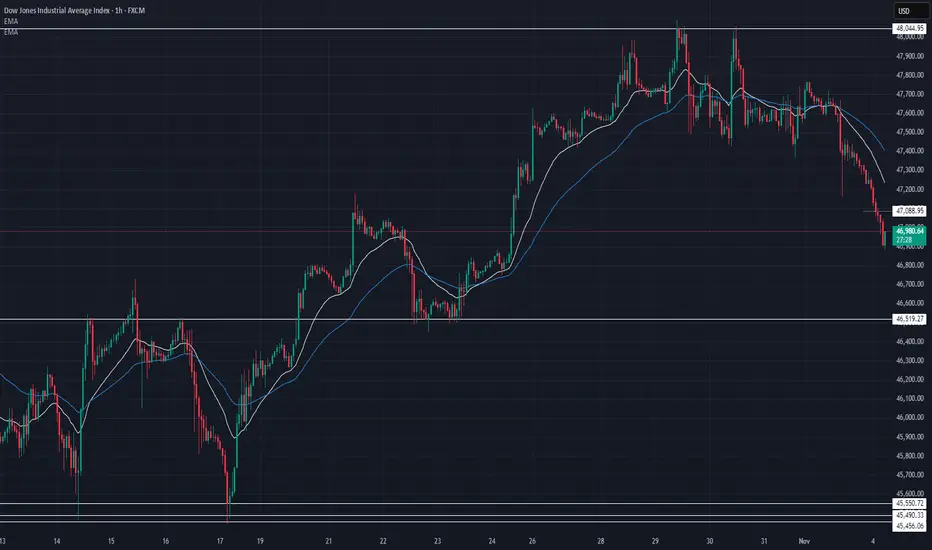
US30 Technical Breakdown – 11/05/2025📍 US30 Technical Breakdown – 11/05/2025
After a strong rally toward 48,000, US30 is showing signs of exhaustion 😴 Bears have stepped back in, pushing price below short-term EMAs as momentum fades. The index is now hovering near 47,130, caught between minor support and resistance zones ⚖️
📊 Market Behavior:
🔹 Clear rejection from 48,000 — same key psychological barrier from last week
🔹 Consecutive lower highs → early structure shift forming
🔹 Price struggling to stay above EMAs → sellers reclaim control short term
📌 Key Levels:
🔹 Resistance Zones:
47,250 → intraday EMA cap
47,400 → prior supply zone
47,800 → major resistance before 48,000
🔹 Support Zones:
47,000 → immediate support
46,520 → strong demand zone
46,000 → next downside magnet if breakdown continues
🧠 Bias:
Short-term bearish ⚠️
⬇️ Below 47,250 → watch for deeper pullback
⬆️ Above 47,400 → bulls could reattempt a move to 47,800


$DJIDJI is showing signs of weakness we may be entering a correction phase.
With the government searching for capital to “keep America great,” it’s coming at a big cost.
We could see a sell-off of weaker assets to clear the path for the next bullish wave in 2026. 📉➡️📈

US30: Bulls Are Winning! Long!
My dear friends,
Today we will analyse US30 together☺️
The recent price action suggests a shift in mid-term momentum. A break above the current local range around 47,172.59 will confirm the new direction upwards with the target being the next key level of 47,302.90 and a reconvened placement of a stop-loss beyond the range.
❤️Sending you lots of Love and Hugs❤️

US30 BULLHI
Simple market structure.
The chart speaks for itself
Quick resume, the market is currently goin through correction for bullish continuation.

possibility of uptrend It is expected that after some fluctuation, an upward trend will form and advance to the resistance range. As long as the price fluctuates above the support range, an upward trend is likely.

US30 Technical Breakdown – 10/30/2025
📍 US30 Technical Breakdown – 10/30/2025
US30 cooled off after a strong rally last week 🔥 Price printed a local high around 47,800, then started retracing as momentum slowed. The index is now testing the 47,500–47,400 support zone, sitting right around the EMAs — a crucial spot for bulls to defend 👀
📊 Market Behavior:
🔹 Higher highs and higher lows still intact (bullish structure)
🔹 EMAs starting to flatten → possible short-term pullback
🔹 Buyers defending 47.4K area so far
📌 Key Levels:
🔹 Resistance Zones:
47,790 → recent high / intraday resistance
48,000 → major breakout level
48,200 → continuation target
🔹 Support Zones:
47,400 → EMA & structure support
47,100 → previous breakout zone
46,520 → demand base
🧠 Bias:
Bullish overall ⚡
➡️ Above 47,800 → breakout continuation toward 48,200+
⬅️ Below 47,400 → short-term correction back toward 47,100

US30 H4 | Bearish ReversalDow Jones (US30) is reacting off the sell entry, which aligns with hte 161.8% Fibonacci extension and the 61.8% Fibonacci projection, and could drop from this level to the downside.
Sell entry is at 47,651.31, which lines up with the 161.8% Fibonacci extension and the 61.8% Fibonacci projection.
Stop loss is at 48,228.80, whic lines up with the 100% Fibonacci projection.
Take profit is at 46,892.33, which is an overlap support that lines u;p with hte 38.2% Fibonacci retracement.
Stratos Markets Limited (tradu.com ):
CFDs are complex instruments and come with a high risk of losing money rapidly due to leverage. 68% of retail investor accounts lose money when trading CFDs with this provider. You should consider whether you understand how CFDs work and whether you can afford to take the high risk of losing your money.
Stratos Europe Ltd (tradu.com ):
CFDs are complex instruments and come with a high risk of losing money rapidly due to leverage. 70% of retail investor accounts lose money when trading CFDs with this provider. You should consider whether you understand how CFDs work and whether you can afford to take the high risk of losing your money.

DOWJONES Strong Gains Continue on Solid Earnings and Trade HopesUS30 – MARKET OVERVIEW | Strong Bullish Momentum Continues 🇺🇸
The Dow Jones continues to extend its strong gains, adding more than +400 points since yesterday, supported by optimism surrounding tariff developments and solid corporate earnings.
The index maintains a bullish structure, and as long as it trades above 47,570, the trend is expected to continue toward 48,220.
A short-term retest toward 47,570 would be considered normal within the ongoing bullish momentum.
However, a confirmed 15-minute candle close below 47,370 would shift sentiment to bearish, targeting 47,090 as the next key support.
Key Technical Levels
Pivot Line: 47,570
Resistance: 48,210 · 48,550
Support: 47,090 · 46,900
Outlook:
US30 remains bullish while above 47,570, targeting 48,220 and possibly higher.
Only a 15-minute close below 47,370 would signal a short-term correction toward 47,090.

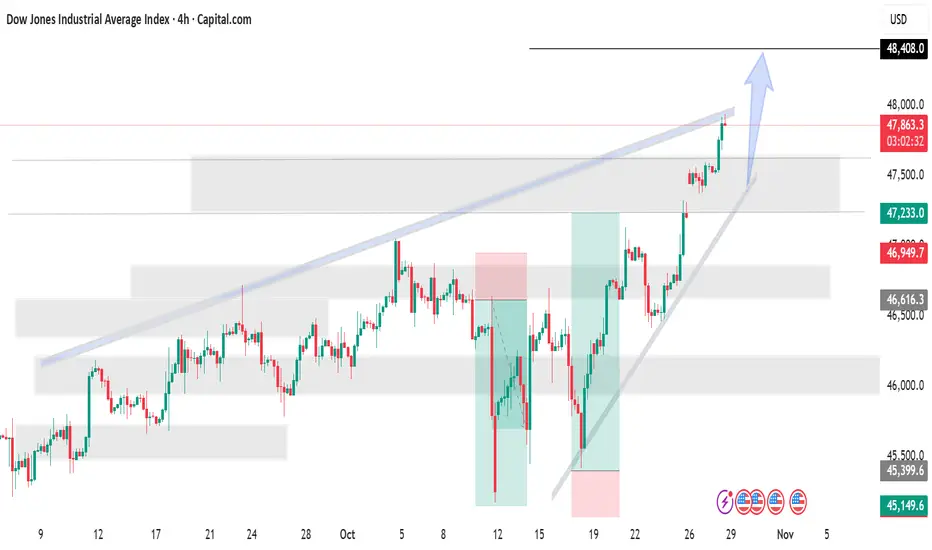
US30 ForecastThe Dow Jones Industrial Average Index is showing strong bullish momentum breaking above the ascending channel resistance. Price is holding above the 47,800 support zone and aiming toward the next key resistance near 48,400. The clear uptrend structure and breakout projection suggest further upside continuation, with buyers maintaining firm control.
"Thank you for your support! If you found this idea valuable or learned something new, please consider liking and leaving a comment. I’d really appreciate hearing your feedback and thoughts."