DowJones important support at 45190Key Support and Resistance Levels
Resistance Level 1: 45800
Resistance Level 2: 46000
Resistance Level 3: 46200
Support Level 1: 45190
Support Level 2: 44960
Support Level 3: 44720
This communication is for informational purposes only and should not be viewed as any form of recommendation as to a particular course of action or as investment advice. It is not intended as an offer or solicitation for the purchase or sale of any financial instrument or as an official confirmation of any transaction. Opinions, estimates and assumptions expressed herein are made as of the date of this communication and are subject to change without notice. This communication has been prepared based upon information, including market prices, data and other information, believed to be reliable; however, Trade Nation does not warrant its completeness or accuracy. All market prices and market data contained in or attached to this communication are indicative and subject to change without notice.
Trade ideas


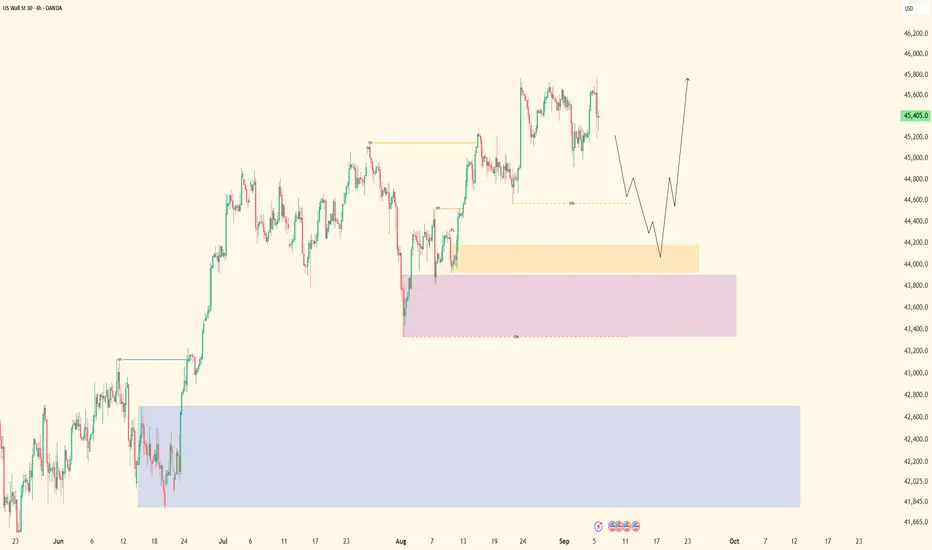
US30 Strategy: Sideways Range, Liquidity Run, and Entry Zones📊 Dow Jones (US30) Update 📊
The Dow Jones (US30) is currently bullish 🟢📈 and pushing higher on the 4H timeframe ⏰. We can see a value area forming 🏦, with price ranging sideways 🔄 and building liquidity above and below the range 💧.
My plan is to watch for a potential liquidity run above the range 🚀, followed by a deep pullback 🔽 that could present a high-probability entry opportunity 🎯.
⚠️ This outlook is for educational purposes only and not financial advice. 📚

US30 - Potential Outcome This WeekDear Friends in Trading,
“I share only my perspective. In this industry, learning never ends, but progress comes when we learn from mistakes without repeating them.” - ANROC
1) BULL trend prevails.
2) Again, price is running towards the same supply liquidity area pre-CPI release.
3) Can it push though this time, supported by alternative fundamental factors?
4) Or will price sweep and fall to respect the supply level yet again?
Keynote:
All levels indicated are liquidity levels.
I sincerely hope my point of view offers a valued insight.
Thank you for taking the time study my analysis.

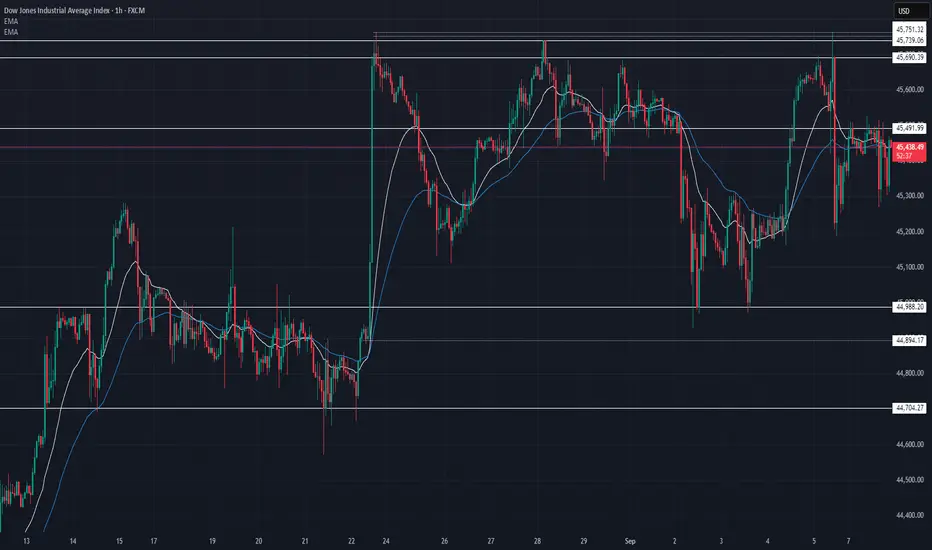
US30 Technical Breakdown – 09/08/2025📍 US30 Technical Breakdown – 09/08/2025
US30 continues to range tightly after failing to sustain the breakout above 45,750 resistance. Price is now chopping around 45,450, stuck between 45,490 resistance and 45,300–45,200 support.
The EMAs are flat and overlapping → confirming lack of trend direction. This is a compression zone before the next big move.
📊 Current Market Behavior:
🔄 Sideways chop between 45,200–45,700
📉 Multiple rejections at 45,750
🧱 Strong support holding around 45,200–45,300
⚠️ Volatility squeeze → expansion incoming
📌 Key Levels:
🔹 Resistance Zones:
45,490 → Intraday lid
45,690 → Minor supply
45,739–45,751 → Major rejection zone
🔹 Support Zones:
45,300–45,200 → Current demand pocket
44,988 → Mid-range floor
44,704 → Deeper support
🧠 Bias:
🔄 Neutral → Waiting for breakout
Above 45,750 = bullish continuation
Below 45,200 = bearish momentum shift

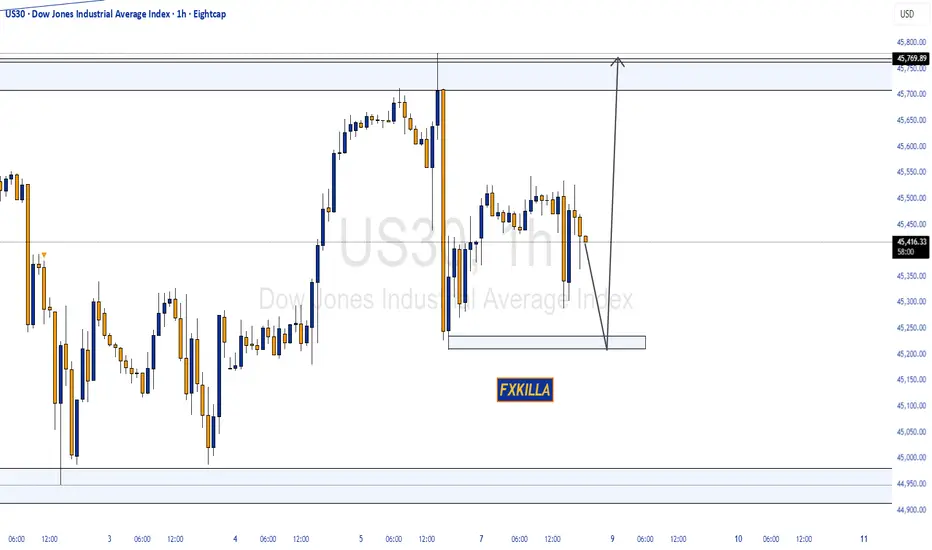
DOW JONES HIGH PROBABILITY SETUP SOON!!!🚨 US30 HIGH PROBABILITY SELL/BUY SETUP 🚨
* Here We Can See Clearly The Next Potential Moves For US30 Coming Hours/Days.
* Keep Your Eyes Close On Your Trading Positions.
* Happy PIP Hunting Traders.
FXKILLA.
Us30 Trade Set Up Sep 8 2025FX:US30
www.tradingview.com
Price is currently at a 1h FVG and in between BSL/SSL so i want to see either liquidity level swept followed by a 1m/2m IFVG or RB formed and tested to continue higher.
I am overall bullish due to price making HH/HL but it is monday which usually has low volume so not expecting huge moves today

Dow Jones Outlook: Bullish Above 45,465, Bears Eye 45,285US30 – Overview
The Dow Jones recorded a new ATH on Friday and has since retested and stabilized above 45,465.
Technical Outlook:
📈 As long as price holds above 45,465 (pivot), bullish momentum is expected to continue toward 45,680 → 45,860.
📉 A confirmed stabilization below 45,410 would shift momentum bearish, targeting 45,285 → 45,110.
Key Levels:
Pivot: 45,465
Resistance: 45,680 – 45,860
Support: 45,285 – 45,110


US30 ShortElite Analysis
All confirmations have been confirmed
It's time for patience, let price come to you.
5m TOB confirmed, this is where we will execute from.
Targeting lower liquidity pools
Main target weekly structured liquidity
Note:
(Extra: Equilibrium at 1h FVG confirmed)

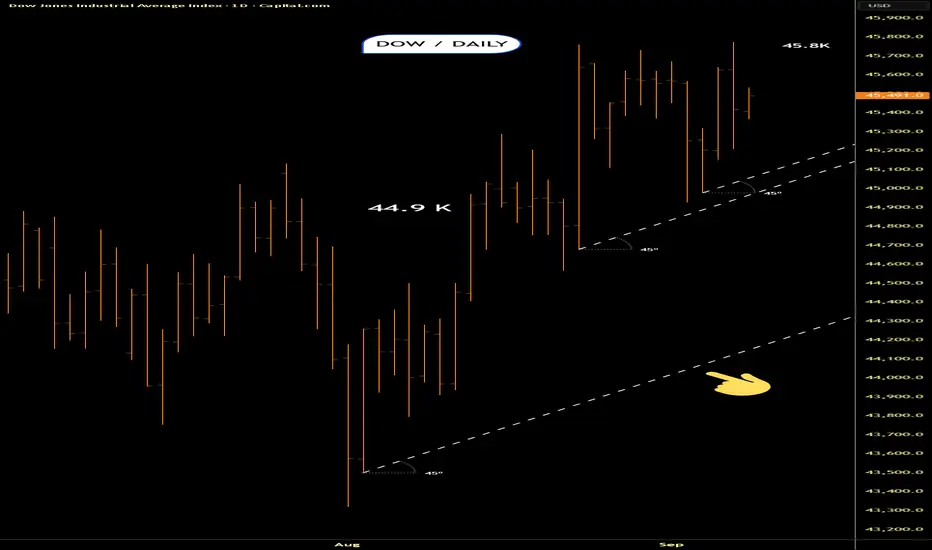
Dow.. Get in closerThere is a tinge of bearish/Downtrend line.Maybe that gets taken out and it carries on upwards.lets see what happens
Dow into the openThere is a fair bit of deviation from the bullish support line/marked.Also some deviation from those internal trendlines
US30 | BearishUS30 has hit all time high and and formed divergence on RSI after testing its resistance for third time.It has now printed LL and LH which indicates that it is going into bearish trend.

ICT CONCEPTS BLENDED W/SUPPORT AND RESISTANCE_SELLOn the weekly and Daily timeframes the next market move is not clear, following the trend we're bullish, but there is also a higher timeframe resistance has been met creating a higher high around the 45,774.20 level, and a move to the sell side is very possible, along with recent news events.

uptrend As long as the index fluctuates above the support range and the support trend line, the continuation of the upward trend to the specified targets is likely. If the support range is broken, the continuation of the corrective and downward trend is possible.

US30 H6 | Market OutlookPotential for a bearish pullback on the US30 H6 which could lead to a price movement towards the support level at 44.500. SELL levels from 45.520

US30: Long Signal with Entry/SL/TP
US30
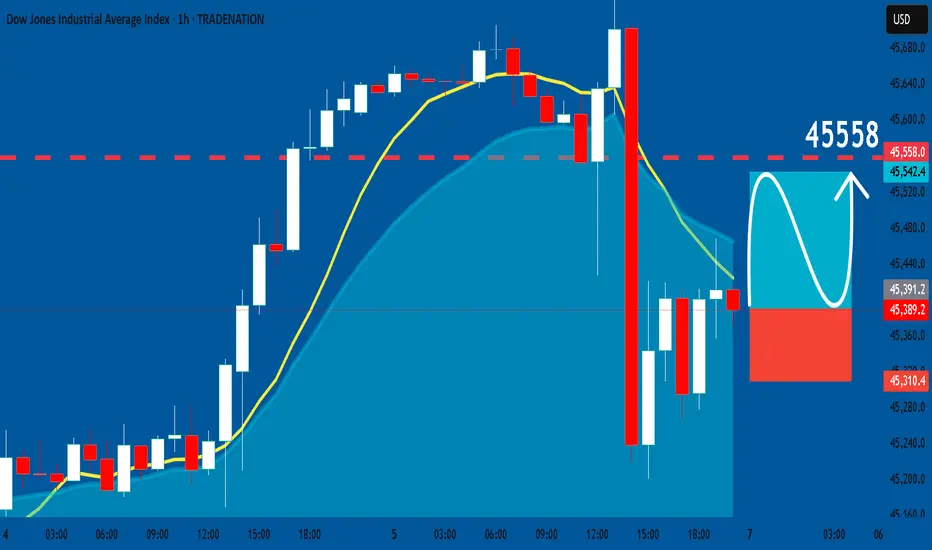
- Classic bullish setup
- Our team expects bullish continuation
SUGGESTED TRADE:
Swing Trade
Long US30
Entry Point - 45389
Stop Loss - 45310
Take Profit - 45558
Our Risk - 1%
Start protection of your profits from lower levels
Disclosure: I am part of Trade Nation's Influencer program and receive a monthly fee for using their TradingView charts in my analysis.
❤️ Please, support our work with like & comment! ❤️
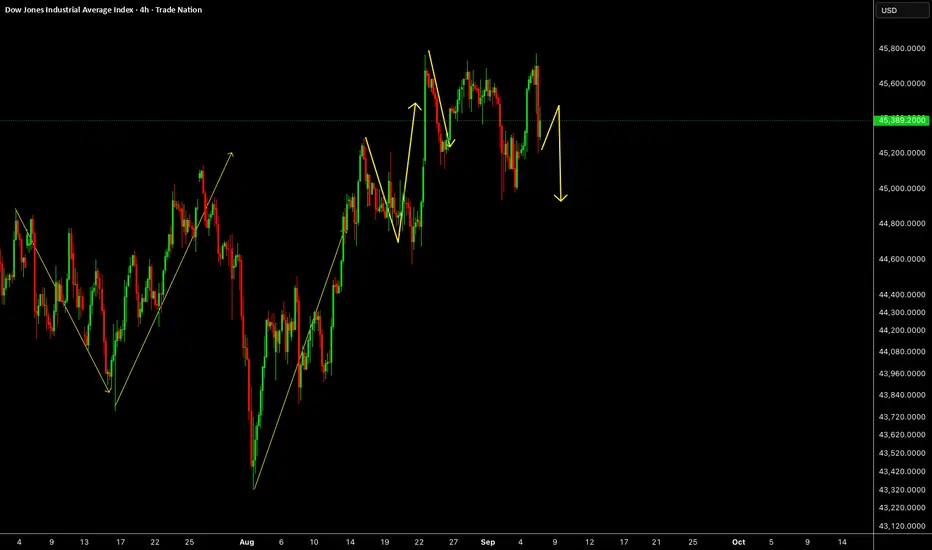
US30US30 has some more downside to complete this bigger correction before any upside.
Disclosure: We are part of Trade Nation's Influencer program and receive a monthly fee for using their TradingView charts in our analysis.

SMB - WEEK 2SUNDAY MARKET BREAKDOWN - WEEK 2 of September 2025
Hope you learn one or two. Do like, comment & follow for more content.

Possible buy opportunity on US30- after confirmation!Hello Traders,
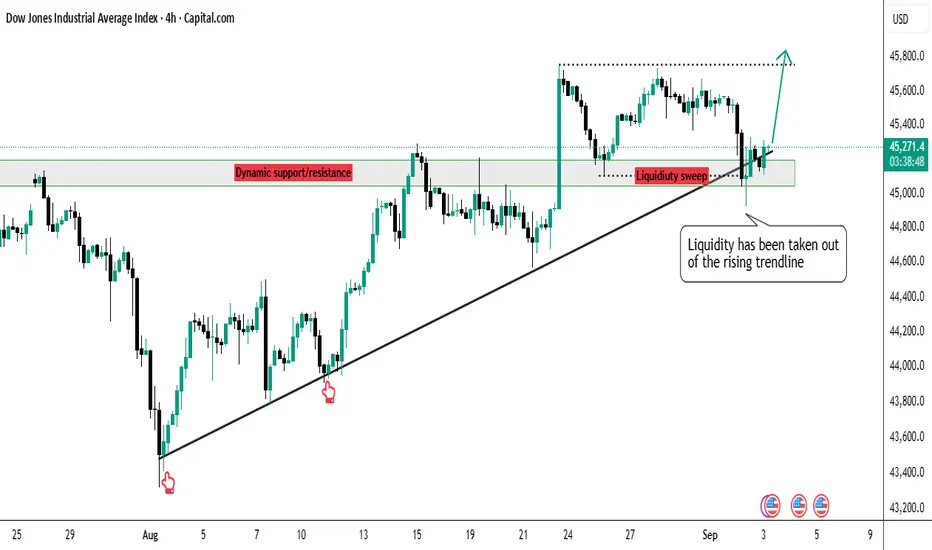
I’m currently watching US30 for a potential long setup.
Price has tapped into a key dynamic level that has previously acted as both support and resistance. This zone also aligns with a rising trendline, where we just saw liquidity taken out below it, followed by multiple candle rejections.
This confluence makes me believe buyers could step in here. My confirmation trigger will be a close above 45,314, if that happens, I’ll be looking to enter long.
🎯 Target: 45,811.83 (previous high)
🛡️ Stop: 45,067
⚖️ Risk-to-Reward: 1:2
I see good potential for upside from this level.
👉 What are your thoughts on this setup? Drop your insights in the comments and if you find this analysis valuable, a like would be greatly appreciated!
US30| Pullback Continuation SetupPair/Instrument: US30 (Dow Jones)
Bias: Bullish overall
HTF (4H+):
• Price is in a strong uptrend.
• Breaking major highs with strong volume confirming momentum.
• Candles printing with conviction — clear bullish control.
MTF (30M/1H):
• Waiting for sell-side liquidity sweep to trigger and respect internal framework OBs.
• Once mitigation occurs, the pullback will be primed for continuation.
LTF (5M/15M):
• Monitor for clean CHoCH + OB entry confirmations aligned with higher-timeframe bias.
• Entries anticipate continuation leg without chasing.
Targets:
• TP1: ~5.5 points / units from entry (quick partial target based on immediate LTF highs).
• TP2: ~30.5 points / units from entry (extended target based on HTF liquidity and swing).
Mindset Note:
• Wait for structured pullback and mitigation. Patience > impulse.
• Let the market sweep liquidity and set up your OBs before committing — the high-probability continuation will follow naturally.