433% after breakout trendlineAs you can see from the chart, a price is approaching the blue trendline, and if it breaks, it could reach 433%.
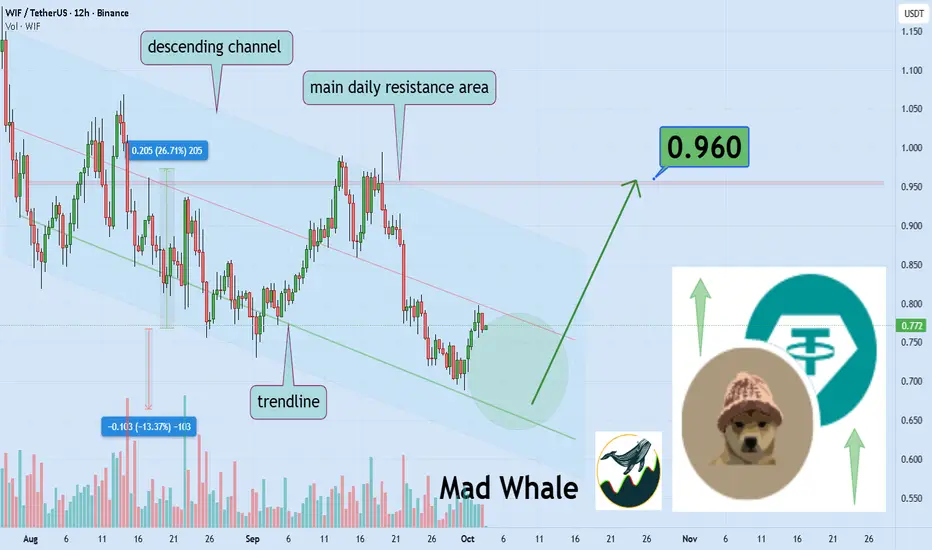
Dogwifhat Approaches Resistance: 26% Upside Possible to $0.96Hello✌️
Let’s analyze Dogwifhat’s price action both technically and fundamentally 📈.
🔍Fundamental analysis:
Whales loaded up on WIF near $0.83, but retail is still quiet.
📊Technical analysis:
BINANCE:WIFUSDT is trading within a descending channel, hovering near key daily trendlines. A
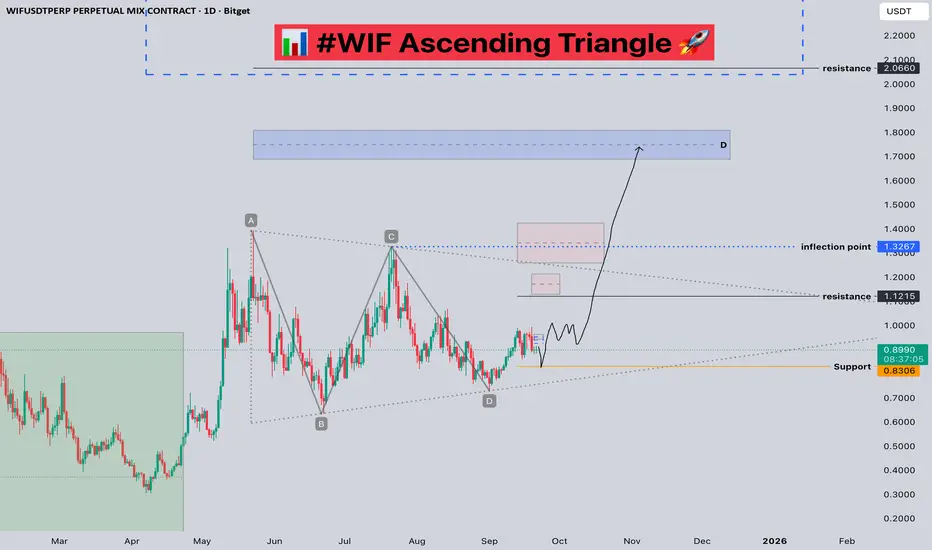
#WIF Ascending Triangle 📊 #WIF Ascending Triangle 🚀
🧠From a structural perspective, the daily correction has completed. A good rebound has already occurred, and the market is currently consolidating sideways. If it can break out of this consolidation range, we could potentially see the start of a second surge.
➡️From a c
WIF Market Update📊 SEED_WANDERIN_JIMZIP900:WIF Market Update
SEED_WANDERIN_JIMZIP900:WIF is now testing an important resistance zone 🔴
👉 There’s a chance of rejection here, but if it breaks out, that’s a strong signal for a bullish trend ✅
⚡ Watch closely — confirmation will show the next move.

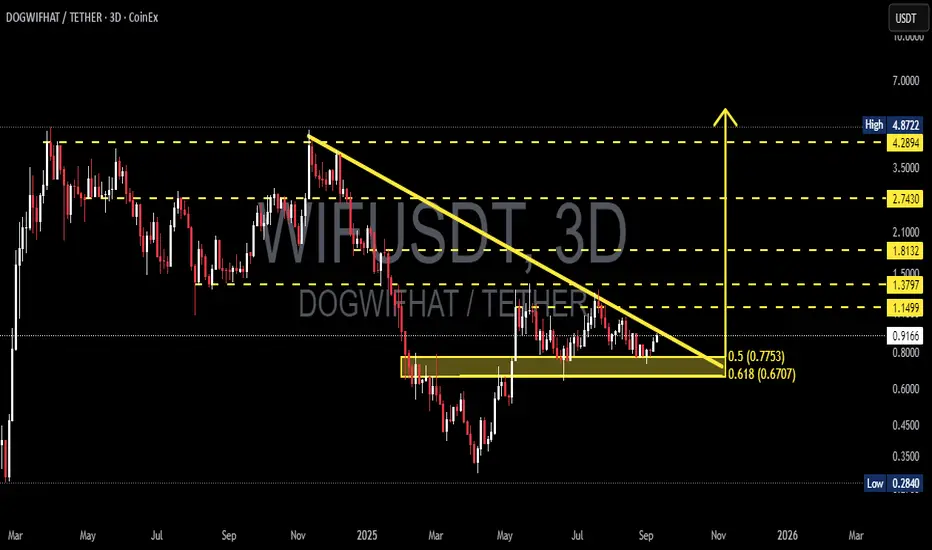
WIF/USDT — The Apex Point: Awaiting a Major Breakout or Breakdow🔎 Overview
The DOGWIFHAT/USDT pair is currently consolidating at a critical junction on the 3-day timeframe (3D). The chart reveals a classic Descending Triangle — a technical pattern formed by consistent lower highs (selling pressure) converging with a strong horizontal support zone.
The essence
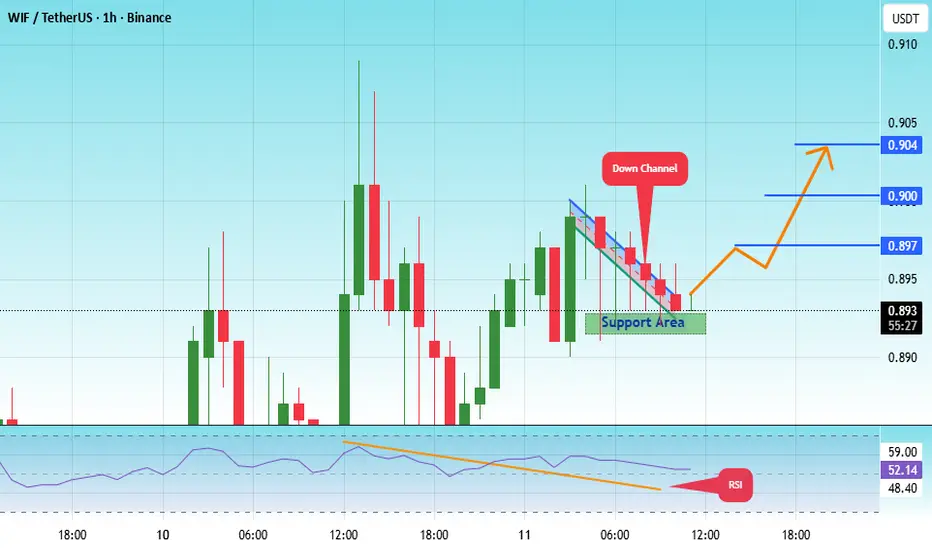
#WIF/USDT Forming Descending Channel#WIF
The price is moving within a descending channel on the 1-hour frame, adhering well to it, and is heading for a strong breakout and retest.
We have a bearish trend on the RSI indicator that is about to be broken and retested, which supports the upward breakout.
There is a major support area i
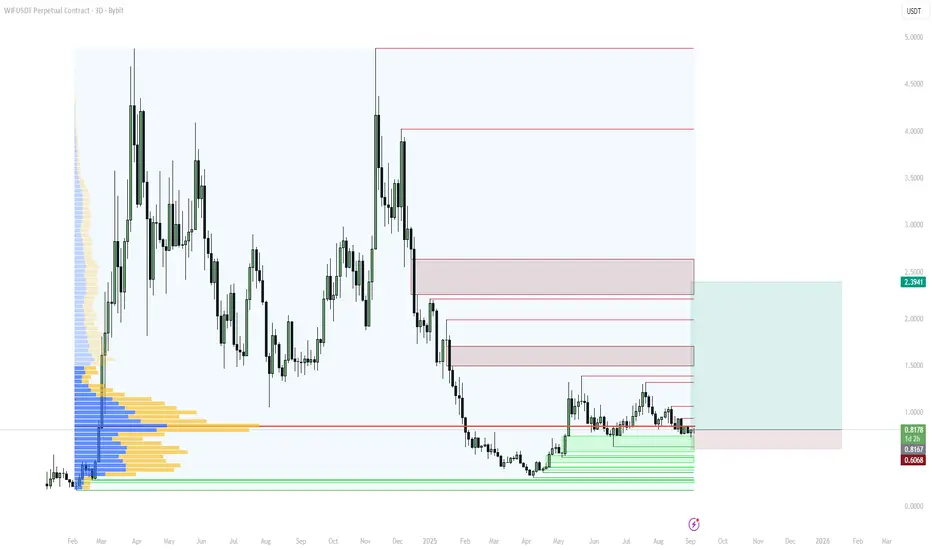
Long from accumulation range: targets 1.50 → 2.35 (Weekly FVG)Price is sitting at the upper edge of the 0.78–0.83 accumulation. Above, unfilled FVG clusters on D1/W1 act as magnets; the first target is 1.50, then 2.00–2.35 (Weekly FVG). VPVR shows the main volume base at 0.70–0.83.
Idea
Counter-trend long from range support with base R/R ≈ 3.7. Expectation: l
WIF/USDT Technical UpdateBINANCE:WIFUSDT has successfully broken out of the falling wedge 📉➡️📈 and has already completed a clean retest of the breakout zone ✅.
Currently price action is forming a potential ABC corrective wave structure (Elliott Wave count), with:
🅰️ Wave (A) aiming toward the 0.84–0.85 resistance zone

WIF/USDT (perpetual swap contract on OKX).1. Context
Pair: WIF/USDT (perpetual swap contract on OKX).
Timeframe: 30-minute chart.
Current price: around 0.8138 USDT.
Indicators: two moving averages are visible:
Orange line = shorter-period MA (likely 50 EMA).
Blue line = longer-period MA (likely 200 EMA).
2. Trade Setup
This chart shows a lo

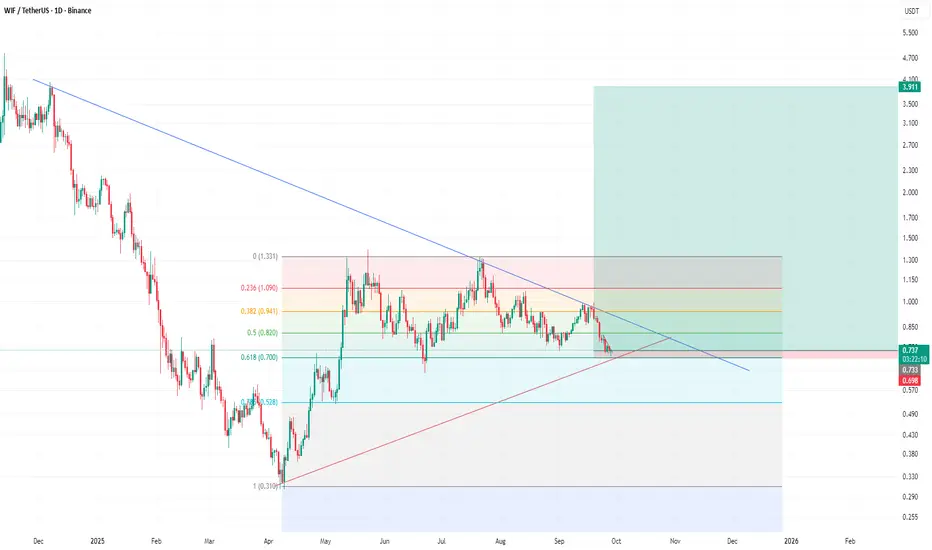
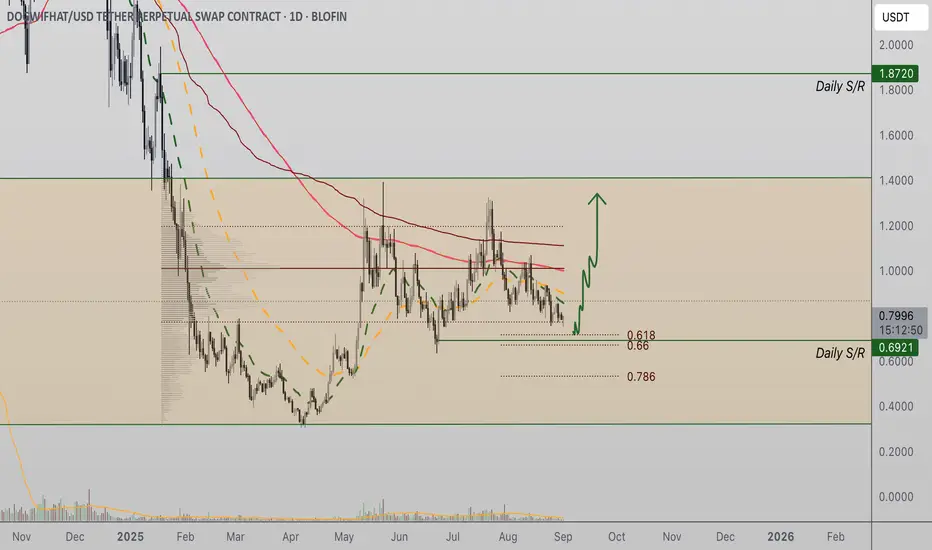
WIF Holds Fibonacci Support as Range ConsolidatesWIF Coin is respecting the 0.618 Fibonacci retracement, which aligns with daily support and the value area low of its current range. Price action remains rotational, but a move toward range resistance is developing.
WIF Coin continues to trade within a longer-term defined range, where both support
See all ideas
Summarizing what the indicators are suggesting.
Oscillators
Neutral
SellBuy
Strong sellStrong buy
Strong sellSellNeutralBuyStrong buy
Oscillators
Neutral
SellBuy
Strong sellStrong buy
Strong sellSellNeutralBuyStrong buy
Summary
Neutral
SellBuy
Strong sellStrong buy
Strong sellSellNeutralBuyStrong buy
Summary
Neutral
SellBuy
Strong sellStrong buy
Strong sellSellNeutralBuyStrong buy
Summary
Neutral
SellBuy
Strong sellStrong buy
Strong sellSellNeutralBuyStrong buy
Moving Averages
Neutral
SellBuy
Strong sellStrong buy
Strong sellSellNeutralBuyStrong buy
Moving Averages
Neutral
SellBuy
Strong sellStrong buy
Strong sellSellNeutralBuyStrong buy
Displays a symbol's price movements over previous years to identify recurring trends.