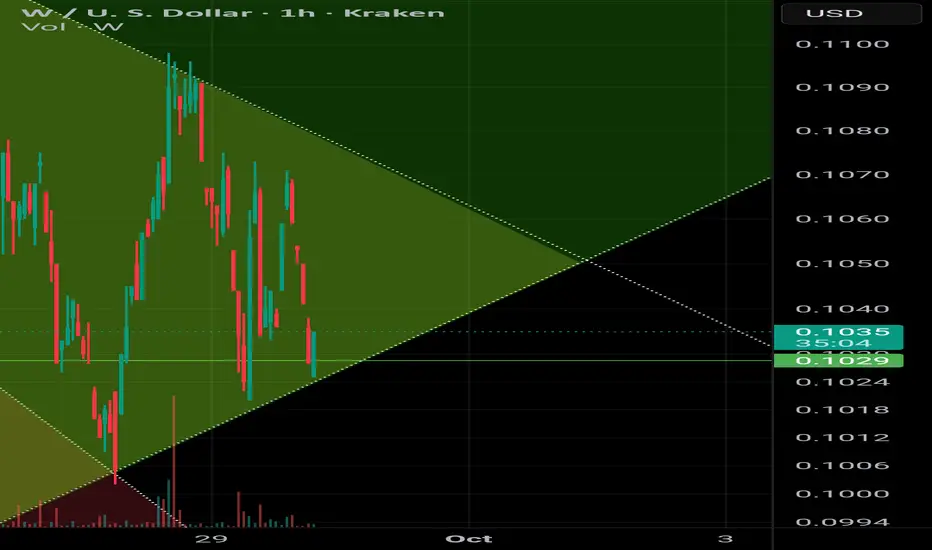
Testing new Strategy1. Broke above descending pennant and confirmed support.
2. Created a symmetrical triangle. Entering on support.
3. Predict that price will break above the symmetrical triangle- and use parallel channel as next resistance.
Theory: Price action goes from bearish, to neutral to bullish.
If price ends up doing this and breaks above parallel channel, even better!
Otherwise stop loss below symmetrical triangle.
WJITOSOL_4M8MH8.USD trade ideas
W / USDT Main trend. 23 03 2025Logarithm. Time frame 3 days. Descending channel, price in local clamping in consolidation at dynamic support of the internal channel. From listing -94% at the moment.
Local percentages, medium-term and long-term to key zones of chart logic and liquidity, are shown on the chart as a guide for building your tactics and risk control.
🔴 There is potential for a decline to external support of a large descending channel (optional). I showed this option for building tactics and money management. Such assets in terms of liquidity, as a rule, decrease by 96-98%
🟢 If, from this price clamp, the price goes up , then the first resistance is the dynamic resistance of the internal channel (from which there may be a local reversal). Then the external (similarly). If the trend breaks and exits the descending channel, then strong resistance is the previous consolidation of 0.24-0.36
Locally, this clamping zone looks like this.

WUSD will rise, so simpleTwo oscillation intervals, low near the lower boundary support position of the downtrend channel, followed by an uptrend
