WLD: potential breakout ahead? key levels to watch for todayWLD. Still watching this thing drip and wondering if the next move is finally up? AI coins are back on the radar after fresh headlines about new partnerships in the sector, while, according to the market, WLD is facing another wave of attention around supply and regulation. Volatility is waking up a
Related pairs

Worldcoin —The downtrend endsSince March 2024 here we have a downtrend. If the downtrend ends, we get a new market cycle. It can be either sideways or bullish. For a sideways period to start, there must be some sort of change first. This is to say that a bullish move comes next regardless of how you slice it.
Worldcoin (WLDUSD

#WLD/USDT Pump Anticipated#WLD
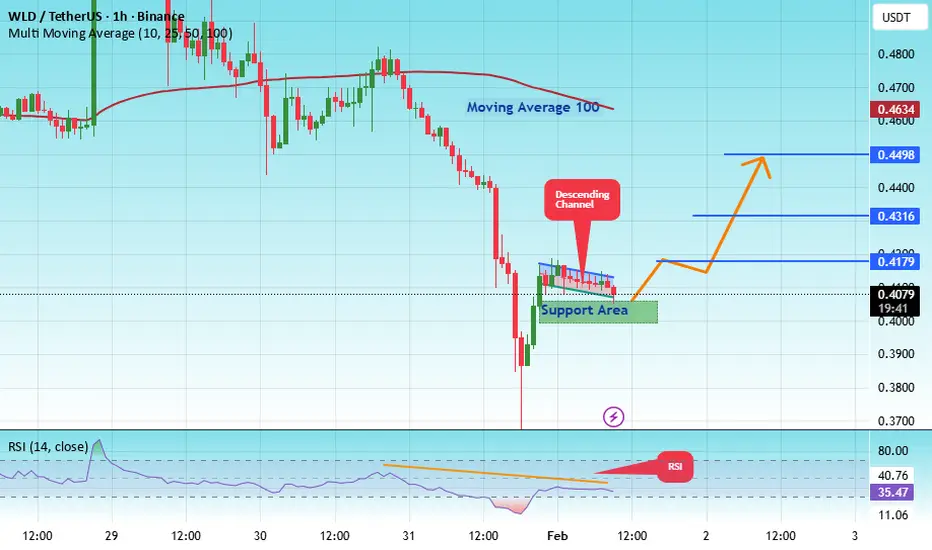
The price is moving within a descending channel on the hourly timeframe. It has reached the lower boundary and is heading towards a breakout, with a retest of the upper boundary expected.
The Relative Strength Index (RSI) is showing a downward trend, approaching the lower boundary, and an upw

WLDUSDT.P:short setup from daily support at 0.3640SETUP SUMMARY
Regarding BINANCE:WLDUSDT.P : after a strong drop, the asset has been consolidating for 5 days. Typically, if an asset comes from above and enters consolidation, it will continue in the same direction — downwards.
This move is reinforced by the fact that BINANCE:BTCUSDT.P is dro

WLDUSDT Downtrend Channel in ControlWLD remains firmly contained within a descending channel, confirming sustained bearish market structure on the higher timeframe.
Price recently reacted from the upper boundary where we have external resistance level, followed by strong rejection, keeping the lower highs–lower lows sequence intact.

#WLD/USDT LONG SET UP ALERT ?#WLD
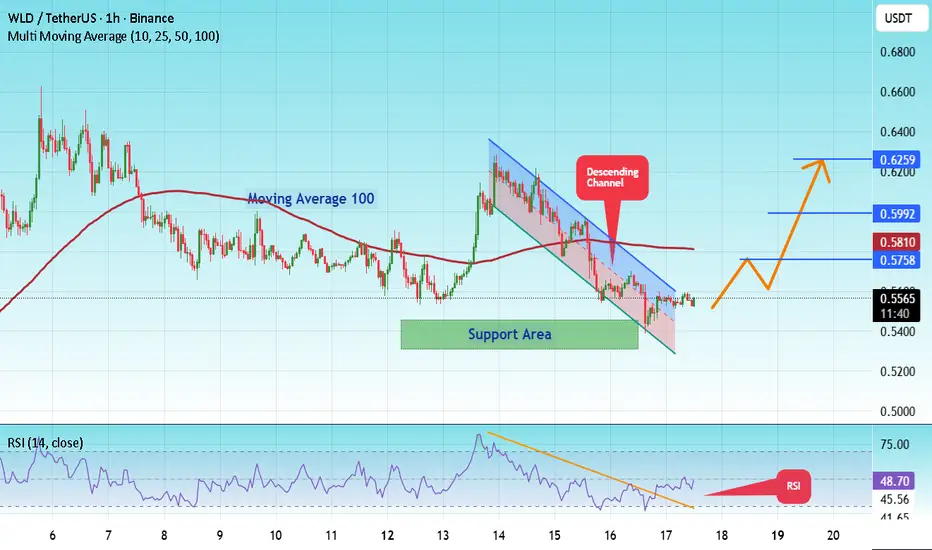
The price is moving within a descending channel on the hourly timeframe. It has reached the lower boundary and is heading towards a breakout, with a retest of the upper boundary expected.
The Relative Strength Index (RSI) is showing a downward trend, approaching the lower boundary, and an upw
WLD TECHNICALS LOOKING BULLISH🔥 Fortune AI Radar — EURONEXT:WLD
Fresh activity detected on EURONEXT:WLD today.
Data suggests increasing market interest & buyers stepping in.
Technicals currently lean bullish, with momentum trending upward.
Whales showing hints of accumulation and hype rising among trader

Buyers like the price Hi everyone,
Buyers are beginning to show interest at these levels. After the significant drop earlier, we are now seeing buying activity emerge as participants attempt to push prices higher.
It will be interesting to observe how much momentum follows and how far the market carries this move throu

$WLDUSDT QUICK ANALYSIS (1H)BINANCE:WLDUSDT Analysis for Futures traders The Price of BINANCE:WLDUSDT is in a clear bearish market structure, printing consecutive lower highs and lower lows. A high-probability short opportunity is forming as price will retrace into validated supply zone after a clean Break of Structure (BO

#WLD/USDT LONG SET UP ALERT#WLD
The price is moving within a descending channel on the hourly timeframe. It has reached the upper boundary and is heading towards breaking it. A retest of this boundary is expected.
The Relative Strength Index (RSI) is showing an upward trend, as it has approached the upper boundary. A bearis
See all ideas
Summarizing what the indicators are suggesting.
Oscillators
Neutral
SellBuy
Strong sellStrong buy
Strong sellSellNeutralBuyStrong buy
Oscillators
Neutral
SellBuy
Strong sellStrong buy
Strong sellSellNeutralBuyStrong buy
Summary
Neutral
SellBuy
Strong sellStrong buy
Strong sellSellNeutralBuyStrong buy
Summary
Neutral
SellBuy
Strong sellStrong buy
Strong sellSellNeutralBuyStrong buy
Summary
Neutral
SellBuy
Strong sellStrong buy
Strong sellSellNeutralBuyStrong buy
Moving Averages
Neutral
SellBuy
Strong sellStrong buy
Strong sellSellNeutralBuyStrong buy
Moving Averages
Neutral
SellBuy
Strong sellStrong buy
Strong sellSellNeutralBuyStrong buy
Displays a symbol's price movements over previous years to identify recurring trends.
Frequently Asked Questions
The current price of WLD / TetherUS (WLD) is 0.4026 USDT — it has fallen −0.94% in the past 24 hours. Try placing this info into the context by checking out what coins are also gaining and losing at the moment and seeing WLD price chart.
WLD / TetherUS price has risen by 2.96% over the last week, its month performance shows a −27.81% decrease, and as for the last year, WLD / TetherUS has decreased by −67.35%. See more dynamics on WLD price chart.
Keep track of coins' changes with our Crypto Coins Heatmap.
Keep track of coins' changes with our Crypto Coins Heatmap.
WLD / TetherUS (WLD) reached its highest price on Mar 10, 2024 — it amounted to 11.9720 USDT. Find more insights on the WLD price chart.
See the list of crypto gainers and choose what best fits your strategy.
See the list of crypto gainers and choose what best fits your strategy.
WLD / TetherUS (WLD) reached the lowest price of 0.1500 USDT on Jul 24, 2023. View more WLD / TetherUS dynamics on the price chart.
See the list of crypto losers to find unexpected opportunities.
See the list of crypto losers to find unexpected opportunities.
The safest choice when buying WLD is to go to a well-known crypto exchange. Some of the popular names are Binance, Coinbase, Kraken. But you'll have to find a reliable broker and create an account first. You can trade WLD right from TradingView charts — just choose a broker and connect to your account.
Crypto markets are famous for their volatility, so one should study all the available stats before adding crypto assets to their portfolio. Very often it's technical analysis that comes in handy. We prepared technical ratings for WLD / TetherUS (WLD): today its technical analysis shows the sell signal, and according to the 1 week rating WLD shows the sell signal. And you'd better dig deeper and study 1 month rating too — it's sell. Find inspiration in WLD / TetherUS trading ideas and keep track of what's moving crypto markets with our crypto news feed.
WLD / TetherUS (WLD) is just as reliable as any other crypto asset — this corner of the world market is highly volatile. Today, for instance, WLD / TetherUS is estimated as 3.96% volatile. The only thing it means is that you must prepare and examine all available information before making a decision. And if you're not sure about WLD / TetherUS, you can find more inspiration in our curated watchlists.
You can discuss WLD / TetherUS (WLD) with other users in our public chats, Minds or in the comments to Ideas.