TLDR: SELL Gold, BUY OilGold/oil ratio seems to be evolving in a band. We've had RSI divergences every time we touched the band predicting trend reversal. RSI Divergence playing out right now as we touch the seemingly relevant support.
- FX_IDC:USDWTI / FRED:WM2NS is at an all time low support level (1998, 2016, 2020)
- TVC:GOLD / FRED:WM2NS at an all time High (1983, oct 2011)
Gold/Oil ratio looks like a Big BUY to me. Enjoy \o/.
Trade ideas

Hellena | Oil (4H): SHORT to support area of 56-57.Colleagues, price is actively moving in a downward direction and I believe the move is not yet complete.
Earlier I saw this move as a big correction, but now the structure is more of an impulsive one. This means that the price is moving in the wave “3” of the higher order (Red), which should be completed soon.
For this to happen, the price needs to complete the correction in the wave “4” of medium order and then update the low, reaching the support area of 56-57.
The extension of wave “3” is possible - then the price will reach the target without correction.
Fundamental context
Global oil inventories are forecast to rise through 2025, putting downward pressure on prices despite efforts by some producers to restrain output.
OPEC+ has been increasing production again, which adds to the supply burden.
Meanwhile, demand forecasts have been trimmed amid softer economic growth indicators in key consuming regions.
Major banks have lowered long-term price expectations for crude — the balance is tilting toward a more bearish outlook.
Manage your capital correctly and competently! Only enter trades based on reliable patterns!

USOIL formed descending flag pattern short ? Act accordinglyUSOil has formed descending flag pattern and price may go down to say around 56 incase of breakdown of support.
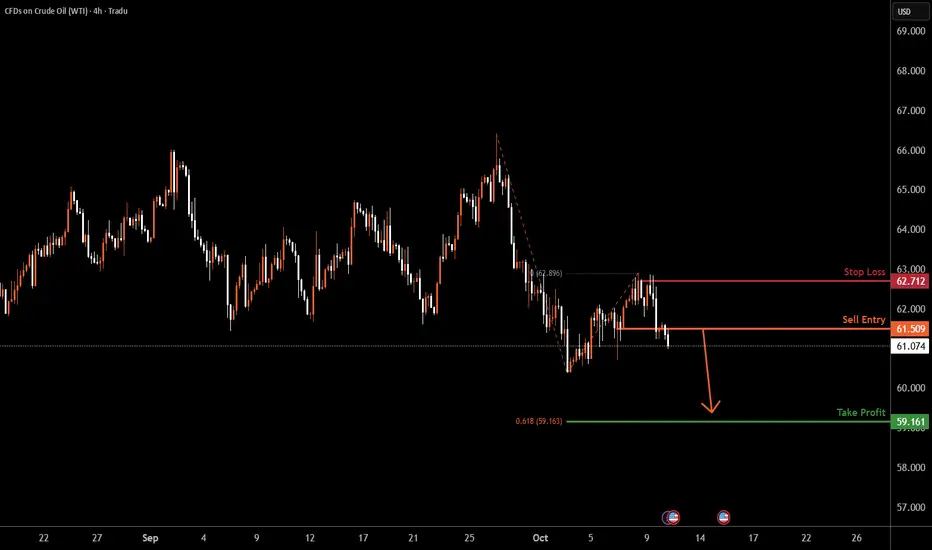
USOIL H4 | Bearish Drop OffUSOIL is reacting off the sell entry, which is a pullback resistance and could drop from this level to the downside.
Sell entry is at 61.50, which is a pullback resistance.
Stop loss is at 62.71, which is a pullback resistance.
Take profit is at 59.16, which lines up with the 161.8% Fibonacci extension.
High Risk Investment Warning
Trading Forex/CFDs on margin carries a high level of risk and may not be suitable for all investors. Leverage can work against you.
Stratos Markets Limited (tradu.com ):
CFDs are complex instruments and come with a high risk of losing money rapidly due to leverage. 65% of retail investor accounts lose money when trading CFDs with this provider. You should consider whether you understand how CFDs work and whether you can afford to take the high risk of losing your money.
Stratos Europe Ltd (tradu.com ):
CFDs are complex instruments and come with a high risk of losing money rapidly due to leverage. 66% of retail investor accounts lose money when trading CFDs with this provider. You should consider whether you understand how CFDs work and whether you can afford to take the high risk of losing your money.
Stratos Global LLC (tradu.com ):
Losses can exceed deposits.
Please be advised that the information presented on TradingView is provided to Tradu (‘Company’, ‘we’) by a third-party provider (‘TFA Global Pte Ltd’). Please be reminded that you are solely responsible for the trading decisions on your account. There is a very high degree of risk involved in trading. Any information and/or content is intended entirely for research, educational and informational purposes only and does not constitute investment or consultation advice or investment strategy. The information is not tailored to the investment needs of any specific person and therefore does not involve a consideration of any of the investment objectives, financial situation or needs of any viewer that may receive it. Kindly also note that past performance is not a reliable indicator of future results. Actual results may differ materially from those anticipated in forward-looking or past performance statements. We assume no liability as to the accuracy or completeness of any of the information and/or content provided herein and the Company cannot be held responsible for any omission, mistake nor for any loss or damage including without limitation to any loss of profit which may arise from reliance on any information supplied by TFA Global Pte Ltd.
The speaker(s) is neither an employee, agent nor representative of Tradu and is therefore acting independently. The opinions given are their own, constitute general market commentary, and do not constitute the opinion or advice of Tradu or any form of personal or investment advice. Tradu neither endorses nor guarantees offerings of third-party speakers, nor is Tradu responsible for the content, veracity or opinions of third-party speakers, presenters or participants.
Heading into 50% Fibonacci resistance?WTI Oil (XTI/USD) is rising towards the pivot which is a pullback resistance that aligns with the 50% Fibonacci retracement and could reverse to the 1st support.
Pivot: 60.56
1st Support: 57.68
1st Resistance: 62.10
Disclaimer:
The above opinions given constitute general market commentary, and do not constitute the opinion or advice of IC Markets or any form of personal or investment advice.
Any opinions, news, research, analyses, prices, other information, or links to third-party sites contained on this website are provided on an "as-is" basis, are intended only to be informative, is not an advice nor a recommendation, nor research, or a record of our trading prices, or an offer of, or solicitation for a transaction in any financial instrument and thus should not be treated as such. The information provided does not involve any specific investment objectives, financial situation and needs of any specific person who may receive it. Please be aware, that past performance is not a reliable indicator of future performance and/or results. Past Performance or Forward-looking scenarios based upon the reasonable beliefs of the third-party provider are not a guarantee of future performance. Actual results may differ materially from those anticipated in forward-looking or past performance statements. IC Markets makes no representation or warranty and assumes no liability as to the accuracy or completeness of the information provided, nor any loss arising from any investment based on a recommendation, forecast or any information supplied by any third-party.

US Oil wolfwaveMy idea us oil wolfwave pattren use small trade with SL big profit
If hit SL buy again trend line up side break same SL
The US-Oil will jump from the historic Support LevelHello Traders
In This Chart US-OIL HOURLY Forex Forecast By FOREX PLANET
today US-OIL analysis 👆
🟢This Chart includes_ (US-OIL market update)
🟢What is The Next Opportunity on US-OIL Market
🟢how to Enter to the Valid Entry With Assurance Profit
This CHART is For Trader's that Want to Improve Their Technical Analysis Skills and Their Trading By Understanding How To Analyze The Market Using Multiple Timeframes and Understanding The Bigger Picture on the Charts
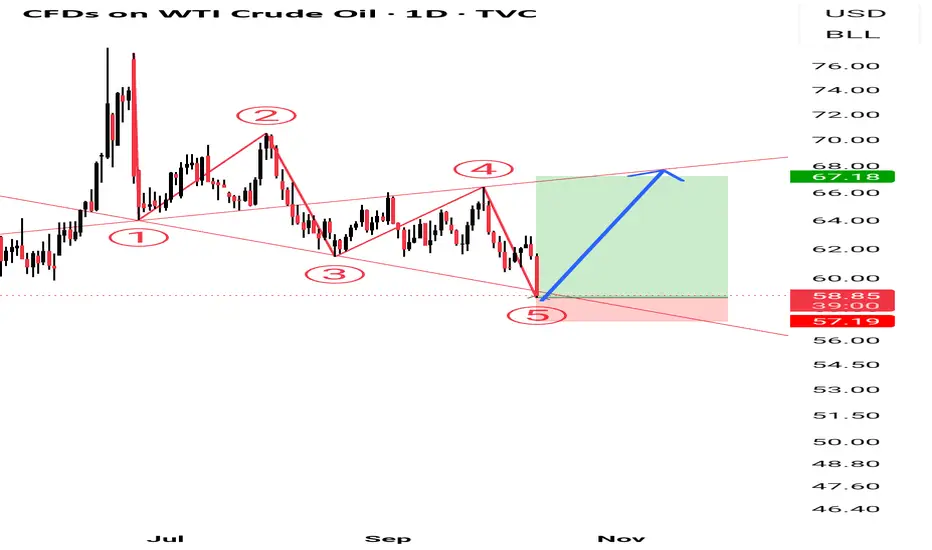
WTI (Crude Oil) — Bullish Bat in ProgressOANDA:WTICOUSD
A bullish Bat pattern is currently forming, with a potential completion near $57.86 — the 88.6% Fibonacci retracement of the prior leg.
If the pattern confirms, it could trigger a bullish move toward $65.70, aligning with the 38.2% retracement level.
Price action around $57–58 will be key — watch for reversal confirmation, as momentum divergence before validating long positions.

XTIUSD possible pullback set up Long The oil price fallen drastically and now price has crossed the trendline but has not crossed the cloud , price within the cloud and possibly may break resistance . Since it’s at support you can buy with very small stop loss .

XTI/USD Chart Analysis: Oil Price Falls Below $60XTI/USD Chart Analysis: Oil Price Falls Below $60
Friday’s comments from President Trump about the potential introduction of 100% tariffs on trade with China pushed WTI crude oil below the $60 level for the first time in four months. The bearish sentiment stemmed from fears of a global economic slowdown amid escalating trade tensions between the world’s two largest economies.
The decline was further supported by news of peace efforts in the Middle East, which reduced the impact of geopolitical risk on oil prices.
As the XTI/USD chart shows, WTI is currently trading below $60. How might the situation unfold next?
Technical Analysis of the XTI/USD Chart
In the long-term view, oil price movements (following the flare-up in the Middle East in June) have formed a descending channel shown in red — notably, the current price has fallen below its lower boundary.
In the shorter term, we can observe an acceleration of the decline, emphasised by the purple trajectory lines.
These observations suggest that selling pressure remains dominant, while any recovery attempts are likely to meet resistance near:
→ the psychological level of $60;
→ the lower boundary of the red channel;
→ the purple median line.
Given that the White House is reportedly in favour of lower oil prices (as a means of stimulating the US economy and exerting pressure on geopolitical rivals), WTI crude could drift towards the year’s low around $55.
However, from the demand-side perspective, it cannot be ruled out that the oil market, known for its false breakouts above previous highs (A, B, C), may repeat a similar move above peak D — a pattern that, in Smart Money Concept terms, would represent a liquidity grab.
This article represents the opinion of the Companies operating under the FXOpen brand only. It is not to be construed as an offer, solicitation, or recommendation with respect to products and services provided by the Companies operating under the FXOpen brand, nor is it to be considered financial advice.

Copper and Oil: A Rare Divergence in the Commodity ComplexThe chart compares Copper (brown) and TVC:USOIL (blue) — two of the most cyclical commodities, both highly sensitive to global growth.
Historically, they tend to move in tandem: when economic momentum improves, both rise; when demand weakens, both fall.
But today we see an unusual divergence —
-Copper holding near multi-year highs, supported by structural deficits and energy transition demand.
-Oil trading below $60, its lowest since 2021, signaling cyclical slowdown and weak liquidity.
This gap rarely lasts long. Either copper is too optimistic, or oil is too pessimistic — one of them is likely “lying.”
Which one will be right this time?

Hellena | Oil (4H): SHORT to support area of 58.884Colleagues, it appears that the downward movement is not over and I see several reasons to continue to look short.
The higher order wave “C” is looking to complete the correction and I expect the start of the middle order wave “3” to see the low update and reach the support area at 58.884.
Fundamental context
Oil remains under pressure as supply increases and demand outlook weakens. OPEC+ decided to slightly raise output for November, while U.S. inventories keep growing. Crude lost about 8% last week, and EIA now expects lower prices by the end of the year — all of which supports the idea of a continued downside move within wave “3” toward the 58.884 support area.
Manage your capital correctly and competently! Only enter trades based on reliable patterns!

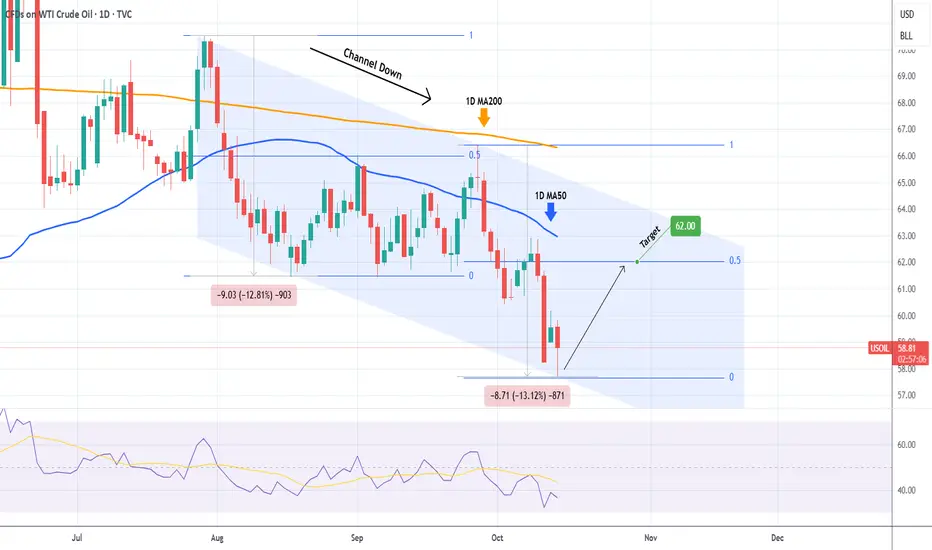
WTI OIL hit the Channel Down bottom. Buy Signal.WTI Oil (USOIL) has been trading within a Channel Down since the July 30 High and today it hit its bottom (Lower Lows trend-line). The decline from the recent Lower High was around -13%, similar to the previous Bearish Leg.
When that bottomed (Lower Low), it rebounded towards its 1D MA50 (blue trend-line) and peaked (Lower High) marginally above the 0.5 Fibonacci retracement level. As a result, we expect a new Bullish Leg to start now, with our Target at $62.00.
-------------------------------------------------------------------------------
** Please LIKE 👍, FOLLOW ✅, SHARE 🙌 and COMMENT ✍ if you enjoy this idea! Also share your ideas and charts in the comments section below! This is best way to keep it relevant, support us, keep the content here free and allow the idea to reach as many people as possible. **
-------------------------------------------------------------------------------
💸💸💸💸💸💸
👇 👇 👇 👇 👇 👇
OIL BEARISH FAKEOUT LOOK TO BUYOur analysis is based on a multi-timeframe top-down approach and fundamental analysis.
Based on our assessment, the price is expected to return to the monthly level.
DISCLAIMER: This analysis may change at any time without notice and is solely intended to assist traders in making independent investment decisions. Please note that this is a prediction, and I have no obligation to act on it, nor should you.
Please support our analysis with a boost or comment!

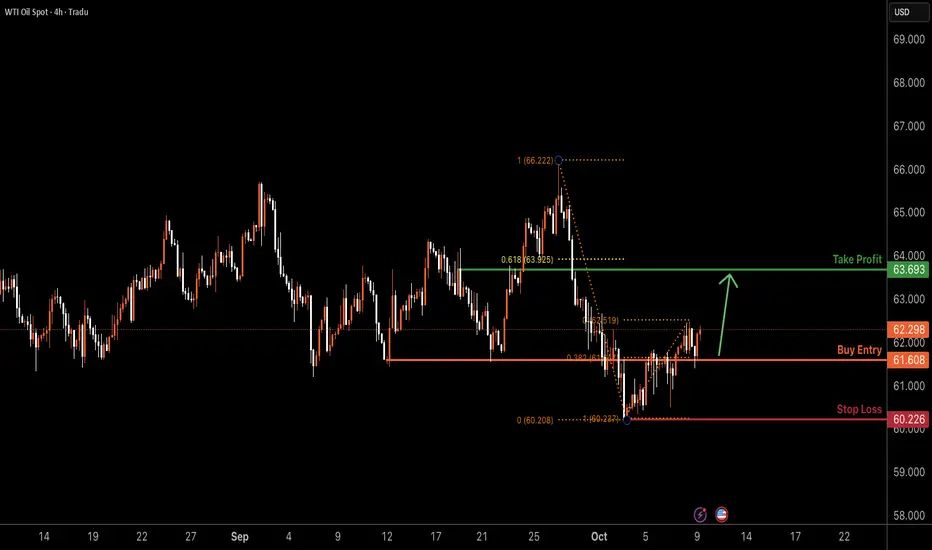
USOIL H4 | Bullish Reversal at Key SupportBased on the H4 chart analysis, we can see that the price has bounced off the buy entry, which is an overlap support that aligns with the 38.2% Fibonacci retracement and could rise from this level to the upside.
Buy entry is at 61.60, which is an overlap support that aligns with the 38.2% Fibonacci retracement.
Stop loss is at 60.22, whic is a swing low support.
Take profit is at 63.69, which is a pullback resistance that is slightly below the 61.8% Fibonacci retracement.
High Risk Investment Warning
Trading Forex/CFDs on margin carries a high level of risk and may not be suitable for all investors. Leverage can work against you.
Stratos Markets Limited (tradu.com ):
CFDs are complex instruments and come with a high risk of losing money rapidly due to leverage. 65% of retail investor accounts lose money when trading CFDs with this provider. You should consider whether you understand how CFDs work and whether you can afford to take the high risk of losing your money.
Stratos Europe Ltd (tradu.com ):
CFDs are complex instruments and come with a high risk of losing money rapidly due to leverage. 66% of retail investor accounts lose money when trading CFDs with this provider. You should consider whether you understand how CFDs work and whether you can afford to take the high risk of losing your money.
Stratos Global LLC (tradu.com ):
Losses can exceed deposits.
Please be advised that the information presented on TradingView is provided to Tradu (‘Company’, ‘we’) by a third-party provider (‘TFA Global Pte Ltd’). Please be reminded that you are solely responsible for the trading decisions on your account. There is a very high degree of risk involved in trading. Any information and/or content is intended entirely for research, educational and informational purposes only and does not constitute investment or consultation advice or investment strategy. The information is not tailored to the investment needs of any specific person and therefore does not involve a consideration of any of the investment objectives, financial situation or needs of any viewer that may receive it. Kindly also note that past performance is not a reliable indicator of future results. Actual results may differ materially from those anticipated in forward-looking or past performance statements. We assume no liability as to the accuracy or completeness of any of the information and/or content provided herein and the Company cannot be held responsible for any omission, mistake nor for any loss or damage including without limitation to any loss of profit which may arise from reliance on any information supplied by TFA Global Pte Ltd.
The speaker(s) is neither an employee, agent nor representative of Tradu and is therefore acting independently. The opinions given are their own, constitute general market commentary, and do not constitute the opinion or advice of Tradu or any form of personal or investment advice. Tradu neither endorses nor guarantees offerings of third-party speakers, nor is Tradu responsible for the content, veracity or opinions of third-party speakers, presenters or participants.
WTI 4H🔹 Overall Outlook and Potential Price Movements
In the charts above, we have outlined the overall outlook and possible price movement paths.
As shown, each analysis highlights a key support or resistance zone near the current market price. The market’s reaction to these zones — whether a breakout or rejection — will likely determine the next direction of the price toward the specified levels.
⚠️ Important Note:
The purpose of these trading perspectives is to identify key upcoming price levels and assess potential market reactions. The provided analyses are not trading signals in any way.
✅ Recommendation for Use:
To make effective use of these analyses, it is advised to manually draw the marked zones on your chart. Then, on the 5-minute time frame, monitor the candlestick behavior and look for valid entry triggers before making any trading decisions.

USOIL : Full analysisHello friends
Well, considering the sharp decline we had, the price has entered a descending channel and is slowly going down in this channel.
Now the price has reached a critical point, namely the bottom of the channel.
We need to see if buyers will support the price at the bottom of the channel like the previous two times or not?
If we do not see support from buyers and the channel is broken, we can expect lower prices.
56.30 and 53 dollars respectively.
But we will most likely see buyers' support in this area and the price could even reach the channel ceiling.
*Trade safely with us*

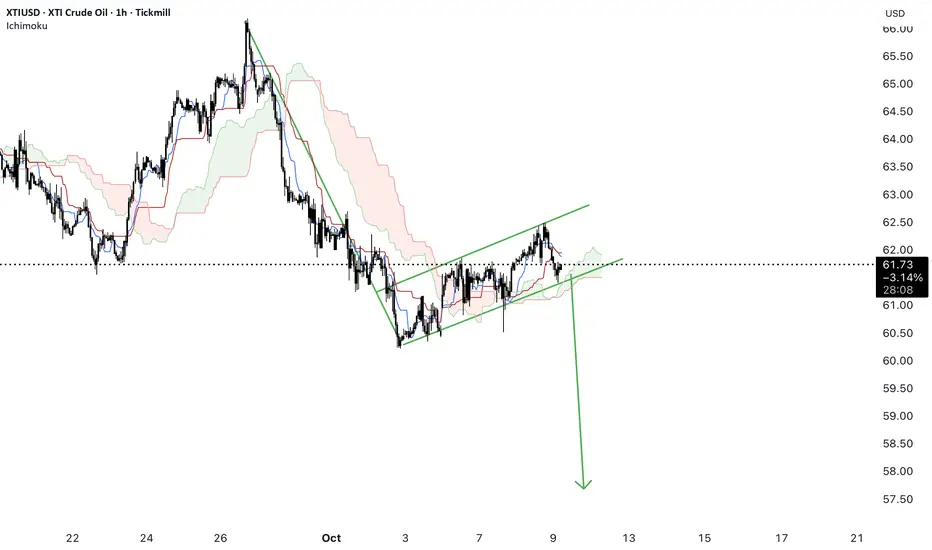
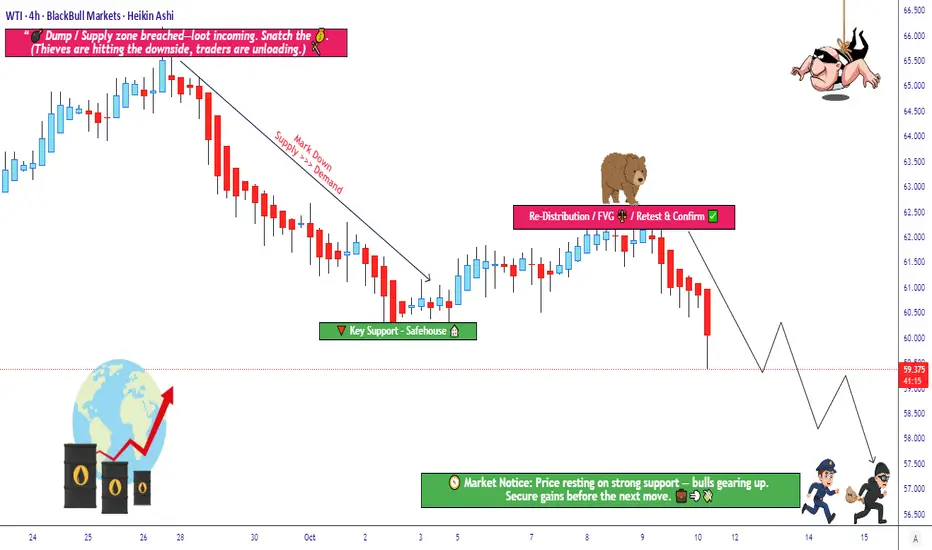
Is Crude Oil Setting Up for a Major Bearish Reversal?🛢️ XTI/USD “WTI” – Bearish Redistribution Zone Incoming (Thief Strategy Inside)
📉 Setup Overview
Market: XTI/USD (WTI crude oil)
Bias: Bearish confirmed — we’re looking for re-distribution / supply pressure to take control
Trade Type: Swing / Day Trade hybrid
🎯 Entry Plan (Thief-Layer Strategy)
I use a layering / multiple limit order approach (aka “Thief Strategy”). You may use any price level as entry, but here’s my preferred ladder:
Sell Limit @ 61.500
Sell Limit @ 61.000
Sell Limit @ 60.500
Sell Limit @ 60.000
Sell Limit @ 59.500
(You may extend more layers if you like)
You don’t need to hit all layers — just get partial fills, ride the move downward.
🚫 Stop Loss
Thief’s SL: 62.500
⚠️ Note to Thief OG’s: I’m not forcing you to follow my SL. You choose what works. Make money, take money — at your own risk.
🎯 Target
We see police barricade as a strong support zone + oversold trap possibility.
So primary target: 57.000
⚠️ Note to Thief OG’s: Don’t blindly hold to my TP. If price gives you your gains early, escape with your money — don’t wait for perfection.
🔍 Related Pairs & Correlations
AMEX:USO or USOIL (oil ETFs / indices) – real-world crude correlation
$BRENT/USD – watch for strength or weakness divergence
AMEX:XOP / AMEX:OIH (oil & gas sector indices) – sentiment in energy names
Key point: if Brent weakens while WTI breaks down, it reinforces the bias.
📌 Key Technical Notes
We’re waiting for ** redistribution / supply zone** to hold — a retest or failure bounce is ideal setup.
Oversold conditions + a “trap” candle (fake breakout) strengthen the move.
Use layering to average in, not “all-in” at once.
Be ready for whipsaws around support zones; partial exits can help.
✨ “If you find value in my analysis, a 👍 and 🚀 boost is much appreciated — it helps me share more setups with the community!”
Disclaimer: This is Thief-style trading strategy just for fun. I am not giving financial advice. Trade at your own decision and risk.
#WTI #CrudeOil #XTIUSD #EnergyTrading #OilStrategy #Layering #SwingTrade #DayTrade #BearishBias #ThiefStrategy
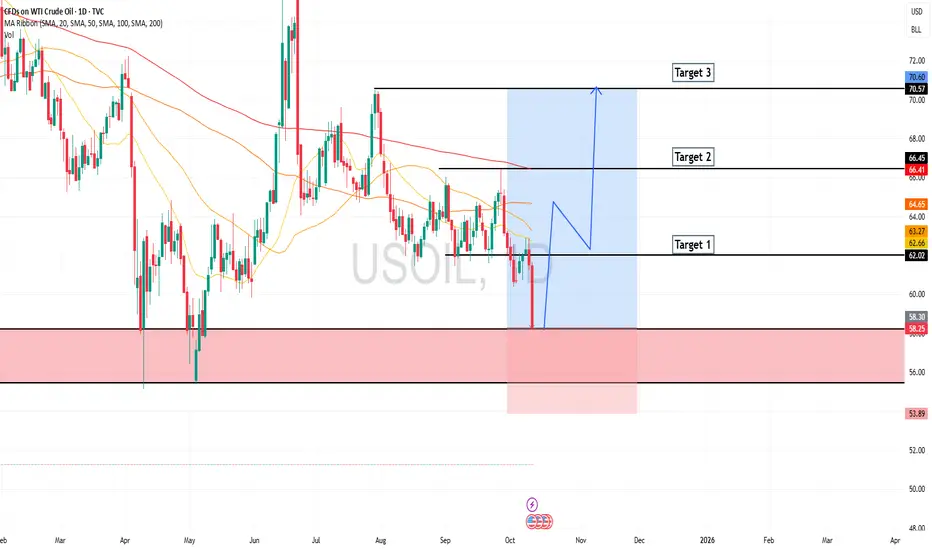
WTI Crude Oil: What Could Happen Next?Oil prices are sitting at a really important spot right now. Here’s what to watch for:
If the price drops below $58.28, it could keep falling toward $50.
If it breaks below $50, we might see it slide into the $43–$46 range.
But if oil climbs back above $65, it could run up toward $74 again.
So in simple terms:
👉 Below $58 = could fall more
👉 Above $65 = could rise again
We’re in a “wait and see” zone ; the next move will show which way oil really wants to go.
If you’re watching this market and not sure what these levels mean for your trades, feel free to DM us ; happy to break it down in plain English or share how I’m looking at it myself.
Mindbloome Exchange

USOIL Market Direction: Bearish Tilt Amid Downward Momentum?USOIL Market Direction: Bearish Tilt Amid Downward Momentum?
Current Price Snapshot
As of October 15, 2025, USOIL (WTI Crude Oil) is trading around $58.20 per barrel, reflecting a modest intraday uptick of approximately 0.9% from yesterday's close at $58.66. This follows a 1.39% decline on October 14, extending a broader monthly drop of over 7%. The price has been consolidating in a descending channel, with recent lows testing the $57.29–$57.60 support zone, prompting a short-term corrective bounce.
Technical Indicators
- **Trend Structure**: USOIL remains below a key descending trendline on shorter timeframes (H1–H4), signaling sustained downward pressure. A breakdown below $57.65 could accelerate the slide toward $56.00 or lower, aligning with a potential descending flag pattern.
- **Momentum Oscillators**: The RSI (14-period) is climbing from oversold territory around 31, currently near 35–40, suggesting a temporary relief rally but lacking conviction for a full reversal. The ADX at 41.78 confirms a strong prevailing downtrend.
- **Moving Averages**: Price is below the 50-day SMA ($61.55) and 200-day EMA ($59.15), with bearish crossovers reinforcing the negative bias. Key resistance clusters at $60.44–$60.75 (Fibonacci retracement levels) cap upside potential.
- **Support/Resistance**: Immediate support at $57.29–$57.80; breach targets $56.00. Overhead resistance at $60.75, with a pivot at $61.50. A close above $60.75 would invalidate the bearish setup, but current action shows rejection at these levels.
Fundamental Drivers
- **Supply Dynamics**: OPEC+ is gradually unwinding production cuts, adding ~0.6 million barrels per day (b/d) in 2025, while non-OPEC output (led by the US at 13.5 million b/d) surges by 2.0 million b/d. This floods the market, driving global inventories higher and exerting downward force on prices. Recent US inventory builds (e.g., +1.8 million barrels in commercial crude) further signal softening demand.
- **Demand Outlook**: Resurfacing US-China trade tensions are clouding economic recovery prospects, capping industrial fuel needs. Global growth slowdowns, coupled with accelerated renewable energy investments, are projected to weaken crude consumption through 2026.
- **Geopolitical Factors**: While sanctions on Russia and Middle East risks provide occasional support, they are outweighed by ample supply. EIA forecasts Brent (closely correlated to WTI) averaging $62/bbl in Q4 2025, dropping to $52/bbl in 2026, implying further WTI weakness toward $56–$59 by year-end.
- **Macro Influences**: A strengthening USD (amid Fed hawkishness) makes oil less attractive to non-US buyers, adding to the bearish case. Broader forecasts from Reuters and LongForecast see WTI averaging $64.65 for 2025 but ending October near $52.76, a 15.5% monthly decline.
Sentiment from Market Chatter
Real-time discussions on platforms like X highlight mixed but predominantly cautious views. Some traders eye short-covering bounces toward $60, citing oversold RSI and potential OPEC data surprises, but consensus leans bearish, with calls for sub-$60 targets due to inventory builds and trade war fears. Retail signals show sporadic buy setups, but institutional positioning favors shorts.
Overall Direction and Outlook
**Bearish** – USOIL's trajectory today points downward, with the corrective uptick likely fizzling at $60 resistance. Expect continued pressure toward $57–$56 unless a decisive break above $60.75 emerges, which would shift bias to neutral.
Monitor upcoming EIA inventory data and US-China headlines for volatility spikes. Position sizing should account for low ATR (0.40), indicating subdued near-term swings. This assessment draws from a synthesis of price action, indicators, supply-demand fundamentals, and market sentiment for a comprehensive view.

USOIL: Check lower levels after breaking out of the rangeThis is my previous analysis — feel free to take a look for reference.
OIL PRICE OUTLOOK
(Week of Oct 06 - 10, 2025)
1. Institutional Forecast Updates
● IEA (Sep 15, 2025):
WTI targets $64.2/bbl for 2025 and $47.8/bbl for 2026
Brent targets $68/bbl for 2025 and $51/bbl for 2026
● Goldman Sach (Jul 14, 2025):
WTI targets $63/bbl for H2 2025 and $52/bbl for 2026
Brent targets $64/bbl for H2 2025 and $56/bbl for 2026
● J.P. Morgan (May 16, 2025):
WTI targets $63/bbl for H2 2025 and $52/bbl for 2026
Brent targets $64/bbl for H2 2025 and $56/bbl for 2026
www.rigzone.com
www.reuters.com www.jpmorgan.com
2. Key Drivers & Risks
🔹 Updates on Supply–Demand and Geopolitical News
OPEC+ announced a milder-than-expected production increase of around 137 kb/d for November, leaving the oversupply outlook through 2026 largely unchanged.
Geopolitical tensions in the Red Sea / Gulf of Aden have flared up again.
U.S. inventories and weekly data: API estimated a draw of 3.7 mb (Sep 26), while recent EIA reports have shown mixed, inconsistent trends.
Market consensus: Reuters’ latest survey keeps the Brent forecast at ~$67.6/bbl for 2025, unchanged from last month, with expectations for lower prices around $60 in 2025 and further weakness into 2026.
🔹 Watchlist for Next Week
Official details on OPEC+’s November production implementation
API / EIA weekly U.S. oil data
Maritime security developments
Any notable demand-side signals
🔹 Overall View
Governments appear to favor keeping oil prices lower to support economic growth, though current levels are near or below breakeven for many producers.
Oil prices are expected to gradually decline within a relatively narrow range of $70–$50, while potential supply–demand shocks remain key factors to monitor for any sharp volatility.
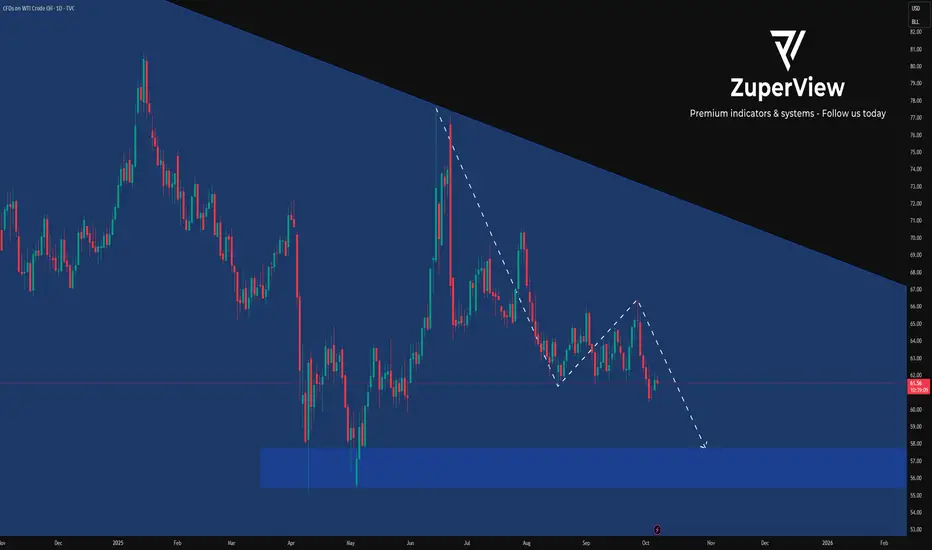
3. Technical Analysis
* Trend: assessed using at least three trend indicators, with market structure as the primary guide.
** Weak or Reversal Signals: Assessed based on one of our criteria for trend reversal signals.
*** Support/Resistance: Selected from multiple factors – static (Swing High, Swing Low, etc.), dynamic (EMA, MA, etc.), psychological (Fibonacci, RSI, etc.) – and determined based on the trader’s discretion.
**** Our advice takes into account all factors, including both fundamental and technical analysis. It is not intended as a profit target. We hope it can serve as a reference to help you trade more effectively. This advice is for informational purposes only and we assume no responsibility for any trading results based on it.
Please like and comment below to support our traders. Your reactions will motivate us to do more analysis in the future 🙏✨
George Vann @ ZuperView
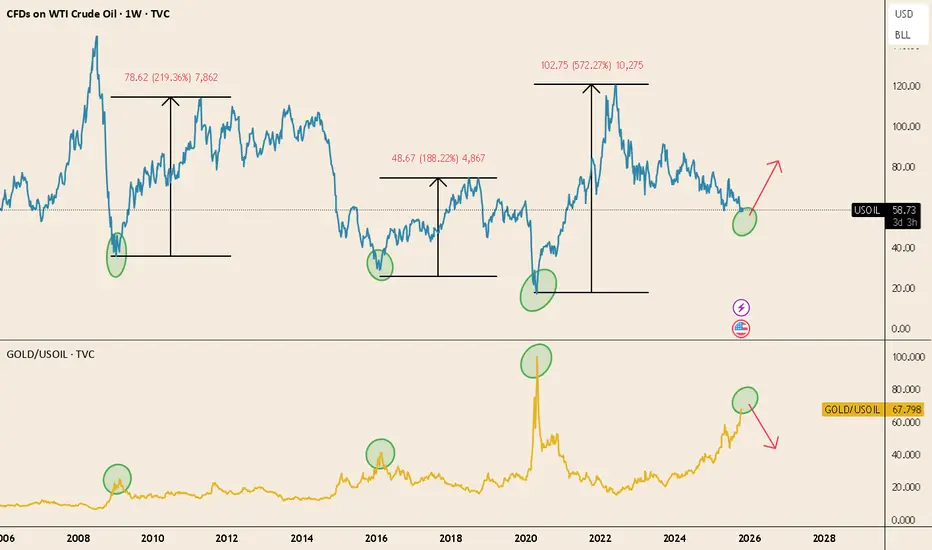
Oil vs Gold: Transition to the Next Commodity CycleThe chart compares WTI crude (top) and the Gold/Oil ratio (bottom) on a weekly basis.
Historically, when the Gold/Oil ratio spikes — meaning gold becomes very expensive relative to oil — it tends to mark the end of the precious metals phase and the beginning of the broader commodity cycle.
In the past three cycles:
-2009 → 2011: Oil +219%
-2016 → 2018: Oil +188%
-2020 → 2022: Oil +572%
We’re seeing the same setup again:
TVC:USOIL sits at long-term support.
Gold/Oil ratio has reached historical extremes.
In each of these cases, gold had already led the move — followed by silver, industrial metals, and finally oil — the last to rally as growth and inflation expectations picked up.
If history rhymes, this could mark the rotation point where energy begins to outperform within the commodity complex.
USOIL USOIL is seeing a two day buy rally but i dont like the position of oil ,i trade liquidity volatility and that's the direction of profit.
oil should either update the floor or the roof for clear directional bias. For now caution is needed until OPEC DATA REPORT IS CLEAR.
US STRATEGIC OIL RESERVE REPORT IS NEEDED TO TRADE USOIL .
I WILL COMMUNICATE OIL DIRECTION SOON.
#USOIL #OIL #DOLLAR
