USOIL: Great Trading Opportunity
USOIL
- Classic bullish pattern
- Our team expects retracement
SUGGESTED TRADE:
Swing Trade
Buy USOIL
Entry - 77.93
Stop - 76.10
Take - 81.31
Our Risk - 1%
Start protection of your profits from lower levels
❤️ Please, support our work with like & comment! ❤️
WTICOUSD trade ideas

May 4: More downside to come towards 60The last top failed to take over the previous top in RSI. Stochastic has already turned negative with the ongoing drop. One more leg down is needed to finish the entire correction. Downside target is the 60 area.

USOIL - NEW BREAKOUT 📉Hi Traders !
Previously,
The USOIL Price Formed a Bearish Double TOP Pattern.
Currently, The Support Level (81.29 - 80.33) is Broken !
So, I Expect a Bearish Move 📉.
_________
TARGET: 78.16🎯

USOIL - Bearish Wyckoff Creek USOIL
Ok I've got my bearish hat on today 🤠.
Starting to look at the possibility that rather than this area being accumulative that it may be the 3 wave pattern that we have seen in many charts and in multiple markets.
It is everywhere.
It is of course the 3 wave correction where the 3rd wave is the shallow Wyckoff Creek.
In this instance it is the Inverted Creek because the wave is ascending and the pattern is potentially bearish.
Notice that it topped in the 0.618 retracement Golden Window.
That could be a clue that this pattern is on.
So just like with S&P and Bitcoin, the projection here will come from seeing how impulsive this following bearish wave is in comparison to the ascending channel.
This is where it can be advantageous getting in early on these moves as shown before
I didn't have a higher time frame idea then, but now it is picking up speed, the higher time frame bearish scenario looks like a possibility.
If it is then crude oil can be heading much lower; back to sub $50 🧐
Not advice.

USOILanalysis suggests that the optimal selling zone for crude oil stands at 7861. This assessment prompts strategic considerations for traders, with suggested take-profit levels at 7811, and 7689\7610, offering multiple opportunities to secure gains. However, to mitigate potential losses, it's advisable to set a stop loss at 7930, safeguarding against adverse market movements beyond the anticipated sell zone. This comprehensive approach to trading incorporates both profit-taking measures and risk management strategies, optimizing the potential for favorable outcomes within the volatile crude oil market. By adhering to these targeted levels, traders can navigate market fluctuations with confidence, maximizing opportunities while minimizing exposure to downside risks


USOIL - at his supporting area?? holding or not?#USOIL - well guys market very well placed 79 arround low and that was our targeted area as we discussed in our last idea,
that is market very important supporting area as you can see in 4 hour chart history,
if market hold that area in that case you can see a bounce from that level,
keep close it and only hold your buying positions above that level,
good luck
trade wisely

USOIL UPDATE M30
Hey team, Hope you are Enjoying our ideas and Analysis, Today we are Monitoring USOIL looking for Buy Update Around 78.79 One More Buy Limit Around 78.41, Once we will Receive any Bullish Conformation the Trade Will be Excuted
Good Luck Guys 🤞

WTI Oil H4 | Falling to 61.8% Fibonacci supportWTI oil (USOIL) is falling towards a pullback support and could potentially bounce off this level to climb higher.
Buy entry is at 77.43 which is a pullback support that aligns with the 61.8% Fibonacci retracement level.
Stop loss is at 75.40 which is a level that lies underneath a pullback support.
Take profit is at 80.18 which is an overlap resistance.
High Risk Investment Warning
Trading Forex/CFDs on margin carries a high level of risk and may not be suitable for all investors. Leverage can work against you.
Stratos Markets Limited (www.fxcm.com):
CFDs are complex instruments and come with a high risk of losing money rapidly due to leverage. 68% of retail investor accounts lose money when trading CFDs with this provider. You should consider whether you understand how CFDs work and whether you can afford to take the high risk of losing your money.
Stratos Europe Ltd, previously FXCM EU Ltd (www.fxcm.com):
CFDs are complex instruments and come with a high risk of losing money rapidly due to leverage. 70% of retail investor accounts lose money when trading CFDs with this provider. You should consider whether you understand how CFDs work and whether you can afford to take the high risk of losing your money.
Stratos Trading Pty. Limited (www.fxcm.com):
Trading FX/CFDs carries significant risks. FXCM AU (AFSL 309763), please read the Financial Services Guide, Product Disclosure Statement, Target Market Determination and Terms of Business at www.fxcm.com
Stratos Global LLC (www.fxcm.com):
Losses can exceed deposits.
Please be advised that the information presented on TradingView is provided to FXCM (‘Company’, ‘we’) by a third-party provider (‘TFA Global Pte Ltd’). Please be reminded that you are solely responsible for the trading decisions on your account. There is a very high degree of risk involved in trading. Any information and/or content is intended entirely for research, educational and informational purposes only and does not constitute investment or consultation advice or investment strategy. The information is not tailored to the investment needs of any specific person and therefore does not involve a consideration of any of the investment objectives, financial situation or needs of any viewer that may receive it. Kindly also note that past performance is not a reliable indicator of future results. Actual results may differ materially from those anticipated in forward-looking or past performance statements. We assume no liability as to the accuracy or completeness of any of the information and/or content provided herein and the Company cannot be held responsible for any omission, mistake nor for any loss or damage including without limitation to any loss of profit which may arise from reliance on any information supplied by TFA Global Pte Ltd.
The speaker(s) is neither an employee, agent nor representative of FXCM and is therefore acting independently. The opinions given are their own, constitute general market commentary, and do not constitute the opinion or advice of FXCM or any form of personal or investment advice. FXCM neither endorses nor guarantees offerings of third party speakers, nor is FXCM responsible for the content, veracity or opinions of third-party speakers, presenters or participants.

Can crude finally find a footing?WTI oil (XTI/USD) is falling towards the pivot. Could this commodity potentially stall around this level before reversing to bounce higher towards the 1st resistance?
Pivot: 79.26
1st Support: 77.21
1st Resistance: 80.89
Risk Warning:
Trading Forex and CFDs carries a high level of risk to your capital and you should only trade with money you can afford to lose. Trading Forex and CFDs may not be suitable for all investors, so please ensure that you fully understand the risks involved and seek independent advice if necessary.
Disclaimer:
The above opinions given constitute general market commentary, and do not constitute the opinion or advice of IC Markets or any form of personal or investment advice.
Any opinions, news, research, analyses, prices, other information, or links to third-party sites contained on this website are provided on an "as-is" basis, are intended only to be informative, is not an advice nor a recommendation, nor research, or a record of our trading prices, or an offer of, or solicitation for a transaction in any financial instrument and thus should not be treated as such. The information provided does not involve any specific investment objectives, financial situation and needs of any specific person who may receive it. Please be aware, that past performance is not a reliable indicator of future performance and/or results. Past Performance or Forward-looking scenarios based upon the reasonable beliefs of the third-party provider are not a guarantee of future performance. Actual results may differ materially from those anticipated in forward-looking or past performance statements. IC Markets makes no representation or warranty and assumes no liability as to the accuracy or completeness of the information provided, nor any loss arising from any investment based on a recommendation, forecast or any information supplied by any third-party.

OIL COURT SHORTHello everyone, for OIL I'm aiming for a bearish continuation to fill the daily lower FVG.

WTI On supportWTI is sitting on major support area. On smaller timeframe we can see a lower low here, and if it's going to bounce it should be from there. I expect a reversal pattern today with a continuation of the upside moves next week. Main target from the long $83

✅CRUDE OIL BULLISH SETUP|LONG🚀
✅CRUDE OIL keeps falling
But a rising support line
Is ahead so after the
Retest we will be expecting
A local bullish rebound
LONG🚀
✅Like and subscribe to never miss a new idea!✅

USOILA bearish flag pattern is a continuation pattern that typically occurs within a downtrend and indicates a temporary pause before the price resumes its downward movement. It is formed by two parallel trendlines – the first trendline represents the initial downward move (flagpole), and the second trendline represents a consolidation period (flag).
Here's how a bearish flag pattern typically forms:
1. **Initial Decline (Flagpole):** The price experiences a sharp downward move, forming the flagpole of the pattern. This decline is often the result of increased selling pressure.
2. **Consolidation (Flag):** After the initial decline, the price enters a period of consolidation where it trades within a narrow range. This consolidation phase forms the flag portion of the pattern. During this phase, the volume tends to decrease, indicating a temporary equilibrium between buyers and sellers.
3. **Breakout:** Following the consolidation phase, the price typically breaks below the lower trendline of the flag, signaling the continuation of the downtrend. The breakout is often accompanied by an increase in volume, confirming the bearish momentum.
Traders who recognize a bearish flag pattern may consider entering short positions (selling) when the price breaks below the lower trendline of the flag, anticipating further downward movement. They often place stop-loss orders above the upper trendline of the flag to manage risk in case the pattern fails.
It's important to note that while bearish flag patterns can be reliable indicators of downward continuation, like any technical pattern, they are not infallible and can fail. Therefore, it's essential to combine pattern recognition with other technical analysis tools and risk management strategies.

USOILBuying at support and selling at resistance is a classic strategy in technical analysis. It involves identifying key levels where the price of an asset has historically shown support (where it tends to stop falling) and resistance (where it tends to stop rising).
"Support" refers to a price level where a downtrend is expected to pause due to a concentration of demand or buying interest. Traders often look for buying opportunities when the price approaches or reaches a support level, expecting the price to bounce back up.
"Resistance," on the other hand, is a price level where an uptrend is expected to pause due to a concentration of selling interest or supply. Traders often look to sell or take profits when the price approaches or reaches a resistance level, anticipating a potential reversal or consolidation.
It's important to note that support and resistance levels are not always precise, and they can sometimes be breached temporarily before the price resumes its previous trend. Therefore, it's essential to use additional technical indicators or analysis methods to confirm potential entry and exit points.
Additionally, risk management is crucial when employing this strategy. Traders often use stop-loss orders to limit potential losses if the price breaks through support or resistance levels

USOIL BULLS WILL DOMINATE THE MARKET|LONG
Hello,Friends!
USOIL pair is trading in a local downtrend which we know by looking at the previous 1W candle which is red. On the 6H timeframe the pair is going down too. The pair is oversold because the price is close to the lower band of the BB indicator. So we are looking to buy the pair with the lower BB line acting as support. The next target is 81.69 area.
✅LIKE AND COMMENT MY IDEAS✅

usoil will further push upsideHello Traders
In This Chart XTIUSD HOURLY Forex Forecast By FOREX PLANET
today XTIUSD analysis 👆
🟢This Chart includes_ (XTIUSD market update)
🟢What is The Next Opportunity on XTIUSD Market
🟢how to Enter to the Valid Entry With Assurance Profit
This CHART is For Trader's that Want to Improve Their Technical Analysis Skills and Their Trading By Understanding How To Analyze The Market Using Multiple Timeframes and Understanding The Bigger Picture on the Charts

USOIL(H4)The price of will raise to acquire the 82.76$ and higerThe price of the oil is looking to get some uptrend target now after recent declines for the downtrend the price of oil is going to up on 82.76 and mor then

USOIL BREAKOUT ON CHANNEL INDICATING SELL-OFF USOIL confirmed a bearish breakout on the bullish channel created under the daily timeframe today. Here I personally expect to see a strong selling back towards the bottom level of support while we have a resistance holding down the pressure on top close to $80. Here we are expecting bearish momentum to be built towards the $70-67 target region.

Israel strikes Iran againIsrael retaliated against Iran overnight, which saw the price of WTI crude oil jump nearly 4.5% before giving up some of its gains. Per media reports, three large explosions were heard in the country's south, and the U.S. official announced Israel successfully hit some of the targets, something Iran was quick to deny. Without regard for damages, it is already apparent the two adversaries entered a spiral of reciprocatory aggression. Unless there is any form of effective mediation between the two sides (which is, by the way, unlikely), the conflict could enter a stage of regional war, with Israel potentially fighting on multiple fronts. Needless to say, this has enormous implications for the region, which is responsible for a significant portion of the global oil supply and, thus, influences oil prices (at this point, the only counterweights for the rising price of oil could be OPEC’s willingness to bring production online, protraction of global economic slowdown, and potentially more releases of oil from the Strategic Petroleum Reserves by the USA).
Technical analysis
Daily time frame = Bullish (stalling/turning neutral)
Weekly time frame = Bullish
Please feel free to express your ideas and thoughts in the comment section.
DISCLAIMER: This analysis is not intended to encourage any buying or selling of any particular securities. Furthermore, it should not be a basis for taking any trade action by an individual investor or any other entity. Your own due diligence is highly advised before entering a trade.

USOIL BUYPossible BUY for USOIL?
The market is currently testing a major level based on the higher TF.
We could possibly see a 4hr chart pattern about to form should the buyers be hold their position.
Let's see how this will play out.
Feel free to share your views

Possible reversal scenarioPrice at support level + formation of bullish shark pattern + RSI divergence ; I am waiting for a reversal chart pattern to confim trend reversal
PS never risk more than 2% of your capital per trade

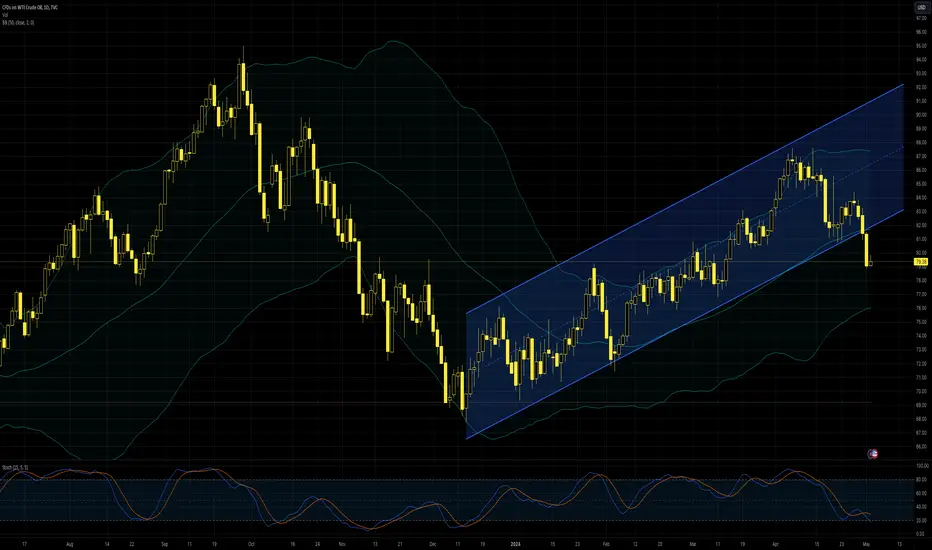
USOIL likely to find a floor around $78.50 for nowRising stocks of crude in the USA over recent weeks have put a hold to the commodity's long rally for now. However, recent rumours that the government's Strategic Petroleum Reserve might start to be refilled with prices of American light oil (Exness' symbol 'USOIL') below $79 seem to be a key reason for reluctance to push much below $80 a barrel as yet.
The rising channel has been broken clearly, which usually might be expected to open up the latest intraday low, around $76.50 from 11 March. That seems to be a challenge now both because of the fundamental (and political) situation and the price being in the value area between the 200 and 100 SMAs. The slow stochastic signals oversold, which adds to the overall impression that a pause or small bounce might be more likely than immediate continuation lower.
$80 is an important psychological zone and the area of early March's highs, so it's a likely resistance. The upcoming NFP probably won't have as big an impact on oil as gold, but it's important to watch for any major surprise while not forgetting the regular rig count on Friday night and next week's usual stock data. With no top-tier Chinese data due until 17 May's industrial production, the price might find a range around $78.50-$81.
This is my personal opinion which does not represent the opinion of Exness. This is not a recommendation to trade.