USOIL Potential UpsidesHey Traders, in today's trading session we are monitoring USOIL for a buying opportunity around 80.80 zone, USOIL is trading in an uptrend and currently is in a correction phase in which it is approaching the trend at 80.80 support and resistance area.
Trade safe, Joe.
WTICOUSD trade ideas

WTI downswing ABC with date predictionthe main premise is thaat EIA has forecast supply demand balance the ew is HS into triple combo wave and looking to recovery abc towards equilibrium levels on the weekly here shown daily candles with 72 ish TP before resuming bullishness


Oil showing wayI'm shorting oil on resistance at $85. Don't get me wrong I like making money, but if this head and shoulders triggers? We will be supporting not only our immediate family, but our extended families as well. This will take oil to $30 range. Only 1 thing takes oil near covid lows. That's a major drop in US markets. Watch March-May. If it triggers I believe will happen between now and end of May. Liquidity will drain rapidly now. Fed hands tried due to Inflation. Once market realizes no fed bailout due to inflation, holy crap moment will come.

Usoil bullish trend Hey there on Usoil 2h candle looking for short and support area for buying opportunity from 80.00
And so for now the liquidity grab some time and looks forward towards on 80
So our next target is for now 81 and 82 and 83 for upper side resistance support area
Keep touch with us for more updates

Hellena | Oil (4H): Long to resistance area 81.85. Dear Colleagues, price has strongly updated the low, completing wave 2. I suppose that the price can still make a small correction, but I put the target in the same place as last time - resistance area 81.85.
Manage your capital correctly and competently! Only enter trades based on reliable patterns!

Weekly Analysis Oil WTIThe West Texas Intermediate, also known as Texas Light Sweet, is a type of oil produced in Texas and used as a benchmark in the price of oil, on the NYMEX futures market. It is a high-quality raw material from the refining of which a high percentage of gasoline and light diesel is obtained.

USOIL LongReason:
Market structure is bullish
Fair value gaps
Break of structure
COT data showed me that last week smart money have been going long on OIL
i always take trades on the 0.8 level of fibonacci retracement but ive been trying something different and enter on the 0.618 level and have a set R.R of 2.5. dont see this as a signal but just an idea

WTI LONGDiscretionary and Elite Trade
Obtain liquidity in 4H and Daily structural zone
Transitional switch was confirmed in the 1 minute time frame
Transitional switch was confirmed in the 3 minute time frame
Transitional switch was confirmed in the 5 minute time frame
Targeting upper liquidity pools
RR 1:3.7

Oil on the Edge! Key Data in the American Session today The crude oil market has experienced a reduction in demand this week, holding prices steady since Monday, after weeks of losses in value due to a decrease in demand, especially from the main importer, the Chinese market which put the price on Monday at $76.49. During today's Asian session, crude oil has shown a 3.62% increase from Wednesday's European open to the current high of $80.31.
Although Chinese buying data increased in the first two months of the year compared to the same period last year, being lower than previous months. This day's American session will be influenced by key data such as manufacturing production, retail sales and the US unemployment rate, which will determine the evolution in the demand for oil and its derivatives and will present us whether the US economy is robust enough to sustain current prices in an environment of slowing global productive demand.
From a technical perspective, the RSI shows a highly overbought level of 70.44%, with weak trading volumes, and a marked checkpoint at $78.09 represented in a mono-bell. This presents us with three possible scenarios:
- If expectations are positive for the non-U.S. market, prices could reach $85, a significant price barrier since last November.
- If the market remains stable, prices are likely to remain sideways with no major movements moving between $77 and $80.
- If the U.S. outlook is negative, price is likely to retreat back toward $76, an area of strong trading since mid-February.
This afternoon's news will be crucial for the evolution of the crude oil market, so it is recommended to stay tuned.
Ion Jauregui - AT Analyst
The information provided does not constitute investment research. The material has not been prepared in accordance with the legal requirements designed to promote the independence of investment research and such should be considered a marketing communication.
All information has been prepared by ActivTrades ("AT"). The information does not contain a record of AT's prices, or an offer of or solicitation for a transaction in any financial instrument. No representation or warranty is given as to the accuracy or completeness of this information.
Any material provided does not have regard to the specific investment objective and financial situation of any person who may receive it. Past performance is not reliable indicator of future performance. AT provides an execution-only service. Consequently, any person acing on the information provided does so at their own risk.

XTIUSD LONG TERM SELLING TRADE ANALYSISHello Traders
In This Chart XTIUSD HOURLY Forex Forecast By FOREX PLANET
today XTIUSD analysis 👆
🟢This Chart includes_ (XTIUSD market update)
🟢What is The Next Opportunity on XTIUSD Market
🟢how to Enter to the Valid Entry With Assurance Profit
This CHART is For Trader's that Want to Improve Their Technical Analysis Skills and Their Trading By Understanding How To Analyze The Market Using Multiple Timeframes and Understanding The Bigger Picture on the Charts

Gavinoil Strategy Breaks 80 Short-Term Bullish
The short-term (1H) trend of crude oil found support at the lower edge of the range channel, turned upward, and broke through the resistance at the upper edge of the range. Oil prices once again hit the 80 mark. Oil prices fluctuated weakly below 80 in early trading, and bulls showed strong momentum. It is expected that crude oil will break through 80 in the short term and continue to rise.
oil:buy79.5-80
tp:80.5-80
sl:78.8

XTIUSD LONG TERM SELLING TRADE ANALYSIS18 hours ago
Hello Traders
In This Chart XTIUSD HOURLY Forex Forecast By FOREX PLANET
today XTIUSD analysis 👆
🟢This Chart includes_ (XTIUSD market update)
🟢What is The Next Opportunity on XTIUSD Market
🟢how to Enter to the Valid Entry With Assurance Profit
This CHART is For Trader's that Want to Improve Their Technical Analysis Skills and Their Trading By Understanding How To Analyze The Market Using Multiple Timeframes and Understanding The Bigger Picture on the Charts

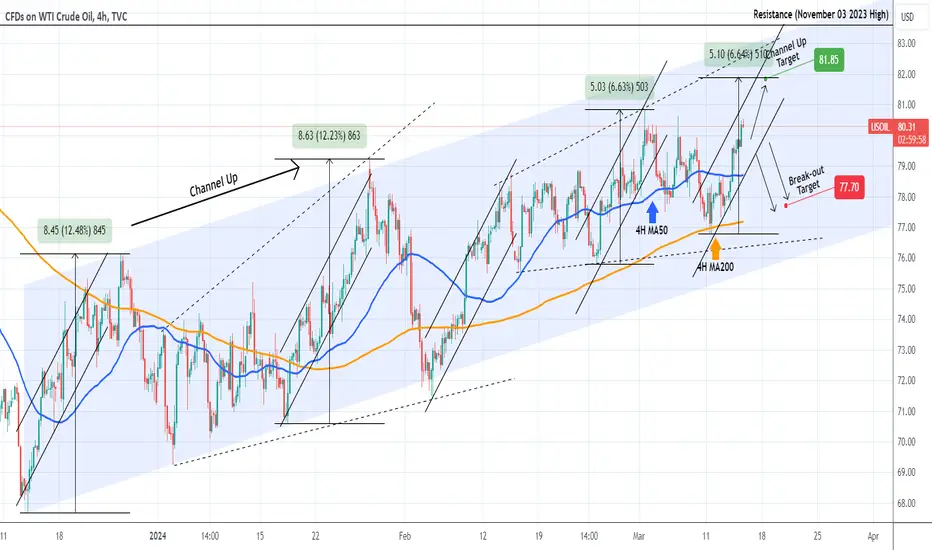
WTI OIL Trade according to this Channel Up.WTI Oil (USOIL) is trading within a short-term Channel Up on the 4H time-frame, with the wider pattern still a Channel Up since the December 13 2023 market bottom. As long as the price keeps closing the 4H candles within the Channel Up, we remain bullish, targeting 81.85 (+6.64%, which is the rise of the previous Bullish Leg of the dashed Rising Megaphone).
If a 4H candle is closed below it, we will take the loss and open a sell aimed at the 4H MA200 (orange trend-line) at 77.70.
-------------------------------------------------------------------------------
** Please LIKE 👍, FOLLOW ✅, SHARE 🙌 and COMMENT ✍ if you enjoy this idea! Also share your ideas and charts in the comments section below! This is best way to keep it relevant, support us, keep the content here free and allow the idea to reach as many people as possible. **
-------------------------------------------------------------------------------
💸💸💸💸💸💸
👇 👇 👇 👇 👇 👇
🛢 CL OIL H4 🛢 14 March 2024🛢 CL OIL, H4 🛢 14 March 2024
Crude oil prices climbed higher following better-than-expected inventory reports, with US Crude oil inventories declining more than anticipated according to Energy Information Administration (EIA) data. Investors await the International Energy Agency's monthly report for further insights into supply and demand dynamics, following OPEC's latest forecast.
Oil prices are trading higher while currently testing the resistance level. Suggesting the commodity might extend its gains after breakout.
Resistance level: 80.20, 84.10📉
Support level: 78.00, 75.95📈

Is the US oil market taking a turn? | Curious about the recent behavior of the US oil price? You're not alone. Many traders are keeping a keen eye on the US oil price chart, trying to decipher where the US oil market is heading next. Something interesting is brewing this week with US oil trading. Could there be a lucrative opportunity as the price potentially dips to the $76 mark and then aims for a retest at $78?
Is it time to consider trading US oil?

USOIL looks bearish Hey there on Usoil 1h candle looking for bearish possible for now
As we can move now sell side
So basically we can manipulate the market
USOIL SELL
SELL 80.00
TP1. 79.30
TP2.78.80
TP3.77.80
SL. 81.00

US crude- **decline in US crude inventories signaled strong demand in the world’s top oil consumer**
- **Ukrainian drone strikes on Russian refineries**
- **geopolitical risks in the Middle East**
- **extended supply cuts from OPEC+**

WTI Oil H4 | Heading into resistanceWTI oil (USOUSD) is rising towards a pullback resistance and could potentially reverse off this level to drop towards our take-profit target.
Entry: 80.963
Why we like it:
There is a pullback resistance level
Stop Loss: 82.300
Why we like it:
There is a resistance that sits beyond the 127.2% Fibonacci extension level
Take Profit: 77.797
Why we like it:
There is a pullback support level
Please be advised that the information presented on TradingView is provided to Vantage (‘Vantage Global Limited’, ‘we’) by a third-party provider (‘Everest Fortune Group’). Please be reminded that you are solely responsible for the trading decisions on your account. There is a very high degree of risk involved in trading. Any information and/or content is intended entirely for research, educational and informational purposes only and does not constitute investment or consultation advice or investment strategy. The information is not tailored to the investment needs of any specific person and therefore does not involve a consideration of any of the investment objectives, financial situation or needs of any viewer that may receive it. Kindly also note that past performance is not a reliable indicator of future results. Actual results may differ materially from those anticipated in forward-looking or past performance statements. We assume no liability as to the accuracy or completeness of any of the information and/or content provided herein and the Company cannot be held responsible for any omission, mistake nor for any loss or damage including without limitation to any loss of profit which may arise from reliance on any information supplied by Everest Fortune Group.

Overhead resistance for crude oil?WTI oil (XTI/USD) is rising towards an overlap resistance level at 80.79 which has been identified as a pivot point. Could price stall around this level before potentially reversing to drop lower?
Pivot: 80.79
Support: 75.84
Resistance: 83.52
Risk Warning:
Trading Forex and CFDs carries a high level of risk to your capital and you should only trade with money you can afford to lose. Trading Forex and CFDs may not be suitable for all investors, so please ensure that you fully understand the risks involved and seek independent advice if necessary.
Disclaimer:
The above opinions given constitute general market commentary, and do not constitute the opinion or advice of IC Markets or any form of personal or investment advice.
Any opinions, news, research, analyses, prices, other information, or links to third-party sites contained on this website are provided on an "as-is" basis, are intended only to be informative, is not an advice nor a recommendation, nor research, or a record of our trading prices, or an offer of, or solicitation for a transaction in any financial instrument and thus should not be treated as such. The information provided does not involve any specific investment objectives, financial situation and needs of any specific person who may receive it. Please be aware, that past performance is not a reliable indicator of future performance and/or results. Past Performance or Forward-looking scenarios based upon the reasonable beliefs of the third-party provider are not a guarantee of future performance. Actual results may differ materially from those anticipated in forward-looking or past performance statements. IC Markets makes no representation or warranty and assumes no liability as to the accuracy or completeness of the information provided, nor any loss arising from any investment based on a recommendation, forecast or any information supplied by any third-party.

USOIL - H1 ANALYSIS1. Invalid area
2. Liquidity want to be taken
2. Break of Struture is here for brearish trend

Crude Oil (WTI) may rise to 80.00 - 80.65Pivot
79.20
Our preference
Long positions above 79.20 with targets at 80.00 & 80.65 in extension.
Alternative scenario
Below 79.20 look for further downside with 78.70 & 78.20 as targets.
Comment
The RSI is mixed to bullish.
Supports and resistances
80.90
80.65
80.00
79.76 Last
79.20
78.70
78.20
Number of asterisks represents the strength of support and resistance levels.

Asset: US Oil Action: Sell Entry Price: $79.720 Take Profit TRGTTrade Details:
Asset: US Oil
Action: Sell
Entry Price: $79.720
Take Profit Targets:
$79.003
$78.500
$77.500
Stop Loss: $80.732
Analysis:
The decision to sell US Oil at $79.720 is based on market analysis indicating a potential downward movement in the oil price. This analysis could stem from factors such as geopolitical tensions, supply-demand imbalances, or economic indicators affecting the oil market. By setting take profit targets at $79.003, $78.500, and $77.500, the trader aims to capitalize on potential price declines at these levels. These targets are strategically chosen based on technical analysis, support levels, or previous price action. The stop loss at $80.732 acts as a risk management tool, limiting potential losses if the trade moves against expectations. It's crucial to monitor market conditions and adjust the trade strategy accordingly to maximize potential gains or mitigate losses. Traders should also consider factors such as news events, economic data releases, and overall market sentiment when executing and managing trades in the volatile oil market.
