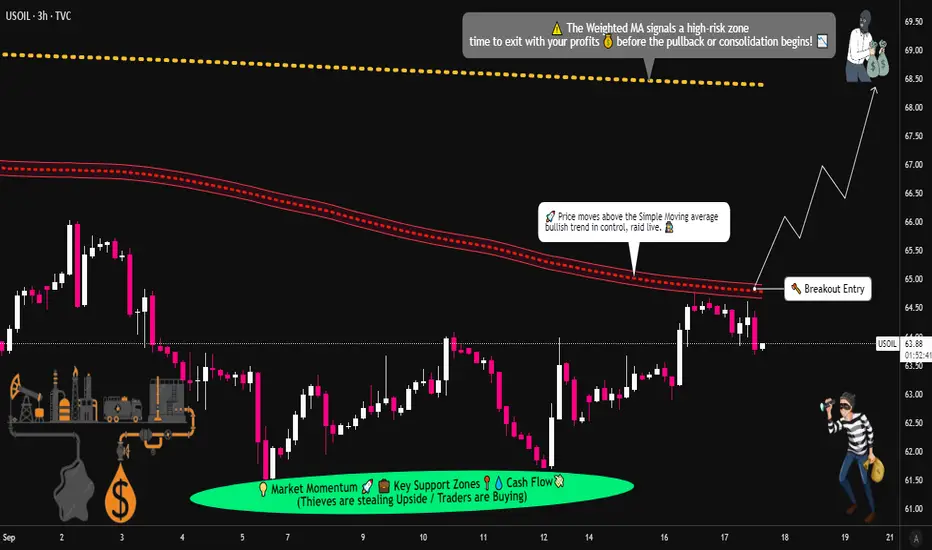
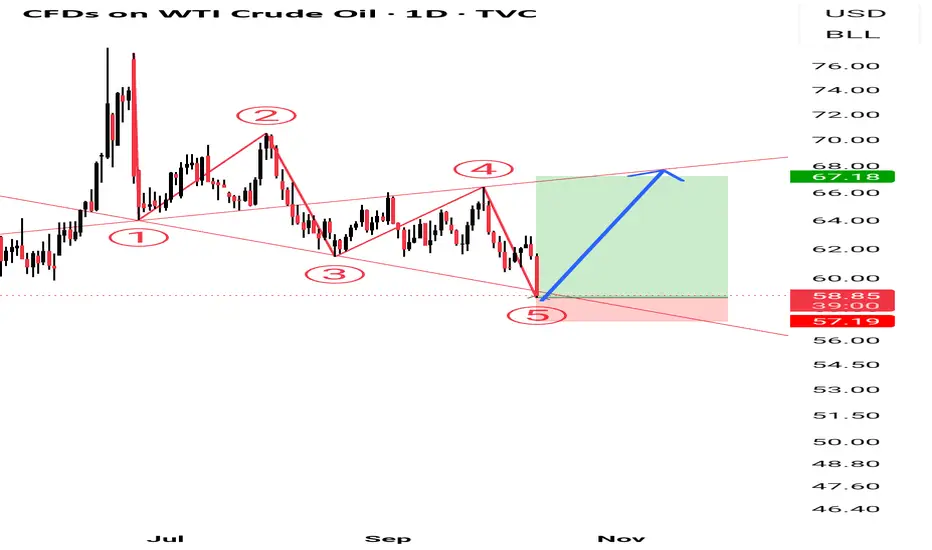
Can USOIL Break Higher? SMA Breach & Target at $68🛢️ USOIL Energy Market | Cash Flow Management Strategy (Swing/Day Trade)
📌 Trading Plan:
👉 Bias: Bullish (pending order setup)
👉 Confirmation: When Simple Moving Average (SMA) is breached by buyers, trend confirmation is valid.
👉 Entry Style: Layered buy-limit entries after breakout confirmation (Thief Strategy 🕵️♂️ = multi-layer entry).
📥 Layered Buy Limit Orders (example setup):
64.00 ✅
64.50 ✅
65.00 ✅
65.50 ✅
(You can increase the number of layered entries based on your own style — flexibility is the thief’s edge!)
⚠️ Important: Buy-limit layers are only valid AFTER breakout confirmation. Do not jump in without confirmation.
🎯 Risk Management (SL & TP):
📌 Stop Loss (Protective Level)
Example stop placement: 63.50
(🔑 Note: This is my style. Manage risk in your own way — never copy-paste without adapting!).
📌 Target Zone
Projected resistance near 68.00, aligned with:
Weighted Moving Average (WMA) resistance
Overbought conditions
Possible “trap” zone ⚠️
💡 Best approach: Secure profits step by step. Escape once the target region is approached.
📢 Note for Traders (Thief OG’s):
I’m not recommending only my SL or my TP. This is just a framework. You’re responsible for your own money management, profits, and exits. Trade at your own risk, and take the bag when you feel it’s right. 💰
🔗 Correlation & Related Pairs to Watch:
Energy markets are heavily correlated across multiple assets:
🛢️ TVC:USOIL / BLACKBULL:WTI – Main setup
🛢️ BLACKBULL:BRENT – Moves in sync with USOIL, watch for confirmation
💵 TVC:DXY – Stronger USD often pressures crude oil prices
💹 AMEX:XLE (Energy Sector ETF) – Tracks US energy stocks, gives indirect flow confirmation
🪙 FX:NGAS – Energy sector cousin, can sometimes give early signals of demand shifts
Keep an eye on these related pairs/assets for flow confirmation and stronger conviction.
🧾 Key Points Recap:
✔️ SMA breach = buyers’ control confirmed
✔️ Layered entries (Thief Strategy 🕵️♂️)
✔️ Stop loss = personal choice (mine @63.50)
✔️ Target = 68.00 escape zone
✔️ Risk & reward = your own responsibility
✔️ Watch related assets for confirmation
✨ “If you find value in my analysis, a 👍 and 🚀 boost is much appreciated — it helps me share more setups with the community!”
#USOIL #WTI #CrudeOil #EnergyMarkets #SwingTrade #DayTrade #TradingStrategy #PriceAction #ThiefStrategy #LayeredEntries #XLE #BRENT #DXY #NGAS
Trade ideas
WTI Oil Shorting Opportunity | Technical + Macro Confirm📌 WTI CRUDE OIL | Money-Making Thief Plan 🛢️ (Swing/Day Trade)
🗡️ Thief Strategy Plan (Bearish Bias)
Plan: Bearish setup confirmed — sellers in control after MA rejection of bulls 📉
Entry (Layered Style):
63.000 🔪
62.500 🔪
62.000 🔪
61.500 🔪
(You may increase or adjust layers based on your own plan)
Stop Loss (Thief SL): @64.000 ❌
⚠️ Adjust SL according to your risk & strategy
Target (Thief TP): Key resistance zone + overbought trap @4.6700 🎯
Note: Dear Ladies & Gentlemen (Thief OG’s) — I don’t recommend locking only my TP. Take your profits wisely & manage risk responsibly. 💰
❓ Why This Plan?
Moving average rejection confirms sellers’ dominance ⚔️
Technical indicators showing strong sell bias 📉
Layered entry strategy helps in catching moves efficiently 🎯
Oversupply risk + weak demand = bearish fuel 🔥
Retail & institutions both leaning short-side heavy 🐻
🔍 Market Analysis (Technical + Fundamental + Macro + Sentiment)
📊 Real-Time Price Action - Sep 05
Daily Change: -1.03%
Monthly Change: -2.84%
Yearly Change: -8.44%
😊 Retail & Institutional Sentiment
Retail Traders: 35% 🐂 | 55% 🐻 | 10% 😐
Institutional Traders: 30% 🐂 | 60% 🐻 | 10% 😐
🌡️ Fear & Greed Index
Current: 25/100 — Fear 😟
Mood: Cautious, driven by oversupply fears + weak demand
⚒️ Fundamental Score: 40/100 (Bearish)
U.S. crude inventories unexpectedly +2.42M vs. -2.19M expected 📈
OPEC+ considering production increase 🌍
Weak China demand signals 📉
🌐 Macro Score: 35/100 (Bearish)
Fed rate cut expectations (25bp likely in September) 💸
Global slowdown fears 🌎 (Europe + Asia weak data)
Geopolitical risks (Russia-Ukraine) limited impact 🚨
🏁 Overall Market Outlook: Bearish (Short Bias) 🐻
Declining prices + rising inventories + OPEC+ supply hike risk
Technicals = Strong Sell (daily/weekly)
Sentiment favors sellers across the board
🔮 Key Takeaway
WTI/USOIL remains heavy under supply pressure + demand weakness.
Market sentiment is fearful, with both retail & institutions leaning short.
⚡ Keep eyes on U.S. jobs data + OPEC+ decisions for any trend shifts.
📌RELATED PAIRS TO WATCH
BRENT CRUDE ( TVC:UKOIL ): $66.42 (-1.8% daily)
NATURAL GAS ( FX:NGAS ): $2.84 (-0.7% daily)
ENERGY ETFS: XLE, USO, UCO
OANDA:CADJPY : Oil-correlated currency pair
ENERGY STOCKS: NYSE:XOM , NYSE:CVX , NYSE:COP , NYSE:SLB
✨ “If you find value in my analysis, a 👍 and 🚀 boost is much appreciated — it helps me share more setups with the community!”
#USOIL #WTI #CrudeOil #ThiefTrader #EnergyMarkets #Commodities #OPEC #SwingTrade #DayTrade #OilAnalysis

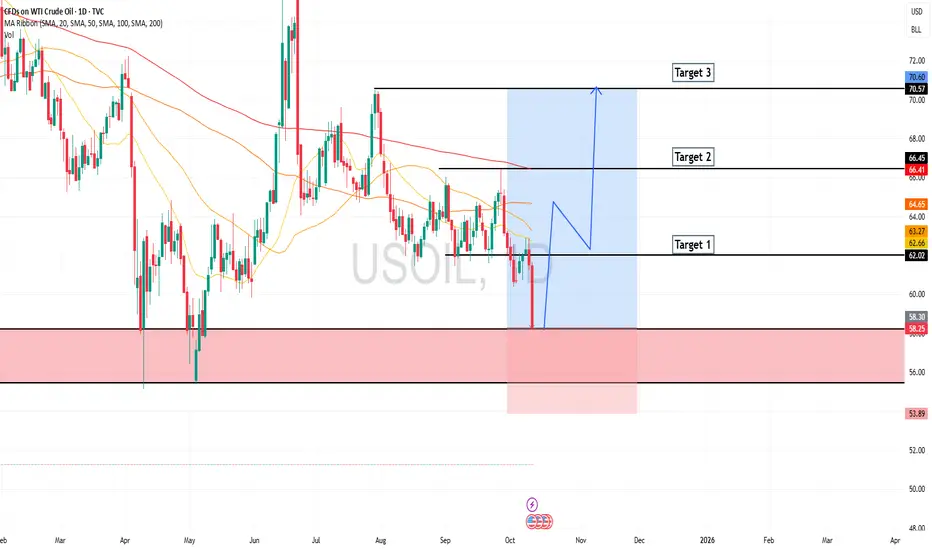
USOIL towardws range 185-250 $Looking at long term chart we can see usoil is competing the descending cycle, 2nd wave (1st corrective) started from 130$ peak.
In my view the bottom could be 50.3$ area where I think bullish trend will resum and wave #3 will start to 1st target 185$ area.
Final targetpoint could be 250$ area

Downtrend in oilThe oil trend is following its exact downward path, as in the previous analysis, and we can expect to buy within these 3 ranges with consolidation.

The US-Oil will jump from the historic Support LevelHello Traders
In This Chart US-OIL HOURLY Forex Forecast By FOREX PLANET
today US-OIL analysis 👆
🟢This Chart includes_ (US-OIL market update)
🟢What is The Next Opportunity on US-OIL Market
🟢how to Enter to the Valid Entry With Assurance Profit
This CHART is For Trader's that Want to Improve Their Technical Analysis Skills and Their Trading By Understanding How To Analyze The Market Using Multiple Timeframes and Understanding The Bigger Picture on the Charts
US OILHI GUYS,
CORRECTION ON US OIL TECHNICAL AND PRICE PATTERNS ON THE ON GOING DOWNTREND
Earlier last week i posted a possible buy and i said it was manipulation . after a few hours of technical i have noticed that i was wrong however the buys were not wrong.
This is the most accurate path and price patterns to happen. lets trade with ease, I expect buys on Monday morning
US OILHI GUYS
A review of down.ward trend to DAILY RT STRUCTURE.
AS U CAN SEE SELLS ARE STILL GOING ON

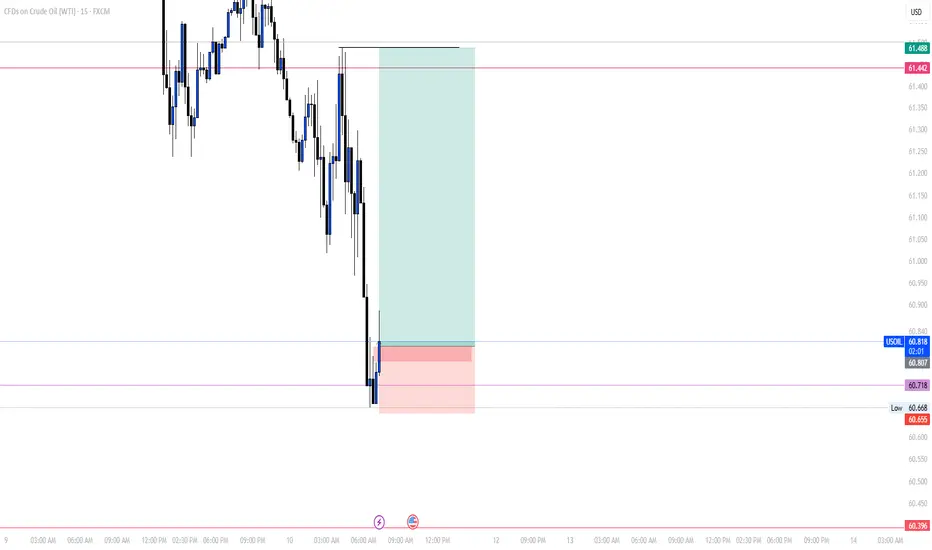
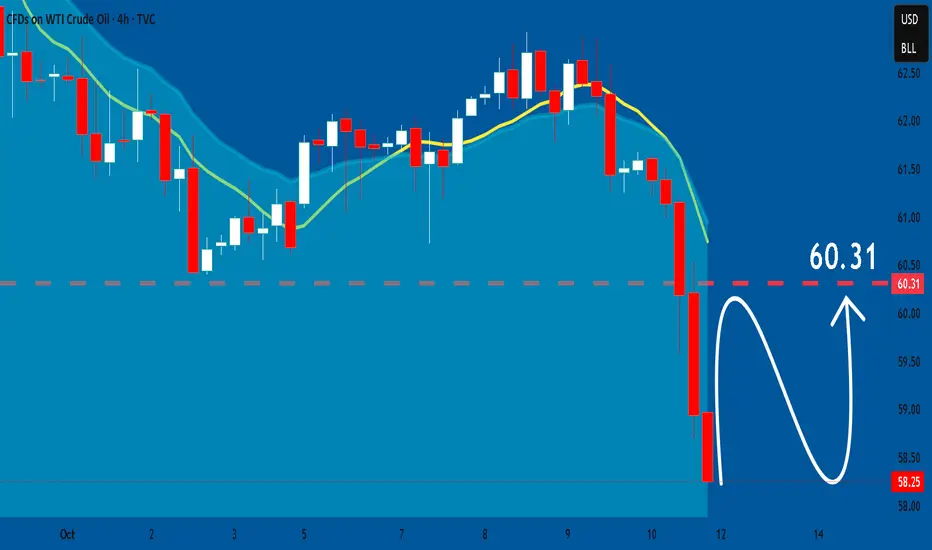
USOIL LONG FROM SUPPORT
USOIL SIGNAL
Trade Direction: long
Entry Level: 58.26
Target Level: 60.45
Stop Loss: 56.80
RISK PROFILE
Risk level: medium
Suggested risk: 1%
Timeframe: 1h
Disclosure: I am part of Trade Nation's Influencer program and receive a monthly fee for using their TradingView charts in my analysis.
✅LIKE AND COMMENT MY IDEAS✅

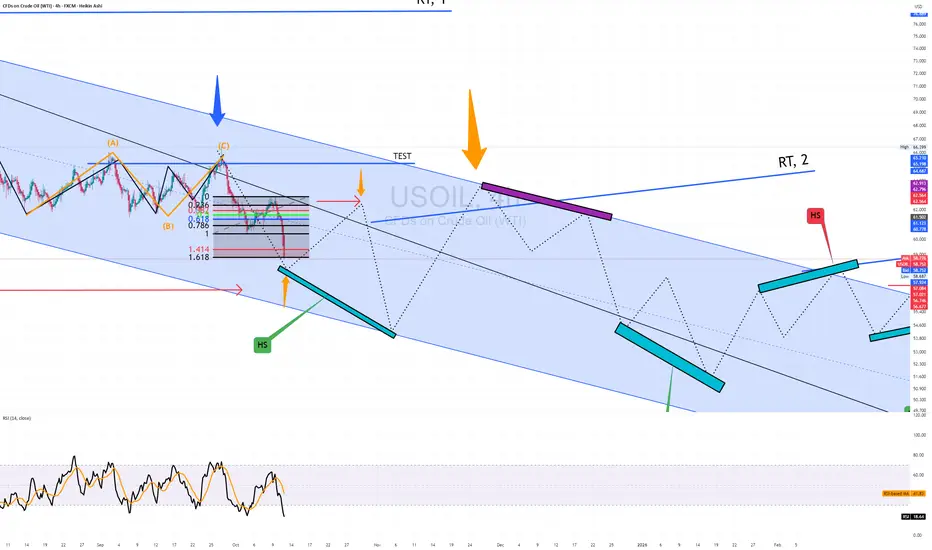
WTI 4H🔹 Overall Outlook and Potential Price Movements
In the charts above, we have outlined the overall outlook and possible price movement paths.
As shown, each analysis highlights a key support or resistance zone near the current market price. The market’s reaction to these zones — whether a breakout or rejection — will likely determine the next direction of the price toward the specified levels.
⚠️ Important Note:
The purpose of these trading perspectives is to identify key upcoming price levels and assess potential market reactions. The provided analyses are not trading signals in any way.
✅ Recommendation for Use:
To make effective use of these analyses, it is advised to manually draw the marked zones on your chart. Then, on the 5-minute time frame, monitor the candlestick behavior and look for valid entry triggers before making any trading decisions.

USOIL: Bullish Forecast & Outlook
The analysis of the USOIL chart clearly shows us that the pair is finally about to go up due to the rising pressure from the buyers.
❤️ Please, support our work with like & comment! ❤️
USOIL: Target Is Down! Short!
My dear friends,
Today we will analyse USOIL together☺️
The in-trend continuation seems likely as the current long-term trend appears to be strong, and price is holding below a key level of 58.752 So a bearish continuation seems plausible, targeting the next low. We should enter on confirmation, and place a stop-loss beyond the recent swing level.
❤️Sending you lots of Love and Hugs❤️
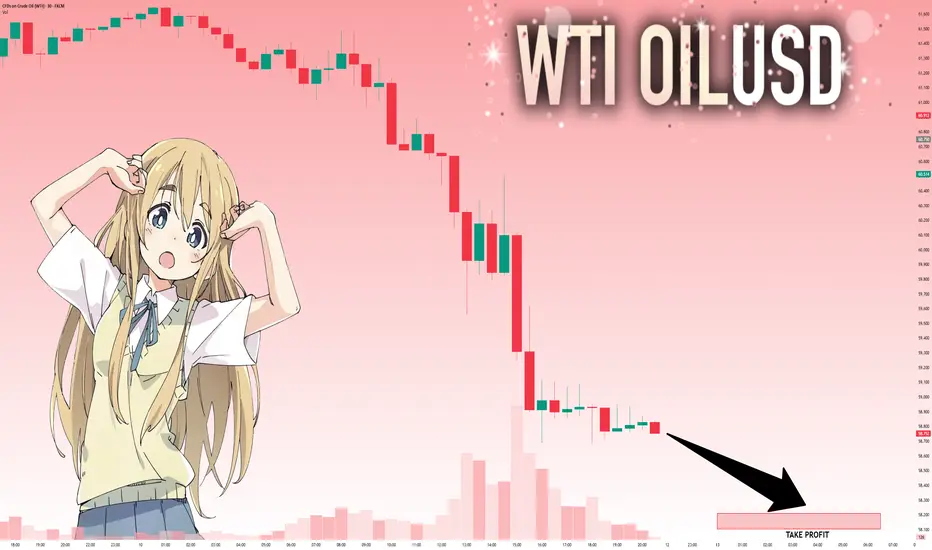
WTI with bearish momentum dominatingDue to a larger-than-expected increase in crude oil inventories, WTI prices fell. From the daily chart perspective, oil prices have broken below the lower edge of the trading range, and the medium-term objective trend is downward. Currently, oil prices are fluctuating near the lower edge of this range. The fast and slow lines of the MACD indicator are below the zero line, with bearish momentum dominating. It is expected that the probability of oil prices moving in an oscillating downward pattern in the medium term is relatively high.
Sell 60 - 60.2 TP 59 - 59.5 SL 60.5
Daily-updated accurate signals are at your disposal. If you run into any problems while trading, these signals serve as a reliable reference—don’t hesitate to use them! I truly hope they bring you significant assistance

US Oil wolfwaveMy idea us oil wolfwave pattren use small trade with SL big profit
If hit SL buy again trend line up side break same SL
US OILHI GUYS
US OIL has a manipulation around area of interest. as soon as it hit 6am to 11am london session people were liquidated. i mentioned this on the btc usd chart. idea.
HS area is mostly manipulated . always wait for a candle close for entries. we are still in london session so buys are now. there is divergence on rsi and a price pattern in min chart

WTI Crude Oil (USOIL) Technical analysisWTI Crude Oil has now broken below the 59.869 support zone, extending the bearish trend that started after the rejection from the 64.576 area. The breakdown signals strong selling momentum, with the next major support zone now seen around 58.000, followed by 55.451 if weakness persists.
Support at: 58.000 / 55.451 🔽
Resistance at: 59.869 / 61.717 / 63.090 🔼
🔎 Bias:
🔼 Bullish: A strong daily close back above 59.869 could indicate a false breakdown and open a retracement toward 61.717.
🔽 Bearish: Sustained trading below 59.869 keeps downside pressure intact toward 58.000 and possibly 55.451.
📛 Disclaimer: This is not financial advice. Trade at your own risk.

Oil Crash | $33Price action making another leg down after retesting the breakout ~($68) from the descending triangle
Would like to see a move to $56 then another retest towards the breakout before any major selling.
Overall target for long term swing $33.

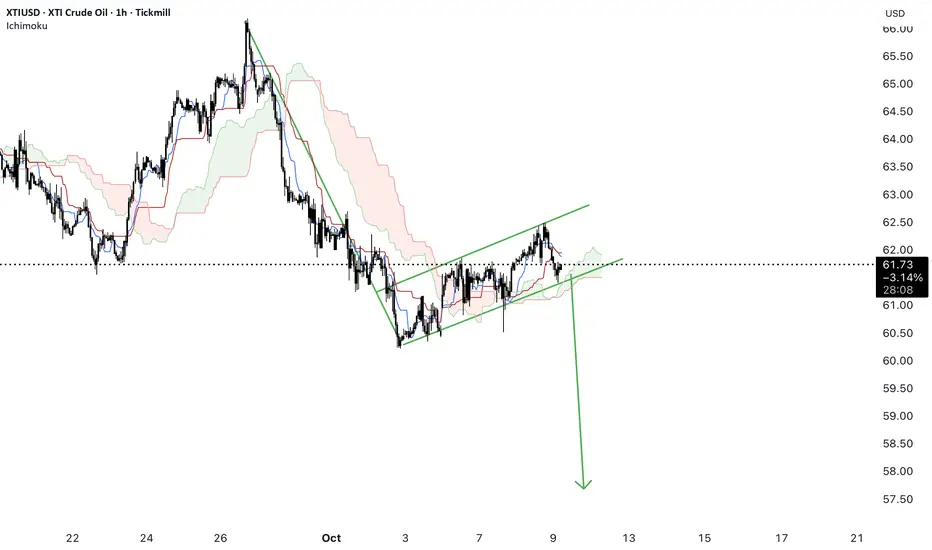
USOIL formed descending flag pattern short ? Act accordinglyUSOil has formed descending flag pattern and price may go down to say around 56 incase of breakdown of support.
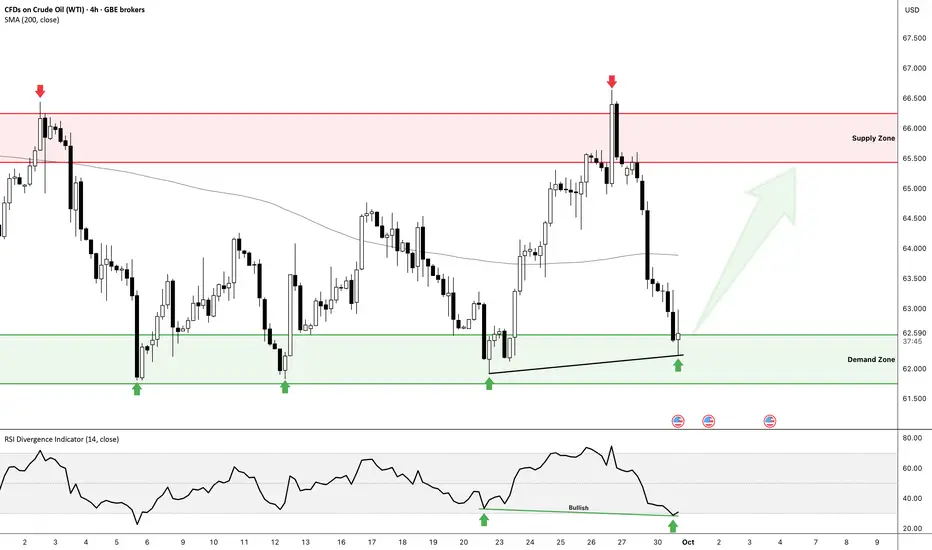
OIL Set for another bounce - 65 Target in Play📊 NFX GBEBROKERS:USOIL Chart Update
Fresh setup spotted:
Price tapped into demand zone and bounced cleanly.
Bullish RSI divergence confirmed → momentum shift to the upside.
Eyeing the supply zone above as the next key test.
🎯 Bias:
As long as demand holds, I’m favoring longs into supply.
Break below demand = setup invalidated.
Stay disciplined - this is a textbook demand-to-supply play.
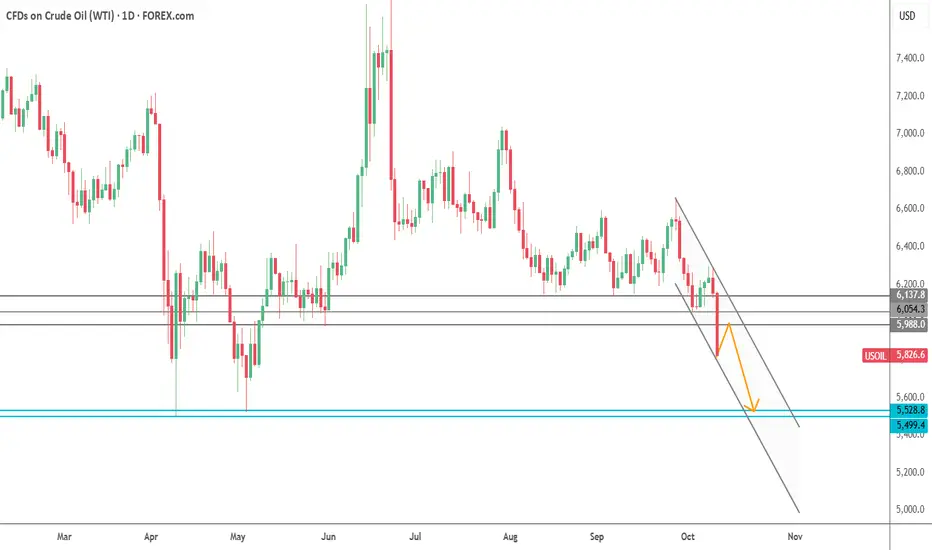
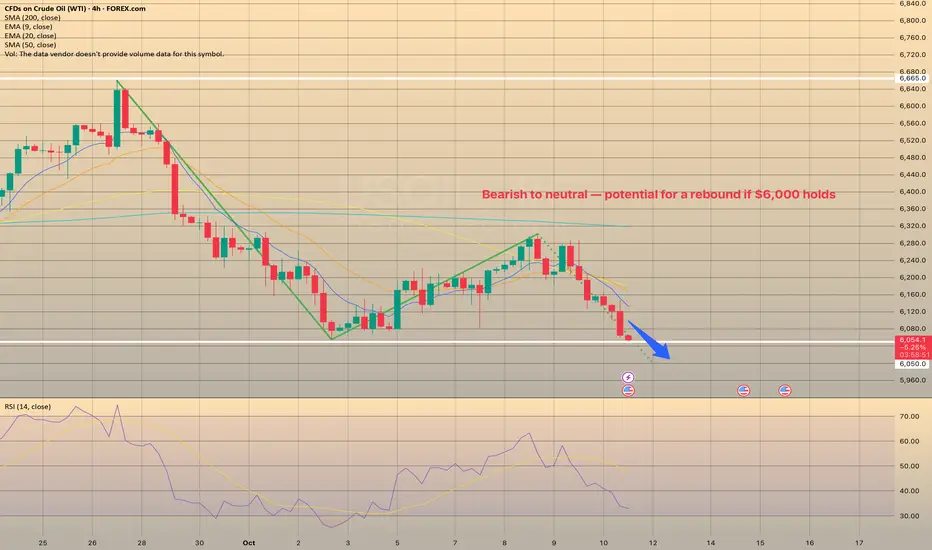
Oil Market: Bearish to neutral — potential for a rebound if $6,0Oil Market: Bearish to neutral — potential for a rebound if $6,000 holds
Crude and gasoline prices fell on Oct. 9 as market sentiment shifted amid rising supply expectations.
OPEC+ agreed to raise output by 137,000 bpd starting November, well below expectations of a 500,000 bpd hike. The group continues to unwind earlier cuts, aiming to restore 1.66 million bpd of production by year-end. OPEC’s September output rose 400,000 bpd to 29.05 million bpd, a 2.5-year high.
On Oct. 10 supply concerns eased after Israel accepted a U.S.-brokered cease-fire deal in Gaza, reducing geopolitical risk premiums. Still, new U.S. sanctions on Iran—targeting over 50 entities linked to oil and LPG trade—helped limit further losses.
Russian supply disruptions remain a supportive factor after drone attacks forced shutdowns at key refineries, while floating storage volumes fell 7% week-on-week to 82.8 million barrels, signaling tighter near-term supply.
Meanwhile, Iraq’s plan to resume Kurdish exports (up to 500,000 bpd) could weigh on prices, offsetting some of the geopolitical support.
EIA data showed U.S. crude inventories 4.5% below the 5-year average, with production up 0.9% w/w to 13.63 million bpd, near record highs. Active U.S. oil rigs slipped by two to 422, just above the four-year low.
Outlook:
Crude oil continues to display a bearish short-term structure, extending its recent downtrend after failing to sustain above the $6,300–$6,350 resistance zone. The price has now revisited the local support area around $6,050–$6,000, which has acted as a key pivot level in recent sessions.
ANZ Research expects near-term downside risks amid higher OPEC+ supply and weaker refinery demand, though low stockpiles outside China may cushion prices into 2026.
A clean rebound from $6,000 could trigger a short-covering move toward $6,200–$6,300.
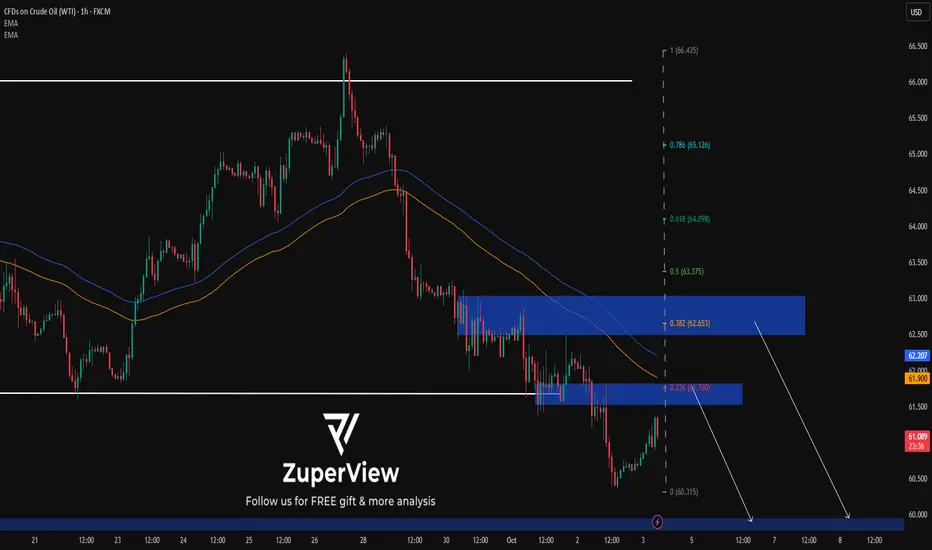
USOIL: Price breaks out of sideways – sell on pullbackTo better understand my current outlook on USOIL, please refer to my previous higher-timeframe and fundamental analyses.
This could be a position trade in anticipation of a larger downtrend on the daily timeframe, but there's risk involved due to the upcoming Non-Farm Payrolls (NFP) report this Friday.
* Trend: assessed using at least three trend indicators, with market structure as the primary guide.
** Weak or Reversal Signals: Assessed based on one of our criteria for trend reversal signals.
*** Support/Resistance: Selected from multiple factors – static (Swing High, Swing Low, etc.), dynamic (EMA, MA, etc.), psychological (Fibonacci, RSI, etc.) – and determined based on the trader’s discretion.
**** Our advice takes into account all factors, including both fundamental and technical analysis. It is not intended as a profit target. We hope it can serve as a reference to help you trade more effectively. This advice is for informational purposes only and we assume no responsibility for any trading results based on it.
Please like and comment below to support our traders. Your reactions will motivate us to do more analysis in the future 🙏✨
George Vann @ ZuperView
CRUDE OIL REBOUND AHEAD|LONG|
✅WTI OIL has tapped into the demand level after a sharp decline, showing signs of accumulation. A reaction from this discount area could drive price higher toward 61.10$, where liquidity above minor highs is resting. Time Frame 2H.
LONG🚀
✅Like and subscribe to never miss a new idea!✅

BUY USOILOur trade today on USOIL is bullish, you can buy following the same levles as mine.
We bought after that the market did a liquidity sweep and gave us a reversal.
Follow for more!