Next week's crude oil trading strategyFundamentals: Inventory liquidation continues + OPEC + production increase debate, support margin strengthens
1.Inventory data remains positive, demand resilience verified
The latest EIA data shows that U.S. crude oil inventories have continued to deplete unexpectedly for two consecutive weeks, gasoline inventories have recorded the largest decline in the past 5 years on a year-on-year basis, and the inventories of the three major oil products are all below the 5-year average by 10%-15%, significantly easing the inventory pressure. Although inventories in the Cushing region have slightly increased, the overall de-accumulation trend has not changed. In addition, China's petrochemical plants' purchase volume in November is expected to increase by 5%-8% compared with the previous month, and terminal demand provides rigid support for oil prices.
1.OPEC + production increase debate intensifies, supply constraint not eased
OPEC + has obvious differences in the pace of production increase: Saudi Arabia hopes to expand production to regain market share, while Russia advocates maintaining a moderate increase of 137,000 barrels per day to avoid supply过剩 suppressing oil prices. The fulfillment rate of production increase in November was less than 60%, and the UAE has a 9.500 barrels per day gap due to oilfield maintenance, and Russia has not fully released idle production capacity. In addition, Saudi Arabia's "voluntary reduction of 1 million barrels per day" policy continues until the end of 2025, the supply side's protection for oil prices exceeds market expectations. Institutions predict that this week, OPEC + may maintain a small increase in production or suspend the increase, further limiting the supply increase.
1.Refinery profit supports processing demand
Although the diesel crack spread in the New York port has declined, it is still 40% higher than the same period in 2024, and the gasoline crack spread remains at a high level, supporting the stable operation of U.S. refineries at 87.2% and the daily crude oil processing volume at 17.3 million barrels, providing stable support for procurement demand.
Next week's crude oil trading strategy
buy:60-60.5
tp:61.5-62
sl:59
Trade ideas

US OILHI GUYS,
US OIL , we are still selling on weekly chart to area of interest as we expect RT DAILY SOON.

USOIL BEARS WILL DOMINATE THE MARKET|SHORT
USOIL SIGNAL
Trade Direction: short
Entry Level: 60.87
Target Level: 55.71
Stop Loss: 64.31
RISK PROFILE
Risk level: medium
Suggested risk: 1%
Timeframe: 1D
Disclosure: I am part of Trade Nation's Influencer program and receive a monthly fee for using their TradingView charts in my analysis.
✅LIKE AND COMMENT MY IDEAS✅

USOIL H4 | Bearish Drop OffUSOIL is reacting off the sell entry, which is a pullback resitance that aligns with the 38.2% Fibonacci retracement and could drop from this level to the downside.
Sell entry is at 60.77, whichis a pullback resistance that lines up with the 38.2% Fibonacci retracement.
Stop loss is at 62.09, which is a swing high resistance that lines up with he 78.6% Fibonacci retracement.
Take profit is at 58.74, which is a pullback support that aligns with the 61.8% Fibonacci retracement.
Stratos Markets Limited (tradu.com ):
CFDs are complex instruments and come with a high risk of losing money rapidly due to leverage. 68% of retail investor accounts lose money when trading CFDs with this provider. You should consider whether you understand how CFDs work and whether you can afford to take the high risk of losing your money.
Stratos Europe Ltd (tradu.com ):
CFDs are complex instruments and come with a high risk of losing money rapidly due to leverage. 70% of retail investor accounts lose money when trading CFDs with this provider. You should consider whether you understand how CFDs work and whether you can afford to take the high risk of losing your money.

Crude Oil Long Idea (WTI, 15m)After an extended correction, WTI has reached the lower boundary of the ascending channel, where buying volume spikes are appearing. The market is testing support near $60.70–$60.50, aligning with the median line structure from previous swings.
A potential reversal setup may form if price holds above this zone and reclaims $61.20.
The first bullish target lies near $62.30–$62.60, followed by the upper channel resistance around $63.50.
Bias: short-term long within the broader bullish channel; invalidation if candle closes below $60.00.
In essence — buying oil at the lower edge of the channel, expecting a rebound toward midline resistance.

USOIL Double Top at Support Level Turned Resistance Zone.Price bounce back from a major Monthly support Level at (58.450 - 55.130), price rallied strongly to the next support level turned resistance at (62.550 - 61.835) and was strongly rejected with a double top followed by bearish engulfing candle presenting a good follow through selling the coming week.
WTI OIL Strong long-term rebound incoming.Over a month ago (September 17, see chart below), we gave a strong Sell Signal on WTI Oil (USOIL) as the price was again rejected on its 1W MA50 (blue trend-line) and was headed towards the inner Higher Lows trend-line, easily hitting our $59.50 Target in the process:
Yet again we consult the more reliable long-term time-frames, now making a bullish call as the price is already rebounding this week on the Higher Lows. Given also the identical 1W RSI pattern with 2023, we expect a bounce towards at least the 0.618 Fibonacci retracement level at $69.50, same as the December 2023 - March 2024 rally.
-------------------------------------------------------------------------------
** Please LIKE 👍, FOLLOW ✅, SHARE 🙌 and COMMENT ✍ if you enjoy this idea! Also share your ideas and charts in the comments section below! This is best way to keep it relevant, support us, keep the content here free and allow the idea to reach as many people as possible. **
-------------------------------------------------------------------------------
💸💸💸💸💸💸
👇 👇 👇 👇 👇 👇

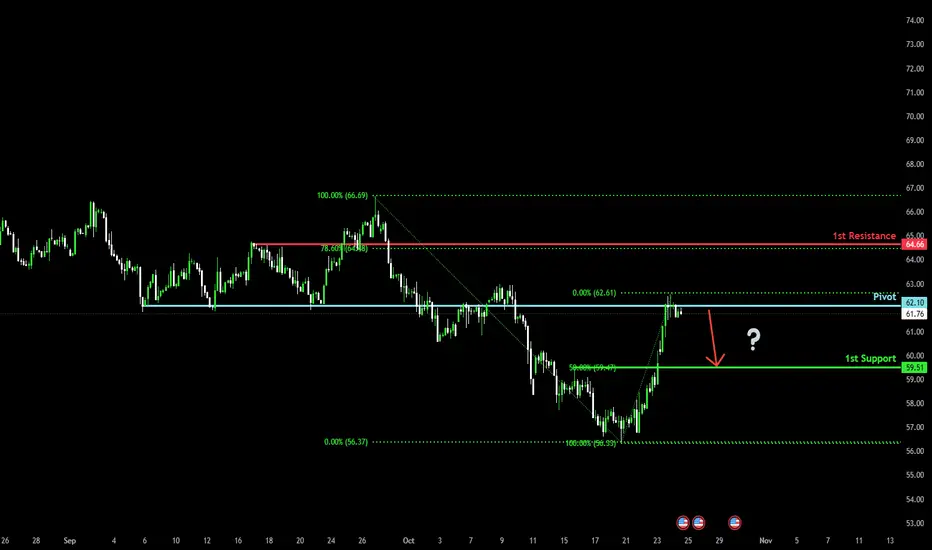
Bearish reversal off overlap resistance?WTI Oil (XTI/USD) is reacting off the pivot whic acts as an overlap resistance and could drop to the 50% Fibonacci support.
Pivot: 62.10
1st Support: 59.51
1st Resistance: 64.66
Disclaimer:
The above opinions given constitute general market commentary, and do not constitute the opinion or advice of IC Markets or any form of personal or investment advice.
Any opinions, news, research, analyses, prices, other information, or links to third-party sites contained on this website are provided on an "as-is" basis, are intended only to be informative, is not an advice nor a recommendation, nor research, or a record of our trading prices, or an offer of, or solicitation for a transaction in any financial instrument and thus should not be treated as such. The information provided does not involve any specific investment objectives, financial situation and needs of any specific person who may receive it. Please be aware, that past performance is not a reliable indicator of future performance and/or results. Past Performance or Forward-looking scenarios based upon the reasonable beliefs of the third-party provider are not a guarantee of future performance. Actual results may differ materially from those anticipated in forward-looking or past performance statements. IC Markets makes no representation or warranty and assumes no liability as to the accuracy or completeness of the information provided, nor any loss arising from any investment based on a recommendation, forecast or any information supplied by any third-party.
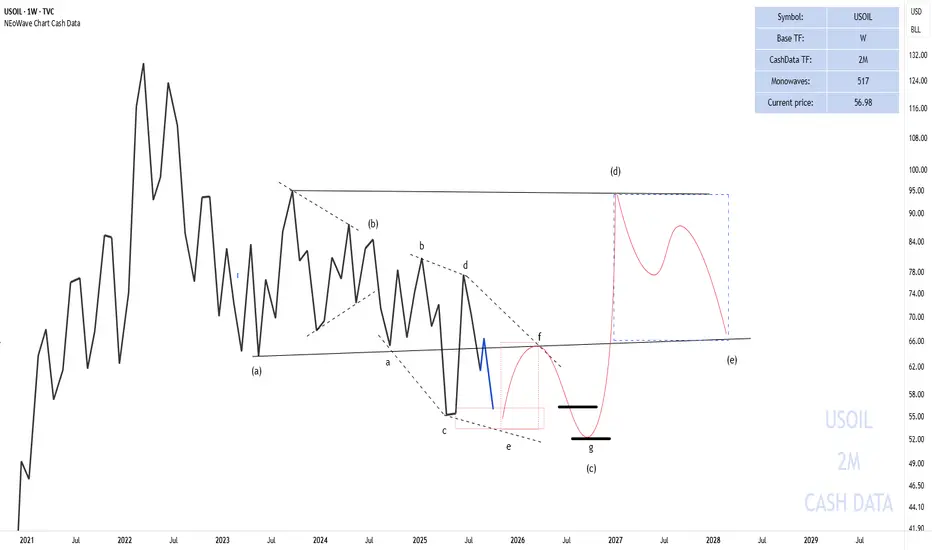
USOIL based on NEoWaveThere has been a lot of demand for oil analysis.
In the 2-month cash data, we see that oil reached $56, and many say there’s a possibility that oil may not touch the high levels above $70 again, but the chart suggests otherwise.
In the 2-month cash data, given the complexity in wave-(c), it appears that a reverse contracting triangle pattern is forming. After the completion of wave-(c), wave-(d) of this triangle could potentially rise to $90.
Currently, we are in wave-(c) of this triangle, which is transforming into a diamond diametric pattern. Wave g of this diametric could end at $56 or in the $50-52 range, completing wave-(c).
The chart will be updated if needed.
Good luck
NEoWave Chart
USOIL SENDS CLEAR BEARISH SIGNALS|SHORT
USOIL SIGNAL
Trade Direction: short
Entry Level: 61.42
Target Level: 58.17
Stop Loss: 63.58
RISK PROFILE
Risk level: medium
Suggested risk: 1%
Timeframe: 6h
Disclosure: I am part of Trade Nation's Influencer program and receive a monthly fee for using their TradingView charts in my analysis.
✅LIKE AND COMMENT MY IDEAS✅

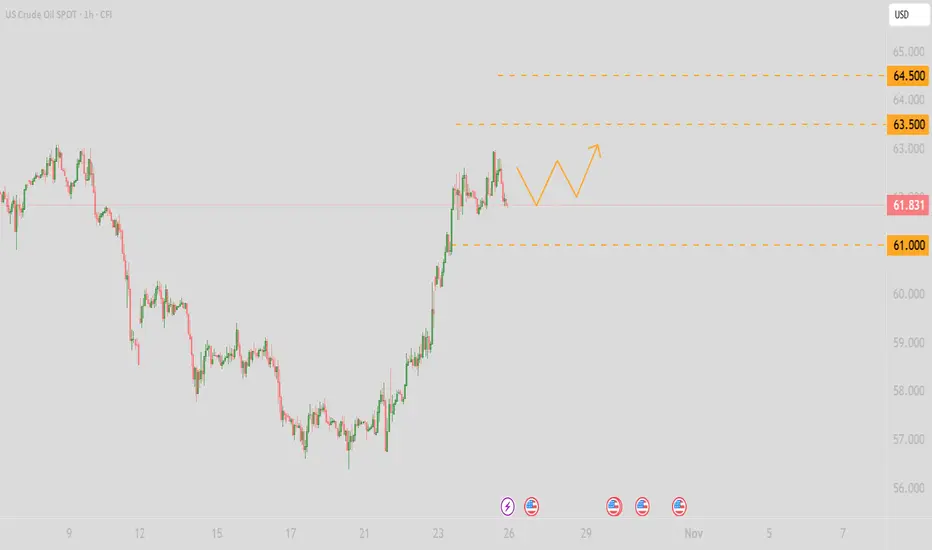
USOIL Crudeoil bullish forecast down trend breakdout🚨 USOIL (Crude Oil) Technical Update 🚨
🕒 Timeframe: 1H
📉 After a clear downtrend breakout, price has shown a strong bullish consolidation breakout from the key support zone at $60.700.
🔥 Momentum is shifting bullish, signaling potential continuation to the upside.
🎯 Technical Targets:
$61.300 — Initial resistance / short-term target
$62.000 — Mid-term bullish objective
$62.800 — Extended target / next major resistance
📊 Outlook:
As long as price holds above $60.700, buyers remain in control. Watch for sustained volume and candle confirmation for further continuation.
#USOIL #CrudeOil #TechnicalAnalysis #Forex #Commodities #Trading #Breakout #BullishMomentum 💪📈

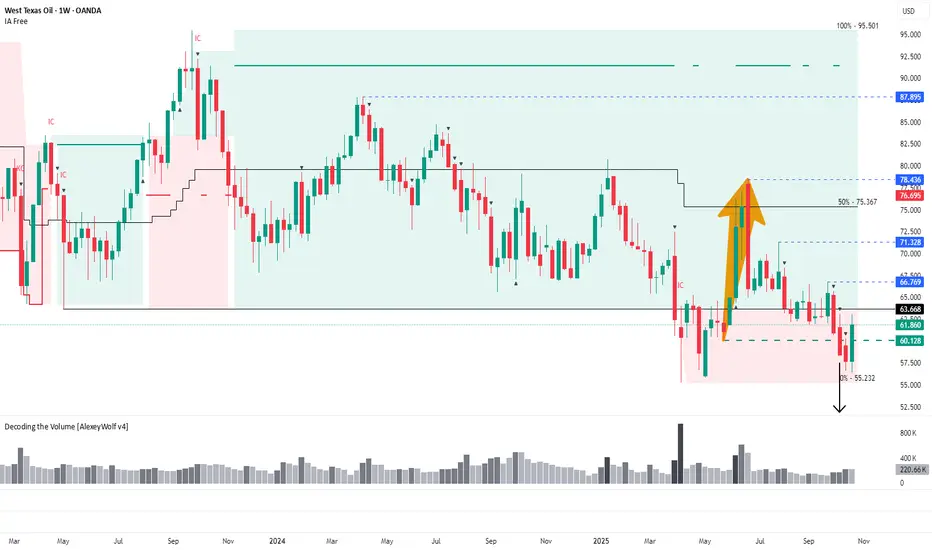
WTI: Possible reversal after false breakout of 60.128Weekly range structure may define oil’s direction for the coming months — buyers defend key support, while targets above 66.769 remain in focus.
Hi traders and investors!
This analysis is based on the Initiative Analysis (IA) concept.
On the weekly timeframe, a sideways range has been in place since April 2023, followed by a transitional phase.
Sellers managed to push the price below the lower boundary of this range — the first breakout occurred in March 2025.
After that, buyers brought the price back inside the range and reached the 50% level of the trading zone, from where sellers resumed control and once again pushed the price below the lower boundary at 63.668.
What’s interesting here is that earlier there was a buyer’s move returning the price into the range, with its base around 60.128.
We now see a seller candle attacking this level on high volume, followed by another seller candle with even higher volume, after which the price returned above 60.128.
This behavior may signal a false breakout (manipulation) of that level.
If this interpretation holds, the next potential upside targets are:
66.769 — first target,
71.328 — second target,
78.436 — third target,
followed by 87.895 and possibly 95.501.
Key points to watch:
whether buyers defend the 60.128 level if the price pulls back,
and whether they manage to break through the range boundary at 63.668, and then 66.769
.
If buyers succeed in holding above these two levels, the buyer’s vector is likely to continue developing toward the mentioned upside targets.
Wishing you profitable trades!
USOIL – Downtrend Still IntactUSOIL remains fundamentally weak with technical confirmation of a prevailing downtrend. Short-term pullbacks are likely corrective and may provide better short-entry setups.
Resistance levels:
59.14
60.36
61.91 (Ultimate)
Support levels:
54.81
53.13
51.95 (Ultimate)

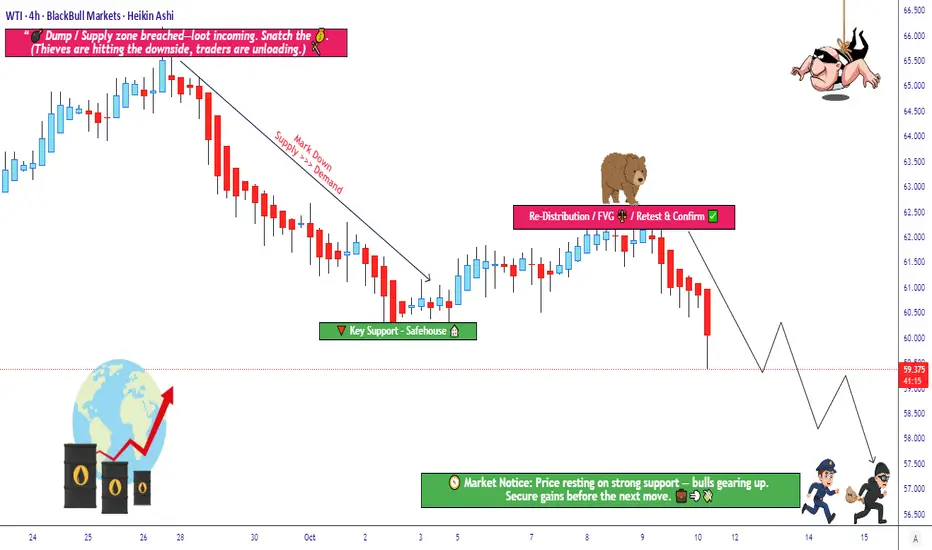
Is Crude Oil Setting Up for a Major Bearish Reversal?🛢️ XTI/USD “WTI” – Bearish Redistribution Zone Incoming (Thief Strategy Inside)
📉 Setup Overview
Market: XTI/USD (WTI crude oil)
Bias: Bearish confirmed — we’re looking for re-distribution / supply pressure to take control
Trade Type: Swing / Day Trade hybrid
🎯 Entry Plan (Thief-Layer Strategy)
I use a layering / multiple limit order approach (aka “Thief Strategy”). You may use any price level as entry, but here’s my preferred ladder:
Sell Limit @ 61.500
Sell Limit @ 61.000
Sell Limit @ 60.500
Sell Limit @ 60.000
Sell Limit @ 59.500
(You may extend more layers if you like)
You don’t need to hit all layers — just get partial fills, ride the move downward.
🚫 Stop Loss
Thief’s SL: 62.500
⚠️ Note to Thief OG’s: I’m not forcing you to follow my SL. You choose what works. Make money, take money — at your own risk.
🎯 Target
We see police barricade as a strong support zone + oversold trap possibility.
So primary target: 57.000
⚠️ Note to Thief OG’s: Don’t blindly hold to my TP. If price gives you your gains early, escape with your money — don’t wait for perfection.
🔍 Related Pairs & Correlations
AMEX:USO or USOIL (oil ETFs / indices) – real-world crude correlation
$BRENT/USD – watch for strength or weakness divergence
AMEX:XOP / AMEX:OIH (oil & gas sector indices) – sentiment in energy names
Key point: if Brent weakens while WTI breaks down, it reinforces the bias.
📌 Key Technical Notes
We’re waiting for ** redistribution / supply zone** to hold — a retest or failure bounce is ideal setup.
Oversold conditions + a “trap” candle (fake breakout) strengthen the move.
Use layering to average in, not “all-in” at once.
Be ready for whipsaws around support zones; partial exits can help.
✨ “If you find value in my analysis, a 👍 and 🚀 boost is much appreciated — it helps me share more setups with the community!”
Disclaimer: This is Thief-style trading strategy just for fun. I am not giving financial advice. Trade at your own decision and risk.
#WTI #CrudeOil #XTIUSD #EnergyTrading #OilStrategy #Layering #SwingTrade #DayTrade #BearishBias #ThiefStrategy
Bearish reversal off major resistance?WTI Oil (XTI/USD) is rising towards the pivot, which is an overlap resistance and could reverse to the 1st support.
Pivot: 62.10
1st Support: 58.37
1st Resistance: 64.66
Disclaimer:
The above opinions given constitute general market commentary, and do not constitute the opinion or advice of IC Markets or any form of personal or investment advice.
Any opinions, news, research, analyses, prices, other information, or links to third-party sites contained on this website are provided on an "as-is" basis, are intended only to be informative, is not an advice nor a recommendation, nor research, or a record of our trading prices, or an offer of, or solicitation for a transaction in any financial instrument and thus should not be treated as such. The information provided does not involve any specific investment objectives, financial situation and needs of any specific person who may receive it. Please be aware, that past performance is not a reliable indicator of future performance and/or results. Past Performance or Forward-looking scenarios based upon the reasonable beliefs of the third-party provider are not a guarantee of future performance. Actual results may differ materially from those anticipated in forward-looking or past performance statements. IC Markets makes no representation or warranty and assumes no liability as to the accuracy or completeness of the information provided, nor any loss arising from any investment based on a recommendation, forecast or any information supplied by any third-party.

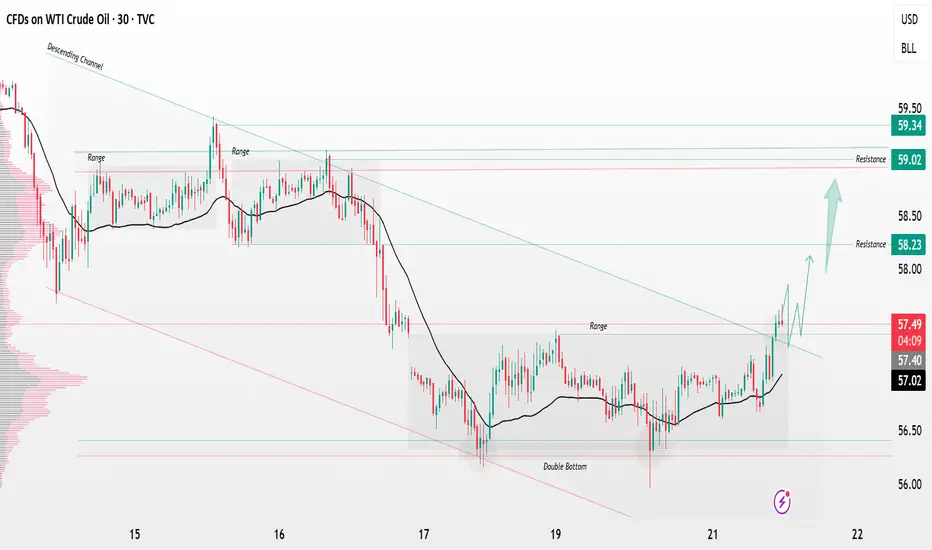
USOIL breakout from consolidation zone big breaking📊 USOIL (WTI Crude Oil) Technical Update 🛢️
USOIL has confirmed a descending channel breakout followed by a range consolidation breakout — showing strong bullish momentum on the 30-minute timeframe. 🔥
📈 Breakout Level: 57.60
🎯 Technical Targets:
1️⃣ First Target – 58.20
2️⃣ Second Target – 59.00
As long as price holds above 57.60, the bullish bias remains intact. ⚡
#USOIL #WTI #CrudeOil #PriceAction #TechnicalAnalysis #BreakoutTrading
Review of USOIL's Performance This Week📝This week, the USOil market exhibited a highly volatile pattern of "first bottoming out and stabilizing, then rebounding driven by geopolitical factors". The competition between supply-demand fundamentals and sudden geopolitical events dominated the market trend throughout the week. Details are as follows:
💡Price Movement: From Approaching Annual Lows to Intraday Surges, Volatility Within Ranges Intensifies
1. Bottoming Out Early in the Week
On Monday, USOil continued its weak oscillation. It opened at $57.32 per barrel, dipped to a low of around $56 per barrel (approaching the 2025 annual low of $55.12), and finally closed at $56.93 per barrel, down $0.61 from the previous trading day.
From Tuesday to Wednesday, as panic eased, prices gradually stabilized and rebounded. It closed at $57.58 per barrel on Tuesday; on Wednesday, boosted by geopolitical expectations, it surged by $3.25 in a single day to close at $61.75 per barrel, with trading volume rising to 711,600 lots.
2. Rebounding and Then Retreating in the Latter Half of the Week
On Thursday, the official release of detailed EU and U.S. sanctions on Russian energy triggered a strong market reaction. USOil opened at $59.94 per barrel and then jumped, peaking at $62.59 per barrel with an intraday gain of nearly 5%, before closing at $61.44 per barrel.
On Friday, after the earlier rebound, prices entered a consolidation phase, fluctuating narrowly around $62. For the whole week, it rebounded by over 10% from the previous week’s low.
💡Core Influencing Factors:
1. Bearish Drivers: Sustained Supply-Demand Easing Suppresses Oil Prices
✔Worsening Supply Glut
✔Weak Demand Weighs on Prices
2. Bullish Disturbances: Geopolitical Sanctions Trigger a Phased Rebo
💡Technicals and Market Sentiment: Recovery After Oversold Conditions, Persistent Long-Short Divisions
1. Divergent Signals from Technical Indicators
2. Intense Battles Around Key Levels
The support at the annual low of $55.12 proved effective, serving as the starting point for the week’s bottoming and rebound. The resistance levels at $58 and $62 were breached one after another, but the resistance from the $63 level and the 70-dollar trend line still posed long-term pressure. A breakthrough would require sustained improvement in fundamental
💡Outlook: Short-Term Oscillations Unlikely to Reverse Long-Term Weak Trend
💎Short-Term Perspective: Geopolitical risk premiums and technical recovery after oversold conditions may support oil prices to fluctuate within the $58-$63 range. If the supply gap caused by sanctions continues to widen, it may test the resistance level of $66.
💎Long-Term Perspective: The IEA predicts that Brent crude oil prices will range between $52-$60 in 2026. Core contradictions such as loose supply-demand, accelerated energy transition, and approaching demand peaks remain unresolved. If the support at $55 is broken, it may fall to the deep correction range of $49 or even $37.
The market should focus on whether OPEC+ will adjust its production increase plan at the November 2 meeting and the impact of global manufacturing PMI data on demand expectations.
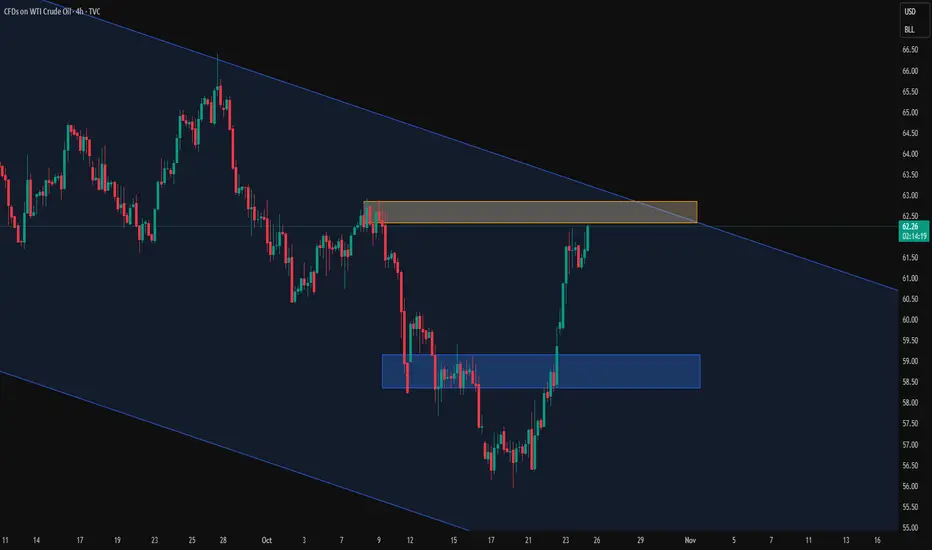
USOIL – Short Setup Forming at 4H Supply ZoneAfter a strong bullish recovery from the $56.00 demand zone, WTI Crude Oil has now reached a key 4H supply area (61.80–62.60).
This zone aligns with previous structural resistance and an unmitigated imbalance, making it a potential reversal point.
The recent impulsive rally could now face profit-taking or seller re-entry, especially after such a sharp single-leg move.
📉 Technical Breakdown
Supply Zone: 61.80–62.60, aligning with a previous major breakdown area.
Liquidity Context: Price may have swept buy-side liquidity above short-term highs to fill the imbalance and tap into supply.
Momentum Shift: Bullish momentum appears to be slowing; watch for bearish rejection candles or break of minor structure to confirm entry.
Market Structure: The overall 4H structure remains bearish, so this move could be a retracement leg within a broader downtrend.
💡 Trade Plan
Entry Zone: 61.80 – 62.50 (inside 4H supply area)
Stop-Loss: Above 62.60 (structure invalidation)
Take-Profit Targets:
🎯 TP1: 59.00 (intraday support)
🎯 TP2: 56.00 (major demand zone)
🧠 Bias & Outlook
Bearish short-term, expecting rejection from 4H supply and potential continuation to the downside.
A clean break and close above 62.60 would invalidate this setup and suggest further bullish continuation.
🧩 Summary
WTI is testing a high-probability supply zone after an extended bullish impulse.
Signs of exhaustion and liquidity sweep hint at a potential short opportunity targeting 59.00–56.00.
Waiting for confirmation before entry provides the safest positioning.
Disclaimer:
This analysis is for educational purposes only — not financial advice. Trade at your own risk and confirm setups with your personal strategy.

USOIL: Waiting for price to react to 4h resistance
* Trend: assessed using at least three trend indicators, with market structure as the primary guide.
** Weak or Reversal Signals: Assessed based on one of our criteria for trend reversal signals.
*** Support/Resistance: Selected from multiple factors – static (Swing High, Swing Low, etc.), dynamic (EMA, MA, etc.), psychological (Fibonacci, RSI, etc.) – and determined based on the trader’s discretion.
**** Our advice takes into account all factors, including both fundamental and technical analysis. It is not intended as a profit target. We hope it can serve as a reference to help you trade more effectively. This advice is for informational purposes only and we assume no responsibility for any trading results based on it.
George Vann @ ZuperView
USOIL BULLS ARE STRONG HERE|LONG
USOIL SIGNAL
Trade Direction: short
Entry Level: 57.23
Target Level: 59.72
Stop Loss: 55.57
RISK PROFILE
Risk level: medium
Suggested risk: 1%
Timeframe: 12h
Disclosure: I am part of Trade Nation's Influencer program and receive a monthly fee for using their TradingView charts in my analysis.
✅LIKE AND COMMENT MY IDEAS✅

Today's crude oil trading strategyDon't be intimidated by "mid-term supply pressure", as the risks are manageable when going long.
1. Geopolitical Conflicts "Keep Adding Fuel" – Supply Worries Persist
The U.S. has just escalated sanctions on Russia and imposed restrictions on Venezuela’s crude oil exports, which directly cuts off part of the global supply. For context: When Ukrainian forces attacked Russian ports earlier, Russia’s daily crude exports dropped by 2 million barrels, and oil prices jumped 3% in a single day. Now, sanctions like these will only make the market more anxious about "insufficient oil supply," which will keep prices supported in the short term.
2. Inventory Data Offers "Genuine" Positives – Demand Provides a Safety Net
U.S. crude oil inventories have fallen for two consecutive weeks, with a further drop of 1.8 million barrels in the latest week. This clearly shows "more oil is being used than produced" – the current price gains aren’t unfounded. Additionally, China’s refinery utilization rate has risen from 86% to 88%, and there’s a requirement to ensure refined oil supply in the fourth quarter. This means demand for crude oil will only increase, adding an extra "safety cushion" for long positions.
Crude Oil Trading Strategy for Today
usoil @buy60.80-61.0
tp:61.5-62
sl:60

Today's crude oil strategy, hoping to be helpful to you.Although the current broader context of the international crude oil market is "excess supply and weak demand", from the perspective of short-term and potential opportunities, there are three key points that support us to attempt a long position. We should not be deterred by the broader "weak market" trend:
Potential "Flashpoints" in Geopolitical Conflicts
Ukraine has not stopped using drones to attack Russia's oil facilities, and Russia's oil refining volume has now hit its lowest level in over two years. If key pipelines are attacked next, or if conflicts between Israel and Qatar in the Middle East escalate further, affecting crude oil transportation, the market will definitely rush to buy oil out of panic. In this case, oil prices will most likely surge suddenly. For example, back in June, when Israel launched an air strike on Iran's nuclear facilities, oil prices rose by 6.9% in a single day. We must seize such opportunities.
Possible "Hitches" in OPEC+ Production Increase
Although OPEC+ plans to increase supply by an additional 137,000 barrels per month in October and November, many oil-producing countries actually have little extra oil to produce. As early as May, the actual production increase was more than half lower than the planned amount. If OPEC+ announces "no more production increases" in subsequent meetings, or even resumes production cuts, the pressure from excess supply will be reduced significantly, and oil prices will naturally be able to hold steady or even rise.
Crude Oil Trading Strategy for Today
usoil @buy 57.50-58.00
pt:58.50-59
sl:57

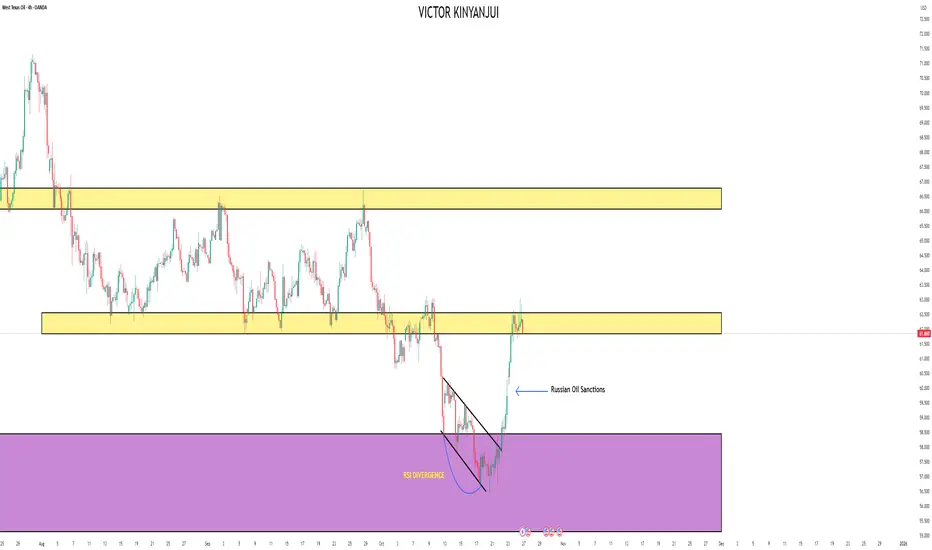
WTI bullish swing setupRSI divergence
Bullish chart pattern
Wait for trend reversal
red line is previous major level
Entry on trend reversal
RRR 1:2
