USOIL Near Final Leg USOIL is forming a clear corrective pattern inside a falling channel. Price is currently in the final leg of wave (5) of (C), suggesting one more dip is likely before reversal.
The downside target lies near 5,000–5,200 , where support from the channel base aligns. Once this level holds, a strong bullish reversal is expected, marking the end of the correction and the start of a new upward trend.
Stay Tuned!
@Money_Dictators :)
Trade ideas

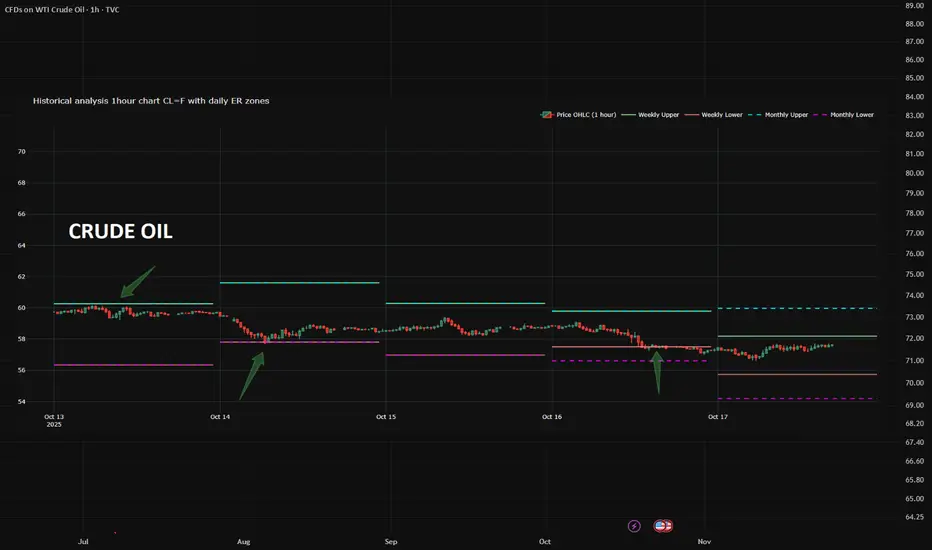
ER: The Hidden Tool 95% of Traders Ignore (But Shouldn’t)What if I told you there’s a free, stats-backed tool that shows you where price is likely to stop or reverse — with 68% confidence?
Meet Expected Range (ER) — not a magic bullet, but a massive edge when used right.
✅ Based on CME data & Nobel-winning math
✅ Defines high-probability support/resistance zones
✅ Free from CME website.
I never trade without checking ER anymore.
It turns noise into structure.
👉 Check the screenshots yourself — see how price reacted at each edge last week.
The only thing you need to do?
→ Grab ER data from the CME website daily
→ Apply a simple conversion formula
→ Plot it on your futures chart
That’s it.
Now you’ve got statistically grounded levels right in front of you.
Depending on your market view, you can:
• Short from the upper ER boundary
• Use it as a trend support entry zone
• Hide stops beyond the range — because price statistically won’t reach them
⚠️ Caveat: ER isn’t a crystal ball.
But in normal markets - ER zones hold ~4 out of 5 times.
Question for you:
Are you using ER? Or still guessing support/resistance?
Transparency first. No hype. Just real results.
WTI Technical Forecast: Critical Juncture at Multi-Month SupportSPOTCRUDE (WTI) Technical Forecast: Critical Juncture at Multi-Month Support
Analysis as of 18th Oct 2025 (Close: 57.715)
Market Context: Crude oil sits at a pivotal technical level. Geopolitical tensions provide a bullish fundamental backdrop, but the technical picture shows a market at a make-or-break support zone.
Multi-Timeframe Analysis (Top-Down View)
Swing Bias (D1/4H): Bearish Below $59.00
The daily chart paints a concerning picture. Price is trapped below all key EMAs (50 & 200), confirming a bearish trend structure. We are testing a major Wyckoff Accumulation Zone and a potential Bearish Bat Harmonic pattern completion near $57.50. The RSI is in bearish territory but approaching oversold, hinting at potential for a relief rally.
Intraday Bias (1H/30M): Neutral to Cautious Bullish
The 4H and 1H charts show consolidation after a sharp decline. The Ichimoku Cloud is thick resistance overhead, while the Anchored VWAP from the recent high confirms strong selling pressure. A break above the $58.20 level is needed to signal any short-term strength.
Key Chart Patterns & Theories in Play
Elliott Wave: The decline from the highs appears to be a clear 5-wave impulse down, suggesting we are completing Wave 5. This often precedes a significant corrective (A-B-C) rally.
Gann Analysis: The Square of 9 identifies $57.50 as a major harmonic support level. A break below targets $56.00 next.
Head and Shoulders? A large-scale pattern on the weekly chart has met its minimum target. The current price action could be the final leg of this move.
Bull Trap Risk: A swift bounce to $58.50-$59.00 that fails could trap eager bulls before the next leg down.
Actionable Trade Setups
🟢 Swing Trade (Counter-Trend Long)
Entry: $57.40 - $57.70 (Confluence with Harmonic & Gann Support)
Stop Loss: $56.90
Take Profit 1: $59.00
Take Profit 2: $60.00
🔴 Swing Trade (Momentum Short)
Trigger: A decisive 4H close below $57.30.
Entry: On retest of $57.50 as resistance.
Stop Loss: $58.10
Take Profit: $56.00
⚫ Intraday Long (Bounce Play)
Trigger: Bullish reversal candle (e.g., Hammer/Bullish Engulfing) on the 1H chart at $57.50 support.
Entry: On trigger candle close.
Stop Loss: $57.20
Take Profit: $58.40
Key Levels
Resistance 3: $60.00 (Psychological / 50 EMA)
Resistance 2: $59.00 (Ichimoku Cloud Base)
Resistance 1: $58.20 - $58.50 (Immediate Supply Zone)
Support 1: $57.50 - $57.70 (CRITICAL SUPPORT)
Support 2: $56.90 (Breakdown Trigger)
Support 3: $56.00 (Next Gann Target)
Conclusion
WTI is at a critical inflection point. The high-probability play is a bounce from the $57.50 support for a swing towards $59.00. However, a break below this level would signal a resumption of the broader downtrend. Trade the breakout/breakdown with clear confirmation.
Risk Warning: Trading crude oil involves high risk due to volatility and leverage. This analysis is for educational purposes and does not constitute financial advice. Always manage your risk and conduct your own due diligence.


Us oil possible Wyckoff accumulation?This count is based on my assumptions so anything can happen not a trading or financial advice just for educational purposes only kindly do your own ta thanks trade with care good luck.

Crude Oil Outlook: Pressure Mounts as 2025 Lows Come Into ViewCrude oil prices are tracing another plunge back to yearly lows amid mounting oversupply, weak demand, and tariff concerns. New 2025 lows may be reached in the short-term horizon, aligning with the lower boundaries of a 3-year down trending channel
From a weekly time frame perspective, crude oil is facing the lower border of a three-year descending channel extending from the 2022 highs. The $55 support currently holds as the 2025 low, but a clean break below it could extend losses toward the $49 zone, aligning with the channel’s bottom boundary — a potential area of support. If this level fails, a deeper selloff could extend toward the $37 region.
On the upside, should prices recover above the $58 mark, a bullish rebound may extend toward $60, $63, and $66, respectively. However, for a sustainable bullish outlook on crude, a breakout above both the three-year downtrend and the $70 resistance is required.
Looking closely at the daily RSI, it is nearing oversold levels last seen in April 2025, suggesting that downside momentum could be approaching exhaustion.
In line with the recent movements of U.S. indices, will we see another dip-and-rebound scenario on crude oil — not identical, but perhaps reminiscent of April 2025?
- Written by Razan Hilal, CMT

WTI crude oil Wave Analysis – 17 October 2025
- WTI crude oil reversed from strong support level 56.00
- Likely to rise to resistance level 58.00
WTI crude oil recently reversed from the support area between the strong support level 56.00 (which reversed the price in April and May, as can be seen below) and the lower daily Bollinger Band.
This support area was further strengthened by the support trendline of the daily down channel from August.
Given the strength of the support level 56.00 and the oversold daily Stochastic, WTI crude oil can be expected to rise to the next resistance level 58.00.

Oil’s Bottom Is on Its Last Breath — A Major Rally Is ImminentPrevious analysis:
Update is on the chart above 👆
The downside we were hunting looks near completion; in time terms, the correction also appears done.
Wave structure points to the end of wave 2 and the start of a powerful wave 3 up. Failed downside breaks and liquidity sweeps of recent lows back this view.
Confluence: demand retest, deep fib retrace (around 78–88%), and weakening seller momentum at the latest lows.
Roadmap: once this phase completes, I’m looking for an impulse toward $110—with momentum building as price reclaims 65 and then 81.
Risk: even if this setup gets stopped, I’ll keep looking for long entries—trend context and timing still favor upside continuation.
Macro angle: a major oil spike is rarely just a chart pattern—it’s a stress signal. What crisis is this foreshadowing? Middle East? Or something broader and global on supply/demand?
If this resonates, save & follow for the next updates. (Not financial advice.)

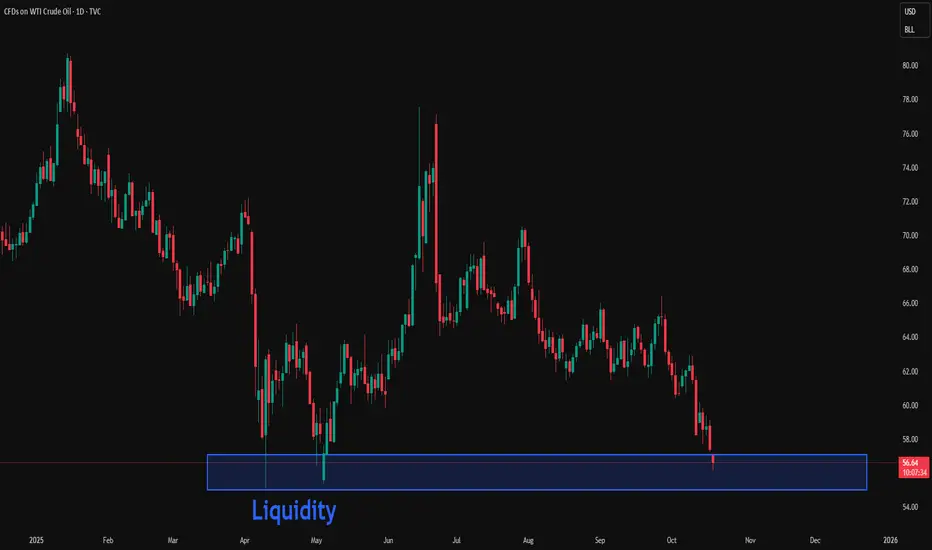
USOIL: Waiting for a liquidity sweep on the Daily timeframeIn my previous analyses on USOIL, including the fundamental outlook, price has been trending lower within a narrow channel between $70 and $50.
I’m looking for a buy opportunity on higher timeframes after a large liquidity sweep.
Weekly Outlook:
* Trend: assessed using at least three trend indicators, with market structure as the primary guide.
** Weak or Reversal Signals: Assessed based on one of our criteria for trend reversal signals.
*** Support/Resistance: Selected from multiple factors – static (Swing High, Swing Low, etc.), dynamic (EMA, MA, etc.), psychological (Fibonacci, RSI, etc.) – and determined based on the trader’s discretion.
**** Our advice takes into account all factors, including both fundamental and technical analysis. It is not intended as a profit target. We hope it can serve as a reference to help you trade more effectively. This advice is for informational purposes only and we assume no responsibility for any trading results based on it.
George Vann @ ZuperView
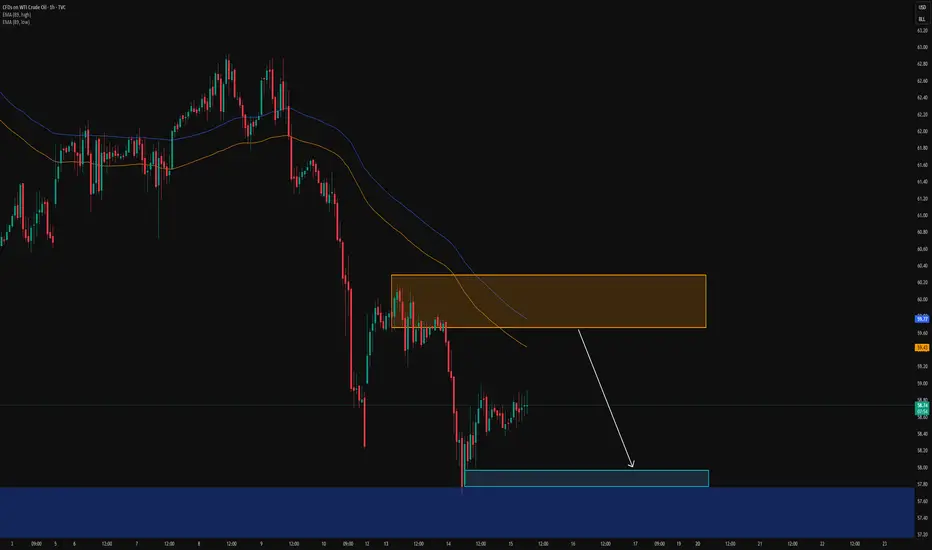
USOIL: Pullback within the correction on the 4h timeframeTo better understand my current outlook on USOIL, please refer to my previous higher-timeframe and fundamental analyses:
* Trend: assessed using at least three trend indicators, with market structure as the primary guide.
** Weak or Reversal Signals: Assessed based on one of our criteria for trend reversal signals.
*** Support/Resistance: Selected from multiple factors – static (Swing High, Swing Low, etc.), dynamic (EMA, MA, etc.), psychological (Fibonacci, RSI, etc.) – and determined based on the trader’s discretion.
**** Our advice takes into account all factors, including both fundamental and technical analysis. It is not intended as a profit target. We hope it can serve as a reference to help you trade more effectively. This advice is for informational purposes only and we assume no responsibility for any trading results based on it.
George Vann @ ZuperView
WTI Crude Oil
As shown in my previous analysis (pinned below this post), we shorted oil from the range high.
Now price has reached the range low, where two key buy levels are marked on the chart ✅.
🔹 If these levels break, the opposite scenario still stands.
🔹 We’re not in OPEC, we don’t make political or war decisions, and we don’t give orders to the market.
🔹 We are traders, simply trying to profit from opportunities.
⚡️ Remember: being biased toward your analysis = blowing up your account and losing confidence.
🎯 Always follow the market, never fight it.

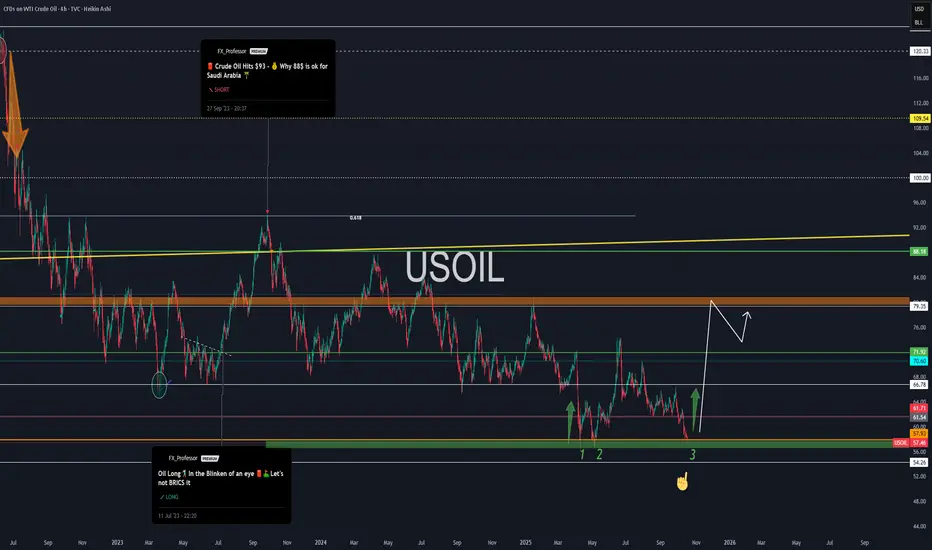
Time to Fill Up Those Tanks — WTI Reversal in PlayTime to Fill Up Those Tanks — USOIL Reversal in Play 🛢️📈
Everyone’s watching tech, AI, Bitcoin, and gold.
But let’s be real: none of that moves without oil.
We all need black energy — whether you call it crude, petroleum, or the global bloodstream of industry. And today, we’re looking at a setup that says:
“It might be time to fill those tanks — literally and financially.”
🔄 From Short to Long — Here's Why
🧠 Back in Sept 2023, I was publicly SHORT from $93 — “Why 88 is OK for Saudi Arabia” . Clean fade.
But now? We’ve hit my 3-touch support zone at ~$57 — and the structure screams reversal.
📌 1… 2… and now 3.
• Triple bottom territory
• RSI divergence
• Crude sentiment at peak despair
• Geopolitical fog + supply cut whispers
This is the part of the cycle where crude likes to rip when nobody’s looking.
🔍 Technical Breakdown
• 🟩 Demand base: $56–57 zone (strong 3-touch support)**
• 🎯 Target: $79.35 (next major resistance zone)**
• 🛑 Invalidation below $54.26 = abort the trade idea
If the reversal starts here, I expect a rally into Q1 2026 — possibly exaggerated by global supply dynamics.
🌍 Macro Lens
• OPEC still tight
• U.S. SPR not refilled
• Geopolitics = foggy at best
• Seasonal energy demand rising
• Biden vs Trump = policy shake-up incoming
Forget narratives — crude is telling its own story.
💡 Thought of the Day 💡
Everything we build, move, ship, and mine — starts with oil.
It’s not going away. It’s just waiting to be priced correctly again.
You may love AI, but it still runs on diesel in the real world.
One Love,
The FXPROFESSOR 💙
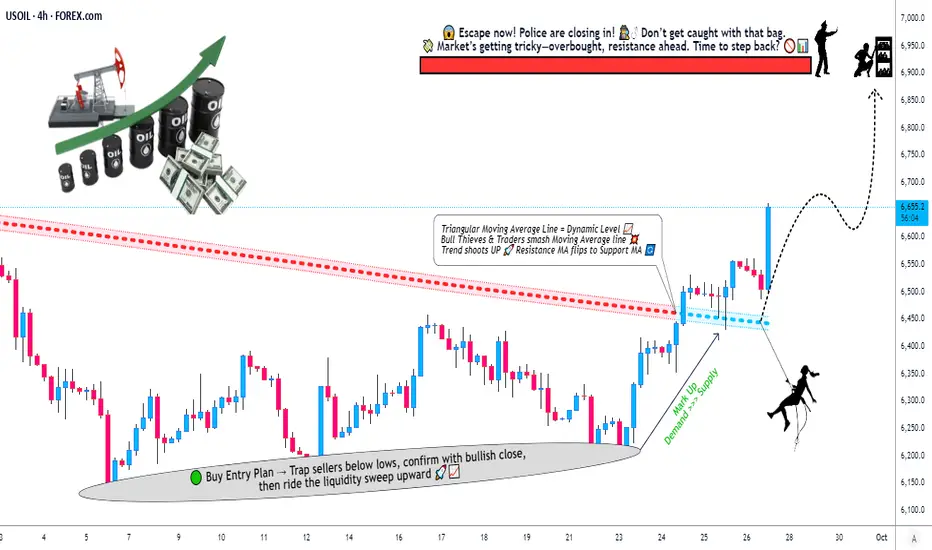
Crude Oil Trading Map: Bullish Momentum vs Key Resistance🛢️ WTI Crude Oil (USOIL/XTIUSD) – Energies Market Wealth Strategy Map ⚡
🎯 Trade Plan (Swing/Day Trade Vibe)
📌 Bias: Bullish setup confirmed by Triangular Moving Average dynamic resistance breakout.
💰 Entry (Thief Layering Strategy):
We don’t just walk in the front door — we layer like true OG’s.
Buy Limit Layers: 6450, 6500, 6550, 6600
You can always add more “layers” depending on your conviction & style.
🛑 Stop Loss (Thief Escape Plan):
Suggested SL: 6350
⚠️ Note: Dear Ladies & Gentlemen (Thief OG’s) — I’m not recommending you use only my SL. Risk is yours, profit is yours. Protect your bag your way.
🎯 Target Zone (Profit Heist Exit):
First escape point: 6900
Above here? Careful. Around 6950 sits a Police Barricade 🚔 (Resistance + Overbought Trap). That’s where the chase gets real — don’t overstay!
🔑 Key Notes for the Thief OG’s:
Layering Strategy: Spreading entries reduces exposure & maximizes flexibility.
Dynamic Resistance Breakout: Momentum shift confirms bulls are sneaking in.
Psychological Trap @6950: Overbought zones = potential reversals.
🔗 Correlation & Related Pairs to Watch:
TVC:USOIL / FXOPEN:XTIUSD (Primary Chart)
BLACKBULL:BRENT / TVC:UKOIL → Closely tracks WTI, sometimes diverges.
FX:USDJPY & TVC:DXY → Oil often inversely correlated with the US Dollar.
OANDA:XAGUSD & OANDA:XAUUSD → Commodity cousins, useful for cross-market sentiment.
FOREXCOM:SPX500 & NASDAQ:NDX → Risk-on sentiment can boost crude oil demand outlook.
✨ “If you find value in my analysis, a 👍 and 🚀 boost is much appreciated — it helps me share more setups with the community!”
⚠️ Disclaimer: This is a Thief Style Trading Strategy — just for fun and market education. Not financial advice. Trade at your own risk.
#USOIL #XTIUSD #CrudeOil #WTI #EnergyMarkets #SwingTrade #DayTrading #TechnicalAnalysis #TradingStrategy #ThiefStrategy
Hellena | Oil (4H): SHORT to support area of 56-57.Colleagues, price is actively moving in a downward direction and I believe the move is not yet complete.
Earlier I saw this move as a big correction, but now the structure is more of an impulsive one. This means that the price is moving in the wave “3” of the higher order (Red), which should be completed soon.
For this to happen, the price needs to complete the correction in the wave “4” of medium order and then update the low, reaching the support area of 56-57.
The extension of wave “3” is possible - then the price will reach the target without correction.
Fundamental context
Global oil inventories are forecast to rise through 2025, putting downward pressure on prices despite efforts by some producers to restrain output.
OPEC+ has been increasing production again, which adds to the supply burden.
Meanwhile, demand forecasts have been trimmed amid softer economic growth indicators in key consuming regions.
Major banks have lowered long-term price expectations for crude — the balance is tilting toward a more bearish outlook.
Manage your capital correctly and competently! Only enter trades based on reliable patterns!


WTI Crude Oil – Buy SetupPrice is holding near intraday support after a strong sell-off. A potential short-term rebound could target the upper resistance zone.
Buy Entry: 57.45
Stop Loss: 57.25
Take Profit: 58.60
📈 Bias: Intraday Bullish Reversal
⚠️ Note: This analysis is for educational purposes only. Always confirm entries with your own strategy and manage risk accordingly.
#WTI #CrudeOil #XTIUSD #Scalping #TradingSetup #BuySignal

USOIL Struggles to Hold Gains, Bearish Trend Intact
Current market sentiment is bearish.
USOIL is struggling to hold above resistance and leaning towards support.
USOIL is trading at $63.76, below the mid-Bollinger band → showing weak momentum.
Price failed to hold above $66–68 resistance zone and is now trending lower.
Price is leaning towards the lower band, suggesting bearish continuation risk.

WTI Crude Nears Yearly LowsOver the past three trading sessions, WTI crude has fallen by more than 3.5%, as bearish sentiment has regained control of the market. Uncertainty over global oil demand has heightened investor caution, particularly amid the escalation of trade tensions between the United States and China, which has reignited fears of a slowdown in global trade. This scenario could directly impact the consumption of energy products such as oil, leading to a further decline in demand in the short term. As this atmosphere of concern persists, selling pressure is likely to continue strengthening in the coming sessions.
Strong Bearish Bias
Persistent selling pressure has reinforced the downward trendline that has remained in place throughout 2025, with no significant bullish corrections indicating a potential structural shift in market strength in the short term. As a result, the bearish bias continues to dominate, consolidating the market’s downward trajectory. As the price approaches key support levels, it will be crucial to determine whether current selling pressure remains a decisive force in upcoming price movements.
RSI
The RSI line continues to fall below the neutral 50 level, signaling that bearish momentum remains dominant on average over the past 14 sessions. However, it’s worth noting that the price is approaching a key support area, while the RSI nears the 30 level, considered the oversold zone. This could suggest a potential imbalance in market forces and open the door to short-term technical rebounds in the sessions ahead.
MACD
The MACD histogram remains below the neutral line (0), confirming that the short-term moving averages continue to show bearish momentum. If this pattern persists, it could result in stronger selling pressure extending into the medium term.
Key Levels to Watch:
$66 – Major Resistance: Aligns with the 200-period moving average. A bullish move reaching this level could trigger a temporary buying bias and challenge the prevailing downtrend line.
$62 – Near-Term Resistance: Corresponds to the 50-period moving average. If the price stabilizes around this area, it could lead to a neutral sentiment and a period of sideways consolidation in the short term.
$57 – Critical Support: Represents the lowest price levels of the year for WTI. A break below this level could intensify bearish pressure, although it may also serve as a support barrier, allowing for short-term technical corrections to the upside.
Written by Julian Pineda, CFA – Market Analyst

Crude Oil Approaches End of Elliott Wave PatternAbove, is the video review for Crude Oil.
Taking a look at the longer perspective, a multi-year ending diagonal pattern is nearing its end.
The weekly chart for TVC:USOIL suggests the decline is wave 5 of a 5-wave diagonal. The 61% Fibonacci retracement level sits near $49. We're anticipating a bullish reversal between current prices and $49 to carry up to new all-time highs over the coming years.
Looking at a clusters of wave relationships and market geometry, I'd like to see Crude Oil reach the yellow box and punch new lows, but it doesn't have to.
If prices fall further, then the 61% Fib level at $49 may provide support.

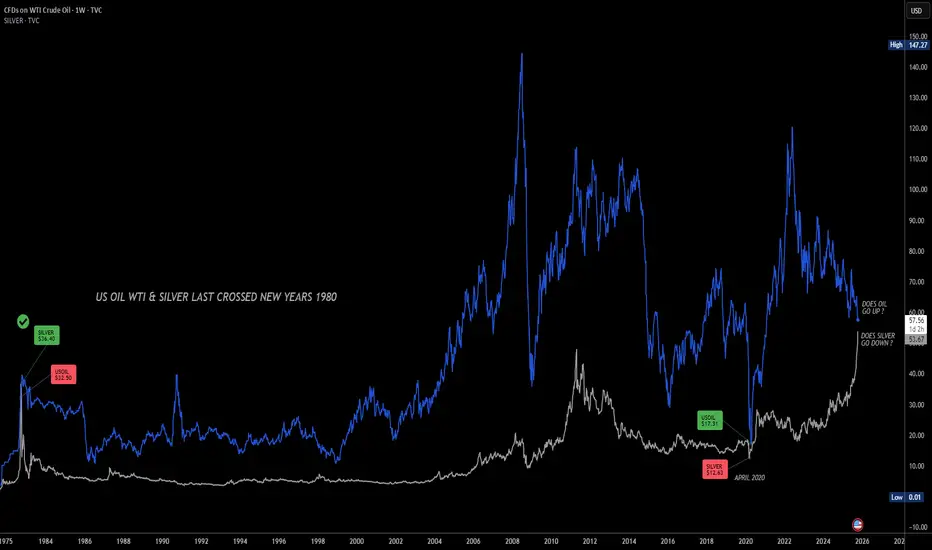
Its been a long time Silver Spot ( AMEX:USD ) has not crossed that of US Oil WTI since the first three weeks of 1980 ..and not prior going back to 1901 ~ so looking today I have to ask, does Oil go up or Silver down.. and has anyone seen a 5 year running oil deficit ?
WTI to $55 amid excess supply concerns?There was some relief at the start of the week for oil prices as traders reacted to the weekend news of de-escalation in the trade war between the US and China and figured that a potential extension of the tariff truce would be net positive for the demand outlook. However, the recovery stalled as WTI prices couldn’t break above $60 per barrel and have since turned flat on the week. The bearish trend thus remains intact for oil. Here, investors are concerned about the excess supply of the stuff hitting the markets, as the OPEC+ is gradually releasing some withheld oil supplies to win back market share. The group’s plan is to increase production by a total of 1.65 million barrels per day by the end of 2025. It has already increased output by 137K bpd from October. Against a backdrop of increasing supplies, it looks like WTI is heading towards the April lows of around $55.00 again.
By Fawad Razaqzada, market analyst with FOREX.com

WTI Crude Oil range trading support at 5747The WTI Crude Oil is currently trading with a bearish bias, aligned with the broader downward trend. Recent price action shows a retest of the longer term support, suggesting a temporary relief rally within the downtrend.
Key resistance is located at 6030, a prior consolidation zone. This level will be critical in determining the next directional move.
A bearish rejection from 6030 could confirm the resumption of the downtrend, targeting the next support levels at 5747, followed by 5677 and 5606 over a longer timeframe.
Conversely, a decisive breakout and daily close above 6030 would invalidate the current bearish setup, shifting sentiment to bullish and potentially triggering a move towards 6073, then 6170.
Conclusion:
The short-term outlook remains bearish unless the WTI Crude price breaks and holds above 6030. Traders should watch for price action signals around this key level to confirm direction. A rejection favours fresh downside continuation, while a breakout signals a potential trend reversal or deeper correction.
This communication is for informational purposes only and should not be viewed as any form of recommendation as to a particular course of action or as investment advice. It is not intended as an offer or solicitation for the purchase or sale of any financial instrument or as an official confirmation of any transaction. Opinions, estimates and assumptions expressed herein are made as of the date of this communication and are subject to change without notice. This communication has been prepared based upon information, including market prices, data and other information, believed to be reliable; however, Trade Nation does not warrant its completeness or accuracy. All market prices and market data contained in or attached to this communication are indicative and subject to change without notice.

Crude Oil: Mainly Expected to Oscillate DownwardCrude oil has been in a continuous downward trend recently. Both the daily chart movement and the moving average system show a downward divergence pattern, and a new descending channel has been officially formed.
In terms of operation, we need to continue to follow the bearish trend. Today, we can take the opportunity of a rebound at the 58 level to set up short positions.
Special attention should be paid to the fact that crude oil is about to enter the contract delivery period. We need to focus on whether the delivery situation will disrupt the current trend. From the perspective of the current fundamentals and news, the long and short factors are clearly one-sided, and the overall situation still mainly depresses crude oil prices.
Sell 58.8 TP 58 - 55 SL 60.2
Daily-updated accurate signals are at your disposal. If you run into any problems while trading, these signals serve as a reliable reference—don’t hesitate to use them! I truly hope they bring you significant assistance
