W (Walmart) – Technical Outlook with Key Support & Resistance LeDescription:
Walmart Inc. (NYSE: W) is one of the world’s leading retail corporations, known for its strong revenue streams and defensive positioning in the consumer sector. Despite global market challenges, Walmart has shown resilience supported by steady fundamentals, stable cash flow, and consis
$WUSDT Breakout: 269% Potential Ahead!$W just broke past a major resistance level, setting its sights on 0.4075, which could mean a massive 269% Gain.
After a long downtrend, it's finally showing some serious bullish momentum.
If this continues, we could see some big moves heading into October.
DYOR, NFA

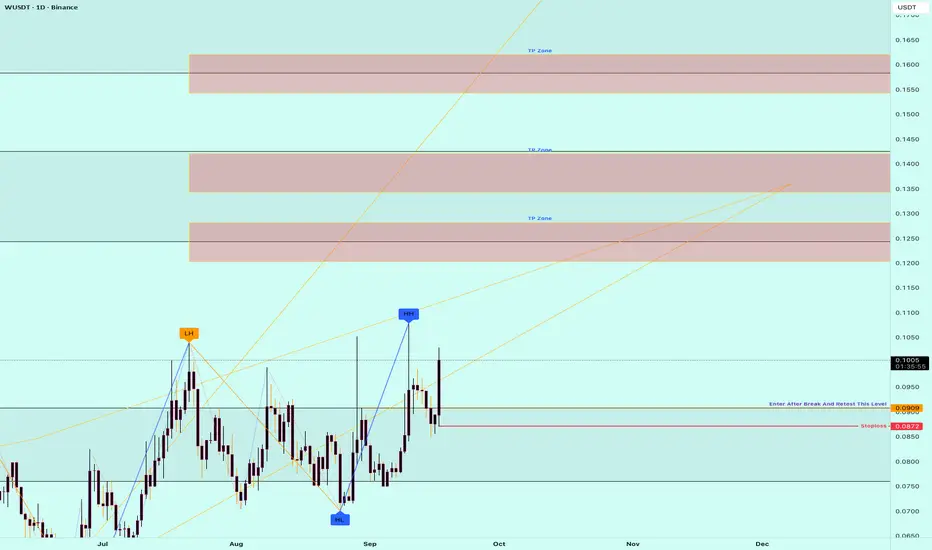
W Secondary. Reversed Head and Shoulders Key Area. 18 09 25Logarithm. 3 days.
Main trend 23 03 2025
A breakout of the previously mentioned key resistance (pair to USD) occurs on huge buying volume and an exit from the sideways trend (inverse head and shoulders).
Local targets, in case the inverse head and shoulders pattern is realized and a bowl forms

W/USDTKey Level Zone: 0.08800 - 0.09000
LMT v2.0 detected.
The setup looks promising—price previously trended upward with rising volume and momentum, then retested this zone cleanly. This presents an excellent reward-to-risk opportunity if momentum continues to align.
Introducing LMT (Levels & Momentum

WUSDT UPDATE#W
UPDATE
W Technical Setup
Pattern: Bullish Falling Wedge Pattern
Current Price: $0.2145
Target Price: $0.3010
Target % Gain: 110.29%
$W is breaking out of a falling wedge pattern on the 1D timeframe. Current price is $0.2145 with a target near $0.3010, showing about 40% potential upside. The b

W/USDT continues to move within a well-defined descending chann🔻 The price has dropped around –96% from its all-time high.
That doesn’t guarantee a bottom — but further downside is no longer a given.
🚫 Opening shorts in this zone looks questionable,
especially considering the broader altcoin market structure.
📊 A more strategic approach would be to trade from

WUSDT – Weekly Bullish Divergence | Trendline Break Signals PossWUSDT – Weekly Bullish Divergence | Trendline Break Signals Possible Macro Reversal 🚀📈
Hey traders 👋
After a long stretch of bearish pressure, WUSDT is finally showing its first real signs of strength. On the weekly timeframe, we have a bullish divergence forming — a major clue that selling momentu

#W (Spot)BINANCE:WUSDT
#W/ USDT
Entry range (0.0750- 0.0850)
SL 1D close below 0.070
T1 0.1200
T2 0.1600
T3 0.2300
Extra Target is optional 0.3000
_______________________________________________________
Golden Advices.
********************
* collect the coin slowly in the entry range.
* Please ca

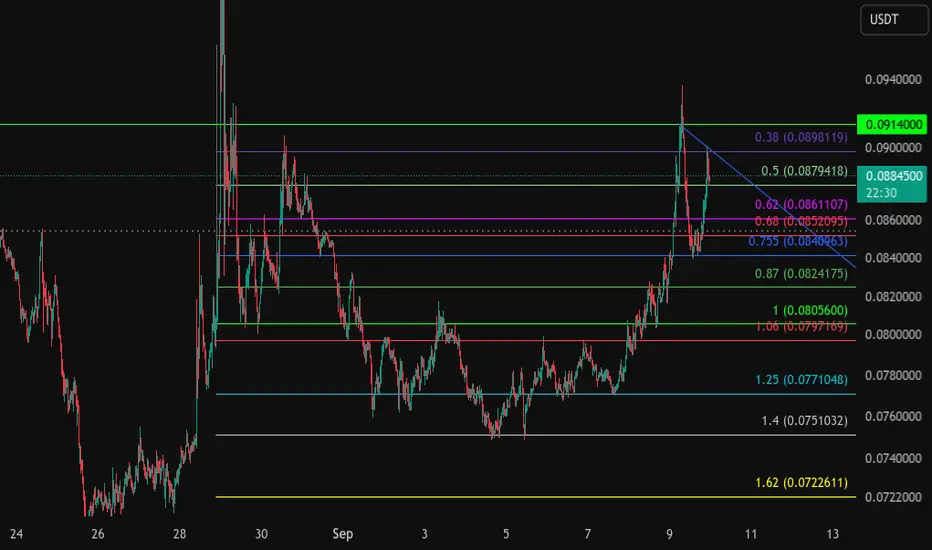
worm hole worming its way down the hole?looks like we might get thhat bear wave maybe ,,,,, looking for .07727.for smart money grab. not finacial advise, stop loss above the high
WUSDT UPDATE#W
UPDATE
W Technical Setup
Pattern: Bullish Falling Wedge Pattern
Current Price: $0.2145
Target Price: $0.3010
Target % Gain: 40.29%
$W is breaking out of a falling wedge pattern on the 1D timeframe. Current price is $0.2145 with a target near $0.3010, showing about 40% potential upside. The br

See all ideas
Summarizing what the indicators are suggesting.
Oscillators
Neutral
SellBuy
Strong sellStrong buy
Strong sellSellNeutralBuyStrong buy
Oscillators
Neutral
SellBuy
Strong sellStrong buy
Strong sellSellNeutralBuyStrong buy
Summary
Neutral
SellBuy
Strong sellStrong buy
Strong sellSellNeutralBuyStrong buy
Summary
Neutral
SellBuy
Strong sellStrong buy
Strong sellSellNeutralBuyStrong buy
Summary
Neutral
SellBuy
Strong sellStrong buy
Strong sellSellNeutralBuyStrong buy
Moving Averages
Neutral
SellBuy
Strong sellStrong buy
Strong sellSellNeutralBuyStrong buy
Moving Averages
Neutral
SellBuy
Strong sellStrong buy
Strong sellSellNeutralBuyStrong buy
Displays a symbol's price movements over previous years to identify recurring trends.