#XAI/USDT — Accumulation at Key Zone & Potential Reversal?#XAI
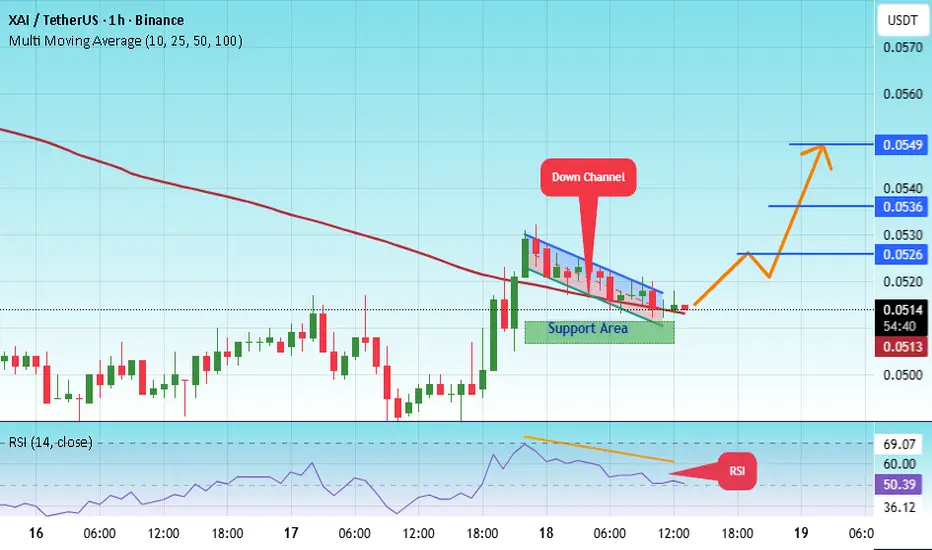
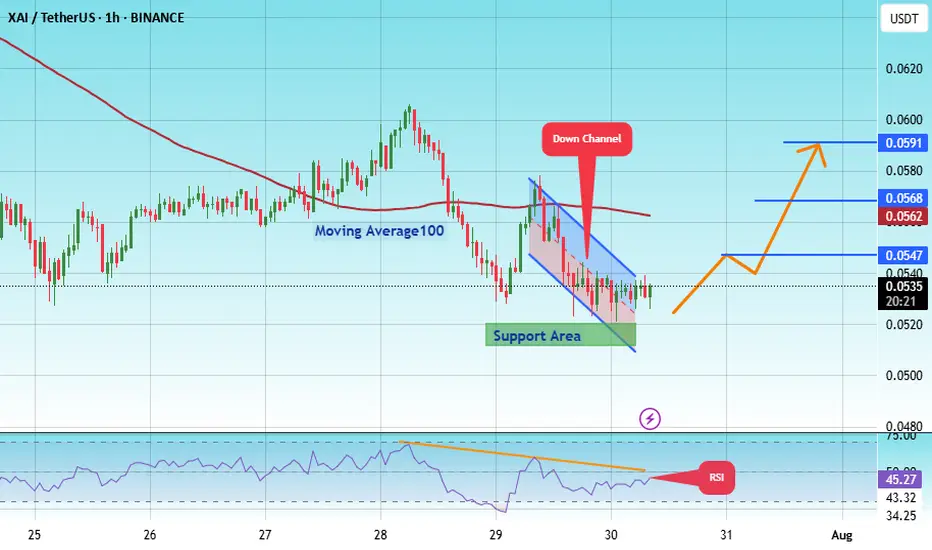
The price is moving within a descending channel on the 1-hour frame, adhering well to it, and is heading for a strong breakout and retest.
We have a bearish trend on the RSI indicator that is about to be broken and retested, which supports the upward breakout.
There is a major support area i
XAIUSDT UPDATE#XAI
UPDATE
XAI Technical Setup
Pattern : Bullish Falling Wedge Breakout
Current Price: $0.057
Target Price: $0.095
Target % Gain: 90.56%
Technical Analysis: XAI has broken out of a falling wedge on the daily chart with strong bullish momentum. The breakout is supported by increasing buying pres

#XAI/USDT — Accumulation at Key Zone & Potential Reversal?#XAI
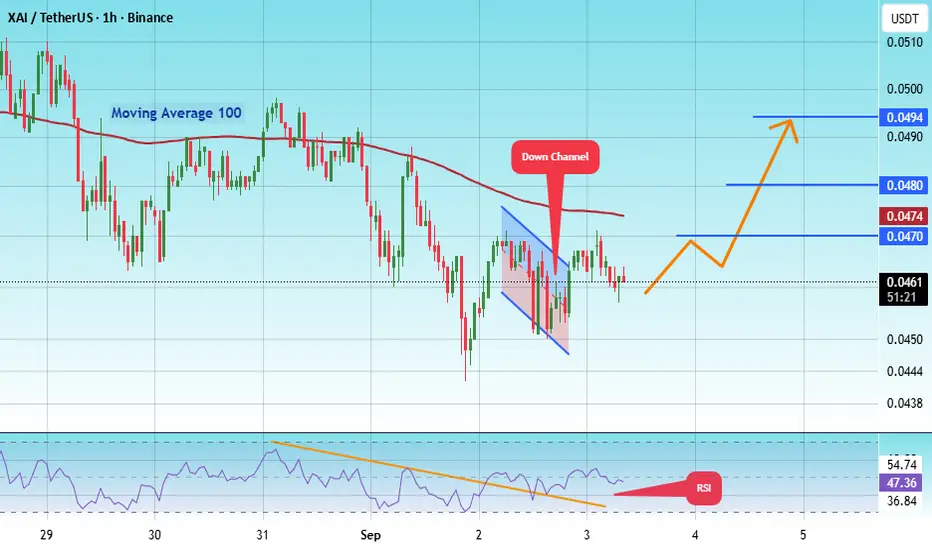
The price is moving within a descending channel on the 1-hour frame, adhering well to it, and is heading for a strong breakout and retest.
We have a bearish trend on the RSI indicator that is about to be broken and retested, which supports the upward breakout.
There is a major support area i
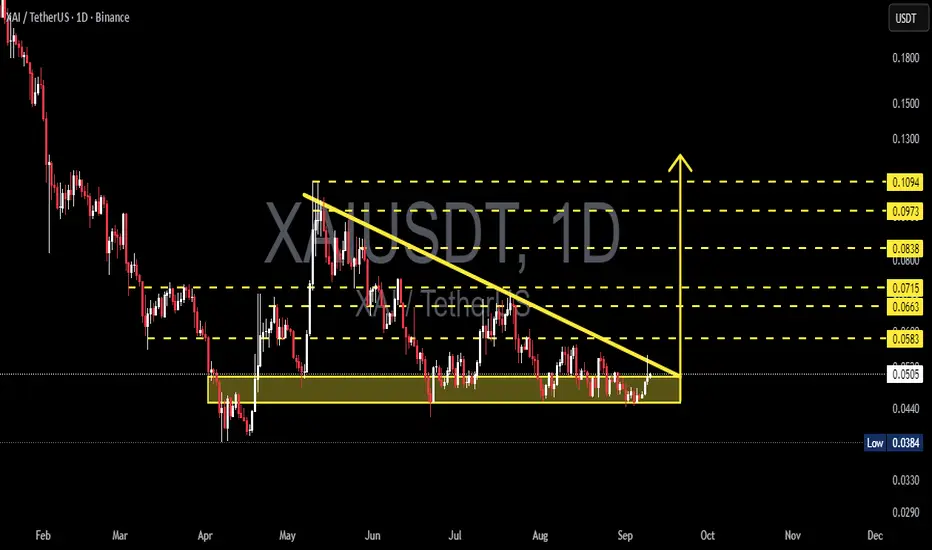
XAI/USDT — Descending Triangle: Ready for Takeoff or Breakdown?✨ Quick Summary:
The XAI/USDT chart is now at a critical decision point. For months, price has been consolidating inside the accumulation zone (0.0384 – 0.050), while being consistently pressured by a descending trendline from above. This structure forms a descending triangle, a pattern that often s
XAIUSDT Forming Bullish PennantXAIUSDT is showing strong bullish potential as it forms a classic bullish pennant pattern on the charts. This pattern usually emerges after a significant upward move, followed by a period of consolidation within converging trendlines. With a solid breakout expected, the technical setup suggests the

XAIUSDT 1D#XAI has broken above the long-term descending resistance on the daily chart and is currently facing rejection from the daily SMA100. In case of a successful retest, the potential targets are:
🎯 $0.0554
🎯 $0.0634
🎯 $0.0699
🎯 $0.0763
🎯 $0.0855
🎯 $0.0972
⚠️ Always remember to use a tight stop-loss a

IS THERE ANY CHANCE OF ATH ..???Do you think that this shit coin will ever touch ATH .
from 1.6 to 0.04 wasted...

XAI POTENTIAL BREAKOUT +50% MOVEXAI Looking for potential breakout after being bottomed.
TP: 0.65
TP2: 0.75
TP3: 1.10
BREAKOUT ON WAY.

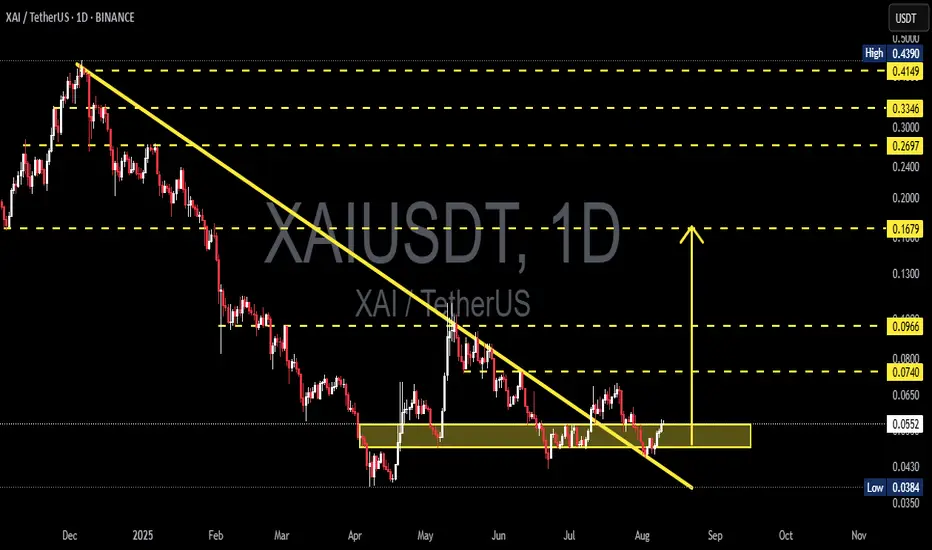
XAI/USDT — Accumulation at Key Zone & Potential Reversal?Summary
The daily chart shows XAI in a consolidation/accumulation phase within a key support zone (yellow box) after a prolonged downtrend. The long-term descending trendline (yellow) has recently been broken, signaling early signs that the downtrend may be losing momentum. However, confirmation is
#XAI/USDT breakout Buy breakout,#XAI
The price is moving within an ascending channel on the 1-hour frame, adhering well to it, and is on its way to breaking strongly upwards and retesting it.
We have support from the lower boundary of the ascending channel, at 0.0511.
We have a downtrend on the RSI indicator that is about to br
See all ideas
Displays a symbol's price movements over previous years to identify recurring trends.