Gold Analysis (XAUUSD) | 1H Timeframe
🔹 Current Status: Gold is aggressively breaking new highs and showing strong bullish moves. This suggests that we might be experiencing the best year for gold in several decades.
🔹 Scenario 1: If the price reaches 3,840 and 3,860 levels, there’s a possibility of a pullback to lower green areas (around 3,700 or 3,680). These green zones can be ideal for entering long positions with lower risk.
🔹 Scenario 2: If the price swiftly breaks through the higher levels and moves further up, it might indicate the continuation of the bullish trend. In this case, look for long positions on lower timeframes (such as 5 minutes) with confirmation from candlestick patterns and price action.
🔹 Key Points:
The price is breaking new highs and continuing the bullish trend.
Look for long positions in lower timeframes in the green zones for confirmation.
Enter long near 3,700 and 3,680 with low risk.
XAUUSD trade ideas

Gold Analysis – Spot Market (XAU/USD) 07-10-2025Gold is currently trading at $3,983 per ounce, marking a decline of $29.8 from the December futures contract, which last closed around $4,012.8. This represents a decrease of approximately 0.74%, reflecting the widening gap between the spot market and futures prices as investors take short-term profits in spot positions while maintaining longer-term hedging demand.
In the short term, gold faces immediate resistance between $3,990 and $3,995, where short-term sell orders have capped upward movement during the early European session. The nearest support lies at $3,975, followed by a more significant level at $3,960, marking the base of the recent consolidation zone observed on liquidity maps.
Current data indicates that bullish momentum has started to ease, with trading volumes lower than those seen during the surge above $4,000. Price flow indicators suggest a temporary balance between buying and selling pressure after the recent rally. Maintaining price action above the 50-period moving average on short-term charts keeps the broader trend positive; however, sustained trading below $3,990 could trigger a limited correction toward $3,965–$3,960 before another attempt to retest the $4,000 threshold.
Overall, the medium-term outlook remains bullish, yet the clear divergence between spot and futures prices reflects short-term caution versus longer-term optimism, suggesting that gold may trade in a more volatile and cautious manner around current levels in the coming hours.

sell orderThere is a change of character in the trend, and price will react to tap the origin that cause the change of character and continue to the down side

XAUUSD H1 CHART XAUUSD (1H) 📊
Buy Zone ---> 3967
TG1 ---> 4000
TG2 ---> 4040
SL--> Below Liquidity Zone

Will gold break through the 4000 mark today?
I. Core View
The gold market currently maintains a strong bullish trend overall, with both fundamental and technical aspects favoring an upward bias. However, as prices are at historical highs and in overbought territory, high vigilance is needed against potential short-term technical corrections or pullbacks triggered by profit-taking. The primary trading approach should be buying on dips, but chasing the rally higher requires caution.
II. Fundamental Analysis
Supportive Factors:
Fed Rate Cut Expectations: Market expectations for further Fed rate cuts this year are weighing on the US Dollar, providing key support for non-yielding gold.
High Risk Aversion: Persistent US government shutdown risks, alongside escalating global trade and geopolitical tensions, enhance gold's safe-haven appeal and limit its downside.
Potential Risks:
Short-Term USD Strength: A continued rebound in the US Dollar could exert short-term pressure on gold, although its impact is expected to be limited due to a lack of firm bullish conviction.
Fundamental Conclusion: The favorable fundamental backdrop makes any substantial decline in gold prices difficult to sustain. The path of least resistance remains to the upside.
III. Technical Analysis
Trend: The strong bullish structure remains intact, with prices continuously setting new all-time highs on the daily chart.
Current Price: Slightly retreated after hitting a new all-time high of $3978/oz.
Key Target Level:
Upside Target: $4000/oz is a key psychological and technical barrier.
Key Support Levels:
First Support: $3940 - $3930/oz
Second Support: $3900/oz
Major Support: $3850/oz
Risk Warning:
Recalling last week's price action, a significant correction followed Monday's sharp rally. Be alert for a potential repeat of a similar "corrective sharp decline post-rally" today (Tuesday).
If the price decisively breaks below the $3900/oz support, it could trigger a deeper correction towards the $3850/oz area.
IV. Trading Strategy Suggestions
Primary Strategy: Buy on Dips
Look for potential long entry opportunities near the $3940-3930 support zone if price stabilizes there.
Consider positioning for longs if the price retreats to near the $3900 level and finds support.
Targets are towards $3980-3990 and ultimately the $4000 threshold.
Secondary Strategy: Cautious Shorting on Resistance
Aggressive traders might consider light short positions if price initially tests the $3980-3990 resistance area and shows clear rejection signs (e.g., a long upper wick), using a tight stop loss and targeting lower support levels.
This strategy carries higher risk and is more suitable for short-term traders.
Risk Control Essentials:
Strict Stop-Loss: Place stop-loss orders for long positions below key support levels (e.g., below $3930 or $3900).
Monitor Breakdowns: Closely watch the $3900 support. A decisive break below it warrants a strategy adjustment to avoid the risk of a deeper pullback.

XAUUSD – MID-TERM OUTLOOK ON H1 | STAY CLOSE TO THE MAIN TREND
Hello trader 👋
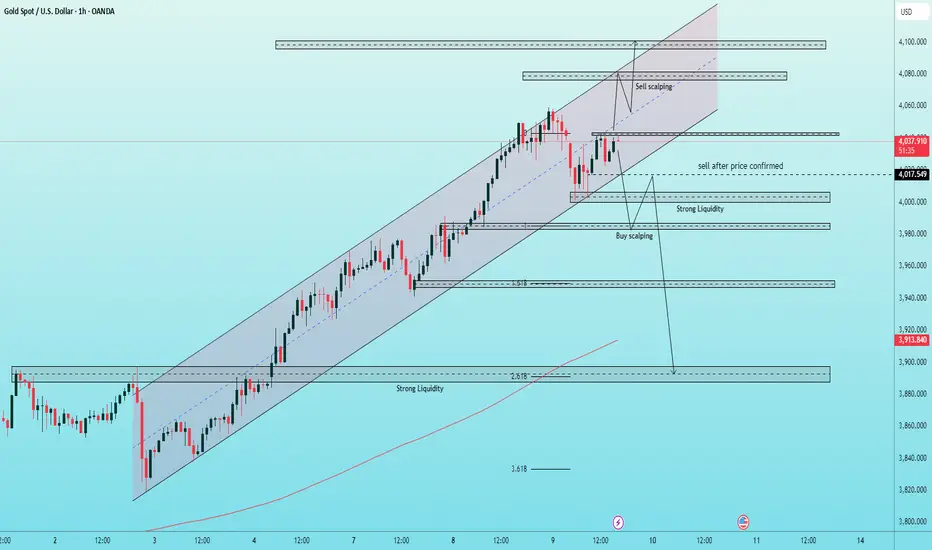
Gold prices are currently holding steady within the rising channel but are approaching a strong resistance zone around 4043 – 4005, a critical boundary to assess whether the uptrend will continue or begin to adjust.
In the current context, the market is showing signs of caution as the USD rises slightly and political - financial news in the US escalates, causing strong investor sentiment fluctuations.
🔎 Technical Analysis
On the H1 frame, prices continue to move within a clear upward channel, but the upward momentum is beginning to weaken.
Fibonacci extension and volume profile indicate a strong liquidity zone concentrated around 4005 – 3980, where buying and selling forces may appear in a tug-of-war.
Important resistance: 4078 – 4080 (Fibo 4.0 and upper edge of the rising channel)
Important support: 3985 – 3980 (liquidity zone + high volume node)
RSI is giving a slight divergence signal, warning of the possibility of a technical adjustment.
⚙️ Detailed Trading Plan
🔴 MAIN SELL:
Entry: 4078 – 4080
Stop Loss: 4085
Take Profit: 4060 → 4053 → 4025 → 4008
👉 Sell reaction at the channel peak resistance zone, coinciding with the high liquidity area.
🔴 SELL on confirmation of breaking 4005:
Entry: 4015 – 4017
Stop Loss: 4023
Take Profit: 4005 → 3988 → 3970 → 3945
👉 Breakout sell order, only activated when the candle confirms closing below 4005.
🟢 SHORT-TERM BUY:
Entry: 4056 – 4058
Stop Loss: 4050
Take Profit: 4068 → 4088 → 4095
👉 Wave surfing buy order at the support zone within the rising channel.
🟢 BUY SCALPING:
Entry: 3982 – 3985
Stop Loss: 3978
Take Profit: based on price reaction / wave confirmation
👉 Quick buy at the strong liquidity zone if a reversal signal appears.
💡 Fundamental View
Latest news: Bensont has completed the first round of interviews for the Fed Chair candidate, with questions revolving around interest rates and QE, indicating that upcoming monetary policy remains the focal point.
The DXY index has surpassed the 99 mark, up 0.16% on the day, exerting certain pressure on gold.
Market sentiment is fluctuating strongly, reflecting concerns about the direction of US monetary policy in the next quarter.
⚖️ Conclusion
Mid-term trend: Upward but weakening
At this stage, it is necessary to closely follow price action at the 4043 – 4005 boundary to determine the next direction.
Prioritize selling at resistance – buying at support, taking advantage of fluctuations within the price channel.
Maintain a flexible trading mindset, manage capital tightly when the market fluctuates due to news.
📈 Quick Summary:
Sell: 4078–4080 / 4015–4017
Buy: 4056–4058 / 3982–3985
Key zone: 4043 – 4005 (confirm new trend)
Gold has the potential to set a new highHey everyone, it's Kilian here!
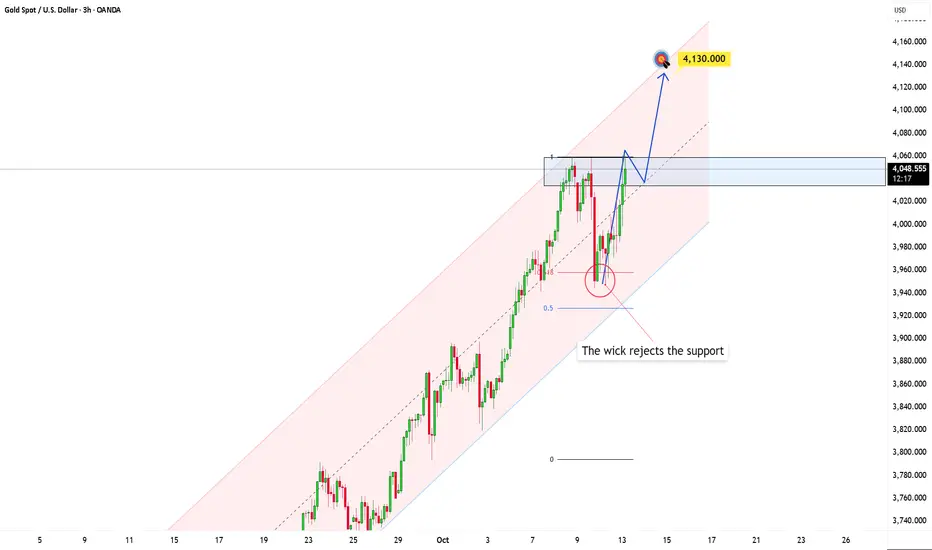
Gold is at a very interesting phase right now. After experiencing a strong price surge within a parallel ascending channel, the market is now showing signs of consolidation at these high levels. This suggests that the buyers still have control, and the bullish momentum remains intact for now.
If the price manages to break through this area with a strong bullish candle and high volume, it will confirm the dominance of the buyers and open up the potential for a new rally towards the target around 4.130, which aligns with the upper boundary of the channel.
However, if the price fails to break through and is instead rejected by strong selling pressure, the appearance of a large bearish candle could signal that the upward momentum is weakening. In this scenario, the price may fall back to test the lower boundary of the channel.
XAUUSD - MARKET CONTEXT I Oct/08/2025🔎 MARKET CONTEXT
Main Trend: Clear uptrend — gold keeps forming higher highs, and the ascending price channel remains valid.
Technical Structure: Key support zones are clearly established:
4020 – 4011 (Liquidity & POC zone M15): Important short-term support.
4005 – 3990 (VaL zone & Daily Open): Stronger support if a deeper pullback occurs.
Short-term resistance: Around 4037 – 4040; if broken, price may extend toward 4060 – 4070.
📌 TRADING SCENARIOS
1️⃣ BUY CONTINUATION (Priority Setup)
Entry Conditions:
✅ Price holds above 4020 – 4011 (Liquidity & POC zone) and shows bullish confirmation (e.g., reversal candle or strong volume).
Entry: 4020 – 4025
Stop Loss: Below 4005
Take Profit: 4045 – 4060
👉 Reason: The bullish trend remains dominant; buying pressure is still strong; the POC zone provides solid support.
2️⃣ DEEP PULLBACK THEN BUY
Entry Conditions:
✅ Price retraces toward 4005 – 3990 (VaL zone + Daily Open) and shows a bullish rebound.
Entry: 4000 – 4005
Stop Loss: Below 3980
Take Profit: 4035 – 4050
👉 Reason: This is a confluence zone (Daily Open + VaL + demand area), offering low risk – high reward potential.
3️⃣ SHORT-TERM SELL (Counter-Trend)
Entry Conditions:
✅ Strong rejection appears around 4037 – 4040 (e.g., bearish Pin Bar / Engulfing candle).
Entry: 4035 – 4040
Stop Loss: Above 4045
Take Profit: 4020 – 4011
👉 Reason: This resistance zone often acts as a short-term profit-taking area for buyers, increasing the chance of a temporary pullback.
💡 MESSAGE TO TRADERS
The main trend remains bullish — focus on buying from key support zones.
Only consider short-term sells if clear rejection signals appear at resistance.
Manage risk carefully — after a strong rally, price volatility tends to increase.
⚖️ Trading is like business – be patient, wait for confirmation instead of FOMO.

Gold Market AnalysisIsrael and Hamas have reached a ceasefire agreement for the Gaza Strip 🇵🇸, which has led to a rapid cooling of safe-haven sentiment in the market . Investors who previously bought gold out of concern over the conflict have begun to withdraw from the market . Meanwhile, the U.S. dollar has shown strong performance recently , and the cautious interest rate cut signals released by Federal Reserve officials have also cooled the market's expectations for loose monetary policies . These combined factors have ultimately caused a sharp decline in gold prices .
From the current trend, I believe the support at the $3,940 level remains strong , and a rebound is imminent . The key resistance above lies in the $4,050–$4,060 range . If this range is successfully broken, gold prices are likely to continue their upward momentum next week and challenge the new high around $4,100 .📈
Buy@3960 - 3970
TP 3990 - 4000 - 4010

The adjustment has begun, seize the opportunityGold has remained in overbought territory for the past month. After four consecutive days of strong gains, investors have taken profits, and gold's safe-haven appeal has waned. US President Trump stated that a resolution to the Middle East conflict is "very close." Previously, Israeli and Hamas officials expressed cautious optimism about ongoing negotiations in Egypt, believing that the two-year Gaza conflict could end.
From a technical perspective, the RSI indicator has been in the overbought range. As mentioned before, the recent rise in gold was driven by news. When geopolitical tensions ease, gold will definitely adjust. Today's trend is in line with our expectations. At this stage, we only need to focus on the 4000 point support. If it falls below this position, the next support will be at 3977-3980.
Those who followed me in entering short positions below 4050 today have already taken profits on some of their positions near 4020, and will gradually take profits on the remaining positions near 4000.
For specific trading decisions, please follow my real-time updates. I will update my trading ideas and strategies daily. If you don’t have a plan or idea about gold trading and cannot achieve sustained and stable profits, you can refer to and follow my updated content as a reference and guidance to help you avoid mistakes.
Short term selling, target 3965The rise has been too rapid. Let's see if it can break through the resistance level of 3985.
Sell briefly now: TP 3865, SL 3885.
Be sure to set the SL correctly. If it breaks through 3885, it will rise straight to 4000, which will trigger another wave of panic selling.

Gold continues to rise. Bulls and bears clash.Last week, gold prices intensified risk aversion amid Trump's tariff policy. Subsequent rhetoric of peace has tempered risk sentiment, but gold prices haven't fallen. Gold opened the week stronger, hitting new all-time highs. Currently, the market's gains are primarily due to a lack of bearish catalysts, allowing prices to rise by inertia.
From an information analysis perspective, as the Federal Reserve continues its dovish policy response, real interest rates may continue to decline, which will support the long-term upward trend of gold.
At present, gold is still rising slowly, breaking through highs continuously, and the upward trend is still continuing. It is still unknown whether it can break through 4100. The first retracement point that can be seen at present is 4060. If it unexpectedly falls below, it will test the 4030 line, but it seems a bit difficult at the moment.
The 1-hour moving average continues to diverge upward, and gold bulls still have upward momentum, but we need to pay attention to the correction after the price surges. The overall strong upward trend of the hourly line has not changed. There may be small fluctuations in the short term, and you can try to enter the market operation. The short-term resistance level is temporarily focused on the 4100 mark, and the support level is around 4060.
Trading Strategy:
Go long on a pullback near 4060, with a stop loss at 4050. Profit range: 4085-4090-4100.
Short around 4095, with a defense at 4105. Profit range: 4070-4060-4050.

BUY SIGNAL; ASSET GOLD /XAUUSDBullish momentum confirmed with strong structure break and rejection from key support zone.
Price showing continuation strength ahead of the London session.
Targeting higher liquidity levels with clear upside potential.
Entry: Active
Stop Loss: Below recent swing low
Take Profit: 1st AT 100 PIPS DAILY SIGNALS
Momentum is building as bulls step back into control!
This setup highlights a high-probability short-term buying opportunity, ideal for traders who thrive on clean structure, momentum, and precision timing.
Market Snapshot
Structure Shift: Price holds a strong higher low — a classic sign of bullish intent.
Momentum Building: Buyers are defending key levels, showing early control.
Entry Zone: A focused area where upside acceleration is likely to begin.
Risk Control: Stop-loss levels kept tight (around 40–50 pips) for efficient capital protection.
Trading Outlook
Consider long entries near the highlighted zone as confirmation builds.
Targets: Short-term take-profits toward recent resistance or liquidity zones.
Tip: Adjust your lot size based on your personal risk plan — precision over size wins.
Trader’s Note
This signal focuses on short-term market momentum. Use it as part of a broader trading plan — not a guarantee. Stay disciplined, follow your risk rules, and let structure guide your trade.


XAUUSD | Liquidity Sweep and Potential Bullish Expansion (Words Gold swept sell-side liquidity and is now reacting from a discount zone.
Price is filling a liquidity void with room toward 4,020 – 4,040, where premium levels sit.
A sustained move above 4,022 could open the path to 4,063.
Bias: Bullish short-term
Invalidation: Below 3,959
Patience | Discipline | Edge — Words of Swizr
#XAUUSD #Gold #Liquidity #MarketStructure #SwizrTrading #SmartMoneyConcepts #Forex

Gold $4,000 in sight ahead of FOMC minutesGold smashed through to new all-time highs as fundamental catalysts aligned with a technical breakout. Let's break down the historic rally and critical levels ahead.
🚀 Historic Rally Drivers
Government Shutdown Impact : Week 2 of US shutdown delays jobs data, Fed flies blind into Oct 29 meeting
Fed Rate Cut Certainty : 95% odds October cut, 85% December follow-up as dollar weakness accelerates
Safe Haven Surge : Goldman warns $5,000 possible if Treasury flows shift to gold amid Fed independence threats
Technical Breakout: 48% YTD gain (strongest since 1979), ascending channel violation confirms new cycle but rejection could trigger short-term pullback
📊 Technical Analysis
Current Price : $3,950 (new ATH), RSI 70 - overbought but momentum intact
Channel Proximity : Clean breakout above long-term ascending channel signals price discovery mode
Fibonacci Targets : $3,930 (78.6% extension) immediate, $4,000-$4,015 (100% extension) cycle targets confirmed
🎯 Critical Trading Levels
Resistance Zones : $3,950-$3,975, $4,000-$4,015 (psychological/Fibo)
Support Structure : $3,895 (double top support), $3,865 (Fibo extension), $3,800 (major psychological)
📅 Key Events This Week
Wednesday: FOMC minutes (dovish bias expected)
Thursday: Powell speech (rate cut guidance)
Ongoing: Shutdown impact on economic data flow
💹 Trading Scenarios
Bullish Continuation : Above $3,930, target $3,975 then $4,000+
Profit-Taking Risk : Watch for rejection at $3,950, support test at $3,895
Medium-term Breakout : Buy pullbacks to $3,850-$3,875, stops below $3,800
Gold enters a parabolic phase driven by monetary policy uncertainty and geopolitical risk. $4,000 becoming probability rather than possibility. October is historically the strongest month for precious metals, so trend acceleration is likely.
This content is not directed to residents of the EU or UK. Any opinions, news, research, analyses, prices or other information contained on this website is provided as general market commentary and does not constitute investment advice. ThinkMarkets will not accept liability for any loss or damage including, without limitation, to any loss of profit which may arise directly or indirectly from use of or reliance on such information.

The short-term adjustment of gold is for a better rise
News:
During the Asia-Europe session on Wednesday, spot gold hit a bottom and rebounded. Affected by the ceasefire agreement signed by Hamas in Gaza, it fell nearly 1% during the session, and then rebounded sharply. It is currently down 0.07%, and its price is stable above the historical high of US$4,000 per ounce.
Gold smells a familiar smell of sweeping here, which is in line with our expectations. According to the signal strategy given yesterday, if the price reaches 4020-4025, enter the long position and you can make a profit now.
Specifically:
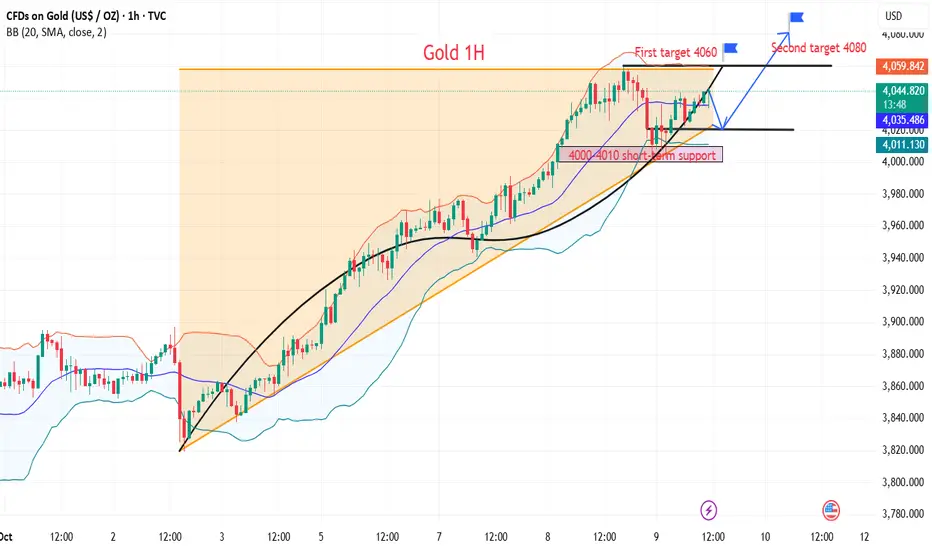
The bullish momentum has not been broken. The upper double-line support on the hourly chart, along with the channel line, serves as a defensive dividing line.
This rally, which began at 3280 in August, accelerated in September and doubled in October, with a nearly $780 surge, setting a new record and reshaping market perception.
The two closest waves, one at 3720 and the other at 3820, sought support for further gains.
The upper double-line support on the hourly chart is currently between 4000 and 4010, tentatively serving as the dividing line for any shifts in momentum. Holding the upper double-line support level will ensure the overall bullish momentum remains unchanged, and any short-term pullbacks and accelerations are intended to facilitate a stronger rally.
Strategy:
Long Position4020-4030,SL:4010,Target:4060,4080
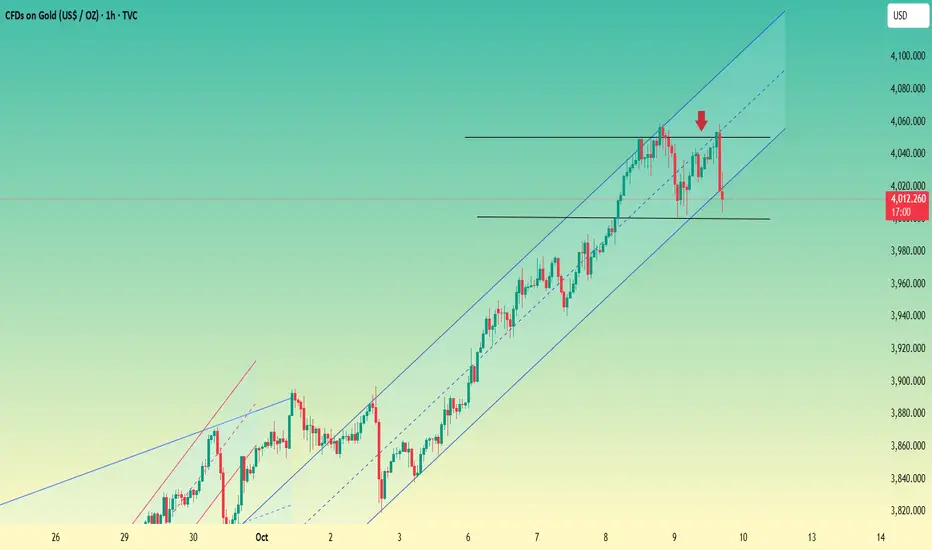
Gold rebound is still a good opportunity to short!Judging from the current trend, gold was affected by the easing of geopolitical situation, and the risk aversion sentiment temporarily receded. After falling below the 4000 mark, it quickly extended to around 3944. The daily line closed with a medium-sized negative line, almost completely engulfing the previous day's gains. The short-term indicators formed a death cross at a high level, and the momentum weakened significantly. The focus of the day is on the gains and losses of the 4000 mark, which is also the key position for the recent top and bottom conversion. In the 4-hour cycle, the price rose and fell again and closed lower. The big negative line broke through the middle track support. The previous strong unilateral bullish pattern was broken and the market entered a pullback correction stage. Therefore, it is expected that there will be room for repeated adjustments today. The upper pressure focuses on the 3980-3995 area, and the lower short-term support focuses on the 3945-3940 area. If it stabilizes and does not break, you can consider trying to go long on gold with a light position. If it breaks further, pay attention to the bullish defense zone in the 3930-3920 area, and then consider going long on gold. In terms of overall operations, maintain the idea of main short and auxiliary long, wait for the key point confirmation signal, enter the market steadily, strictly control the risk, and execution is still the key to profitability.

XAUUSD | Sustainable Price Rise: Where’s the Next Optimal Entry?Hello TradingView community! 🚀
Gold (XAU/USD) is in an extremely sustainable upward structure. Instead of lengthy analysis, let's dive straight into the action plan: Where is the optimal entry point and what target is Gold aiming for? Check out the details below.
1. Market Structure Analysis: The Strength of the Bulls 🐂
Looking at the chart, the first thing that catches our eye is a series of "BoS" points (Break of Structure).
Every time Gold breaks a previous peak, it not only creates a Higher High but also confirms that the uptrend is very strong and sustainable. This indicates that buying power is completely dominant and shows no signs of weakening. Smart Money is continuously pushing the price higher, and our job is to ride this "wave."
2. Potential Buying Zones - Where to Catch the Wave? 🧐
To optimize profits and minimize risks, finding a beautiful entry point after a price correction is crucial. Based on the chart, we have 2 notable potential buying zones:
Buying Zone 1 - Fibonacci Confluence ($3885): This is an extremely ideal "Buy Zone," coinciding with the golden Fibonacci ratio of 0.618. In technical analysis, this is a very strong support level where prices tend to reverse and continue the main trend. Professional traders always hunt for pullbacks to this zone.
Buying Zone 2 - Exploiting FVG ($3914 - $3933): Slightly higher, we have the FVG (Fair Value Gap) area at $3914 and the "Buy Scalping" zone at $3933. These are "price gaps" created by supply-demand imbalances when prices rise too quickly. The market tends to return to fill these gaps before continuing its journey. This could be an opportunity for those wanting to catch an earlier wave.
3. Conquest Target - What's Gold's Next Destination? 🎯
Once we have a buying position, where will our target be?
Short-term target: The "Sell Scalping FVG" zone around $3969 could be a minor resistance point where some traders will take profits.
Main target: The ultimate destination this structure is aiming for is the "Sell Gold Liquidity" zone at $3998. This is a critical "liquidity" area, concentrating many stop-loss orders from the Sellers. Prices are often attracted to these zones like a "magnet" to sweep liquidity before making further moves.
Summary & Advice
Main trend: UP.
Primary strategy: Buy on dip when prices correct to key support zones.
Potential buying zones: $3885 (Fibonacci) and $3914 - $3933 (FVG).
Price targets: $3969 (short-term) and $3998 (main target).
Always remember, risk management is the key to surviving in the market. Set reasonable Stop-loss for every trade.
WHAT DO YOU THINK ABOUT THIS PLAN?
Will Gold retrace to the Fibonacci zone $3885 or react right at the FVG zone $3914? Leave your thoughts and perspectives in the comments below. Let's discuss together to find the best opportunities!
👇 Don't forget to Like 👍 and Follow my TradingView channel to not miss daily Gold analysis!

XAUUSD 1H Technical & Fundamental Update📊 XAUUSD 1H Technical & Fundamental Update
🟡 Fundamental Outlook:
Gold remains supported as investors seek safe-haven assets amid ongoing geopolitical tensions and a weaker USD outlook. Recent economic data also suggests potential monetary easing from major central banks, which could further strengthen demand for Gold.
📈 Technical Outlook:
On the 1-hour chart, Gold declined after forming a double top around the $4,000 area, with price retracing down to a major key support at $3,950.
After retesting this key support, price rebounded and reached a minor key resistance at $3,970, where accumulation began. A doji hammer formed at the top of this zone, followed by a bullish engulfing candle, signaling potential continuation to the upside.
After a liquidity grab within the current liquidity zone, our point of interest (POI) lies at $3,974.770.
📌 Trading Plan (DTF Bias – Bullish)
Entry: 3,974.770
Stop Loss: 3,960.000 (within liquidity zone)
Take Profit: 4,021.200 (next potential minor key resistance)
This setup aligns both fundamental strength and technical confirmation, favoring a bullish continuation on Gold.
📌 Disclaimer: This is not financial advice. Always wait for proper confirmation before executing trades. Manage your risk wisely and trade what you see—not what you feel.

Long position: xau/usd 08.10.25 / 2.36pm
- This was a great position taken today from our community!! executed perfectly and all TP smashed!!
- We keep it simple using volume build up, order blocks and FVG. This trade was perfect in terms of a basic set up. But this is all we need DO NOT over complicate trading!! its doing the simple things consistently over and over again....
- Feel free to apply we are accepting applications to our company at the moment and I have seen quality trades on here. DO NOT hesitate!!! take this opportunity with both hands.

Monday's US gold market focus on short-term adjustmentsOn Friday, we emphasized the importance of the daily close. Gold's late-day rally on Friday disrupted the previous downward trend following the engulfing high. Instead, it continues to fluctuate along its short-term moving average, maintaining a relatively strong trend on the daily chart. On the 4-hour chart, gold has broken through the previous resistance band, and the K-line continues to maintain a relatively stable upward trend along the short-term moving average. In the short term, watch for a second upward pull after a pullback. On the hourly chart, after a series of small upward movements, the price is currently fluctuating in a narrow range at a high level. The current divergence in the short-term chart suggests that there may be room for adjustment in the short term. Keep an eye on this short-term correction.

Sell gold!- Completed " 1234 " Impulsive Waves
- Break of Structure
- Change of Characteristics
- Fair Value Gap
- Bullish Channel as an corrective pattern in Short Time Frame
