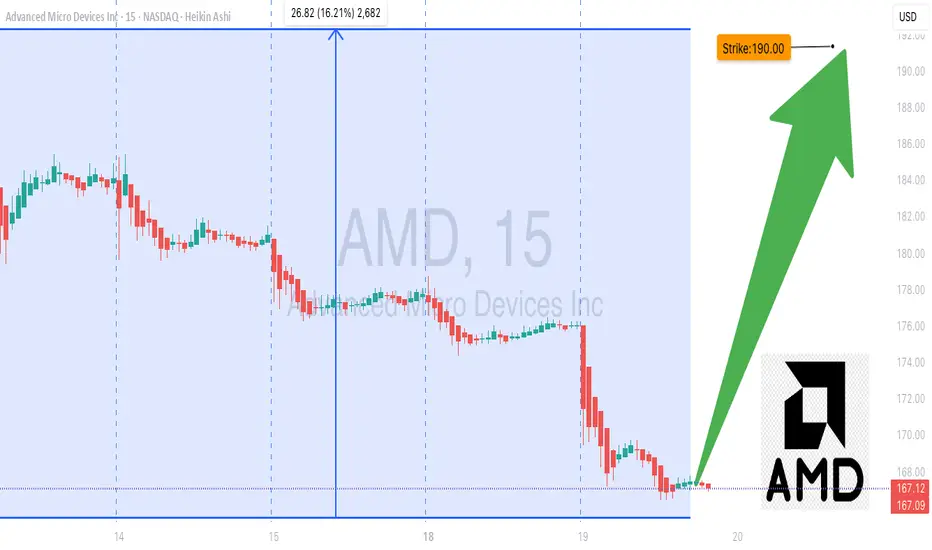
AMD Options Alert: $190 Call Ready to Pop!
# 🚀 AMD Weekly Options Analysis (Aug 19, 2025) 🚀
### **Market Snapshot**
📊 **Daily RSI:** 56.3 ⬇️ (Neutral)
📈 **Weekly RSI:** 85.1 ⬇️ (Potential Reversal ⚠️)
📉 **Volume:** Weak institutional activity (0.6x last week)
🔥 **Options Flow:** Call/Put ratio 1.21 → Moderate Bullish
✅ **Volatility:** Favorable (VIX < 15)
💡 **Overall Bias:** Moderate Weekly Bullish
---
### **Model Breakdown**
| Report | Trend | Volume | Options Flow | Bias |
| -------------------- | ------------------ | ------- | ------------ | ------------------- |
| **Grok/xAI** | NEUTRAL | WEAK 📉 | BULLISH 🔥 | Moderate Bullish 👍 |
| **Gemini/Google** | NEUTRAL/Bearish ⚠️ | WEAK 📉 | BULLISH 🔥 | Neutral/Bearish 🤔 |
| **Claude/Anthropic** | NEUTRAL/Bearish ⚠️ | WEAK 📉 | BULLISH 🔥 | Moderate Bearish 👎 |
| **Llama/Meta** | NEUTRAL ⚠️ | WEAK 📉 | BULLISH 🔥 | Moderate Bullish 👍 |
| **DeepSeek** | NEUTRAL ⚠️ | WEAK 📉 | BULLISH 🔥 | NEUTRAL 🤷 |
✅ **Consensus:**
* Weak volume = concern 🚨
* Low VIX = favorable for options 💎
* RSI signals mixed; overbought caution ⚠️
---
### **💥 Trade Recommendation 💥**
**Strategy:** Cautious Naked Call
* 🎯 **Instrument:** AMD
* 💰 **Strike:** \$190
* 🗓️ **Expiry:** Aug 22, 2025
* 💵 **Entry Price:** \$0.70
* 🎯 **Profit Target:** \$1.05 (50%)
* 🛑 **Stop Loss:** \$0.35
* ⏰ **Entry Timing:** Market Open
* 📈 **Confidence:** 65%
⚠️ **Key Risks:**
* ⏳ Accelerated time decay (3-day expiry)
* 📉 Weak volume may trigger profit-taking
---
### **Trade JSON**
```json
{
"instrument": "AMD",
"direction": "call",
"strike": 190.00,
"expiry": "2025-08-22",
"confidence": 0.65,
"profit_target": 1.05,
"stop_loss": 0.35,
"size": 1,
"entry_price": 0.70,
"entry_timing": "open",
"signal_publish_time": "2025-08-19 09:51:08 UTC-04:00"
}
AMD trade ideas
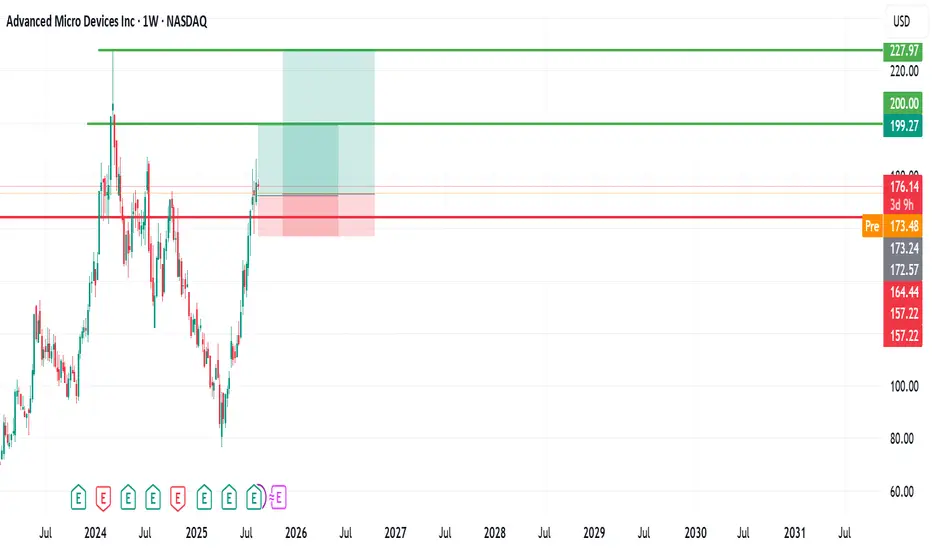
Advanced Micro Devices (AMD) Stock Analysis. My buyAdvanced Micro Devices (AMD) Stock Analysis
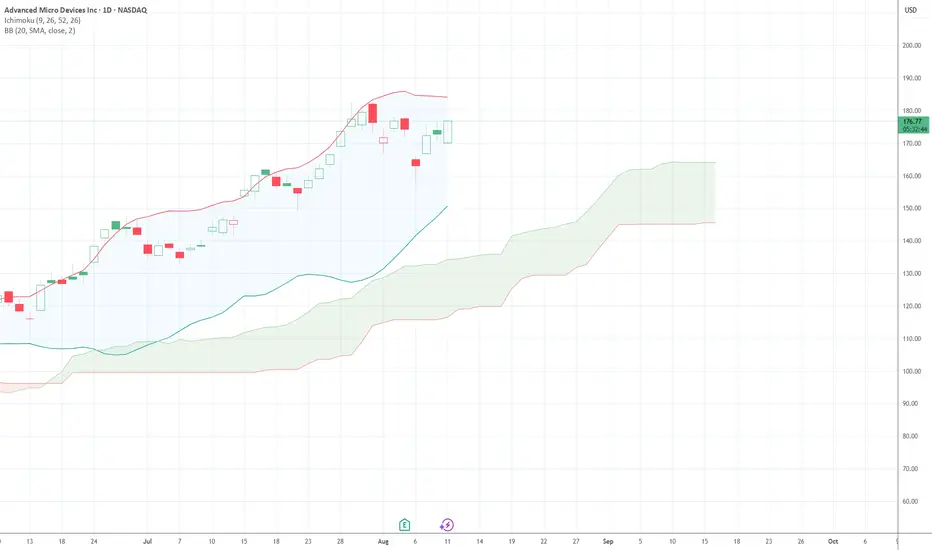
AMD, listed on NASDAQ, has generally been on an upward trend. However, the last 2 weeks, the stock experienced a brief flash downturn, dropping to around the $157 level and witnessed a good recovery last week, reaching $186 zone.
Since then, it has pulled back and is currently trading at approximately $176 share.
Outlook:
I remain bullish on AMD with entries from $176 - $172 and anticipate a potential move toward the $200 level, with a longer-term target around its all-time high near $226.
For my entry strategy, I am adding positions at different levels, with an initial entry around $176 and another if it drops further
Position (s) are for a mid- to long-term hold.
Let’s see how it unfolds! If you have any insights or thoughts, please share them in the comments. I’d love to connect with you. Don’t forget to follow, share, and subscribe. Thank you.
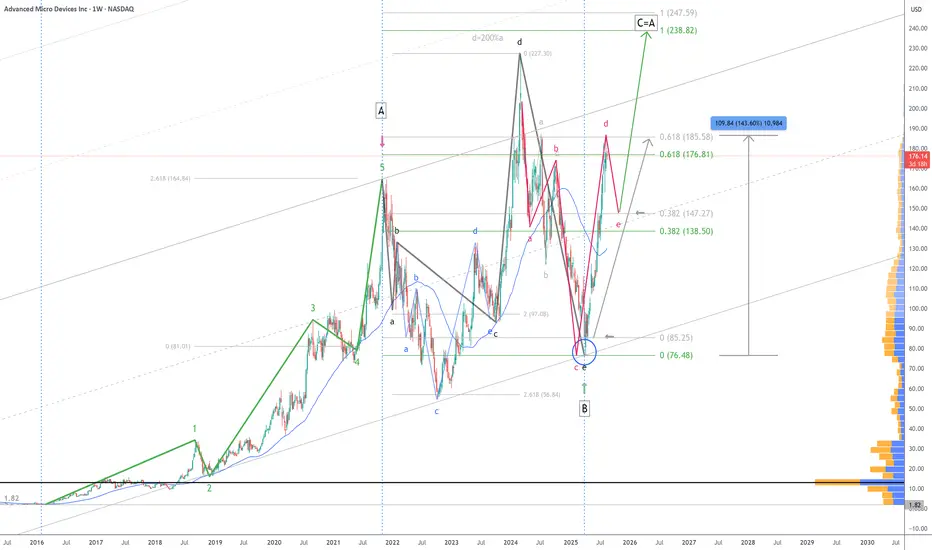
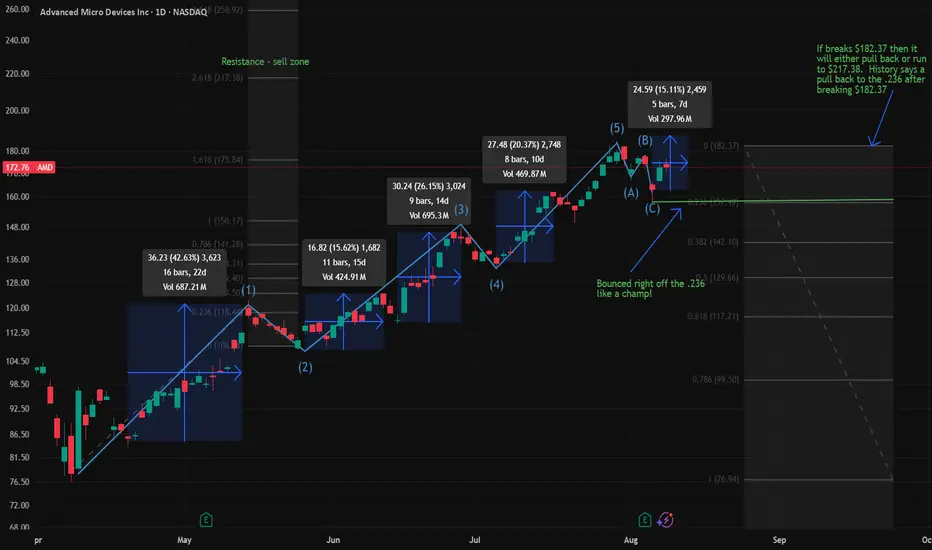
$AMD Analysis: Perfect Hit & One of Many Scenarios! 8/18/2025NASDAQ:AMD hits the 61.8% target of major wave A - up nearly 144% gain in 3 months! 👌
📈 A pause near $148 could complete the red NT (abcde) structure before a potential continuation toward C=A target at $236 or $247
One of many paths... let’s see how it unfolds!
Cheers!
#ElliottWave #AMD #TechnicalAnalysis
AMD Ready to Break Higher – $190 Calls Flashing Opportunity!
# 🚀 AMD Weekly Options Analysis (2025-08-17) – Don’t Miss Out!
### 🔎 Market Overview
AMD’s weekly options landscape shows **strong bullish sentiment**: high call volume and supportive sentiment suggest traders expect upward movement, though some caution arises from declining short-term indicators.
---
### 📊 Key Model Insights
* **Call/Put Ratio:** 2.03 → strong bullish flow
* **Weekly RSI:** 87.8 → extremely bullish momentum
* **Daily RSI:** 59.1 → short-term downward trend, caution advised
* **Volume:** 0.8x last week → declining institutional participation
* **Gamma Risk:** Low → favorable for entering near-term options
---
### 📌 Agreement & Disagreement
* **Agreement:** All models confirm **moderate-to-strong bullish sentiment** due to options flow and low VIX environment.
* **Disagreement:** Some models flag **weak volume**, raising caution, while others remain confident in ongoing bullish trends.
---
### 📊 Recommended Trade
* **Direction:** CALL (Long)
* **Strike:** \$190.00
* **Expiry:** 2025-08-22
* **Entry Price:** \$0.70 (midpoint)
* **Stop Loss:** \$0.35 (50% of premium)
* **Profit Target:** \$1.40 (100% gain)
* **Entry Timing:** Market Open
* **Confidence:** 65%
---
### ⚠️ Key Risks
* Weak volume → reduced institutional conviction
* Declining daily RSI → potential short-term reversals
* Monitor news/events → can affect volatility or price
---
📊 **TRADE DETAILS JSON**
```json
{
"instrument": "AMD",
"direction": "call",
"strike": 190.00,
"expiry": "2025-08-22",
"confidence": 0.65,
"profit_target": 1.40,
"stop_loss": 0.35,
"size": 1,
"entry_price": 0.70,
"entry_timing": "open",
"signal_publish_time": "2025-08-17 09:30:00 EDT"
}
``

AMD One-Day Call Opportunity – Quick Gains Ahead!🚀 AMD \$185 Call – One-Day Bullish Sprint
**Sentiment:** 🟢 *Strong Short-Term Bullish*
* **Daily RSI:** 64.2 📈
* **Weekly RSI:** 88.4 📈
* **Call/Put Volume:** Favoring calls strongly
* **Volume:** Weak (0.8× last week) → watch for support
* **Gamma Risk:** HIGH ⚡ — 1-day expiry
---
### 📊 **Consensus Snapshot**
✅ Majority of models: bullish momentum
⚠️ Weak volume + high gamma → strict risk management required
💡 Entry timing and discipline are critical
---
### 🎯 **Trade Setup**
* **Type:** CALL (Single-leg)
* **Strike:** \$185.00
* **Expiry:** 2025-08-15
* **Entry:** \$2.61 (mid-market)
* **Profit Target:** \$3.90 (+50%)
* **Stop Loss:** \$1.30 (–50%)
* **Confidence:** 70%
* **Trade Size:** 1 contract
* **Entry Timing:** Market open
---
💬 *High-momentum, short-term expiry play — monitor volume and be ready to exit quickly.*
📌 *Not financial advice. DYOR.*
---
**#AMD #OptionsTrading #CallOptions #DayTrading #StocksToWatch #GammaRisk #OptionsFlow #TradingSignals**

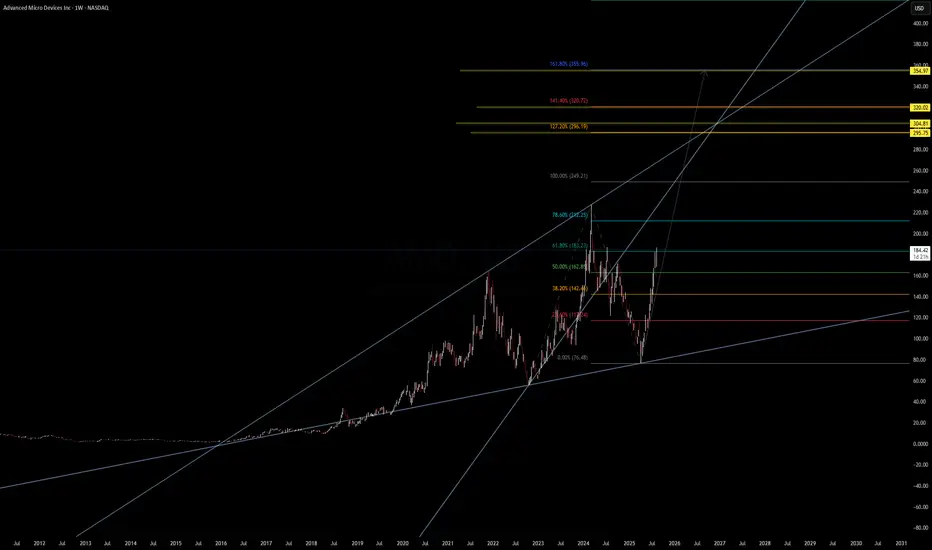
AMD | Weekly Macro Structure – Eyeing Major Fib Extensions AMD | Weekly Macro Structure – Eyeing Major Fib Extensions 🚀
AMD has broken above the 61.8% retracement ($183.23) from its previous cycle and is pushing toward the 78.6% zone ($212.25). This breakout from the mid-channel region signals strong bullish momentum with clean room toward upper Fibonacci extensions.
Key Levels:
Fib Retracements:
61.8% – $183.23 ✅ (broken)
78.6% – $212.25 (next resistance)
Fib Extensions:
127.2% – $296.19
141.4% – $320.02
161.8% – $355.96
200% – $421.94
227.2% – $486.92
Trend Structure:
Long-term ascending channel intact since 2018.
Recent bounce from macro trendline near $76 set a higher low.
Breakout path projects a potential test of $300+ in the mid-term if momentum holds.
Macro & Catalysts:
AI/data center growth remains a key revenue driver, though export restrictions to China could slow short-term upside.
Positive sentiment from recent product launches and strong PC chip recovery.
Watch For:
Pullback retest of $183 support before continuation.
Weekly close above $212 for momentum confirmation toward $250–$320.
📊 Not financial advice. Chart for educational purposes.
AMD: Correct ABC Wave ComingAMD is in its final wave up and expected to reach $190 by the EOW. From there, I am expecting heavy selling volume to begin sometime next week. The A wave of the ABC correction will likely bring AMD down to $163-160 range by as early as next week.


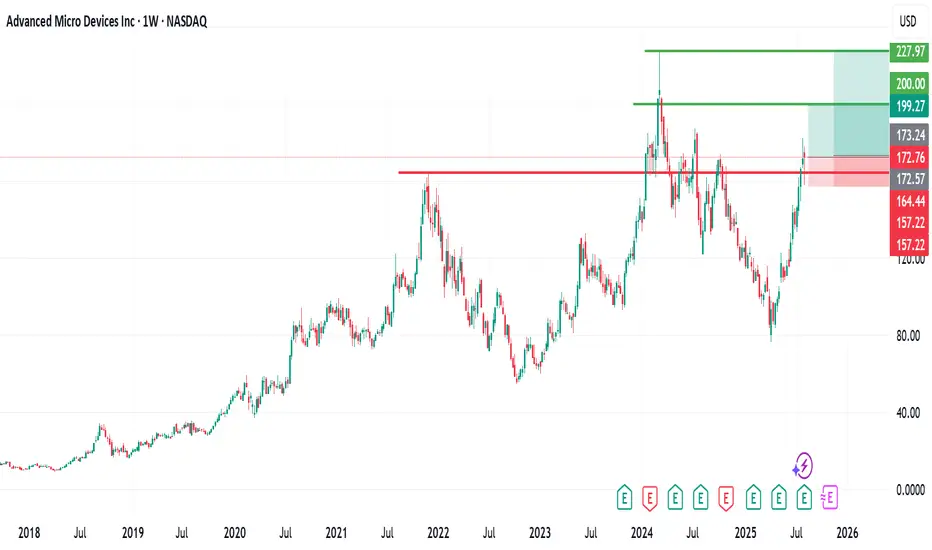
Amd - New all time highs will follow!🪠Amd ( NASDAQ:AMD ) rallies even much further:
🔎Analysis summary:
After Amd perfectly retested a major confluence of support a couple of months ago, we saw a textbook reversal. This retest was followed by a rally of more than +100% in a short period of time. But considering all the bullish momentum, Amd is far from creating a top formation.
📝Levels to watch:
$200
SwingTraderPhil
SwingTrading.Simplified. | Investing.Simplified. | #LONGTERMVISION

AMD Calls Flying Off the Shelves — Don’t Miss Out!🚀 AMD Weekly Options Alert (Aug 12, 2025)**
**Bias:** 🔥 **BULLISH** — Strong flow, high RSI, institutional backing
📊 **Quick Stats:**
* **Call/Put Ratio:** 2.31 → heavy call buying 📈
* **Daily RSI:** 60.4 ✅ bullish momentum
* **Weekly RSI:** 87.1 🚀 extreme strength
* **Volume:** 1.1× last week — institutional participation confirmed
* **VIX:** 15.0 → low volatility, stable premiums
* **DTE:** 3 | **Gamma Risk:** Moderate | **Time Decay:** Accelerating
💡 **Trade Setup:**
* **Type:** Naked CALL
* **Strike:** \$182.50
* **Expiry:** Aug 15, 2025
* **Entry:** \$0.69
* **PT:** \$1.38 (+100%)
* **SL:** \$0.34
* **Confidence:** 80%
⚠ **Risks:**
* 3 DTE = fast-moving gamma swings
* Semiconductor sector news could shift momentum
* RSI high — watch for intraday pullbacks
---
**📈 TL;DR:**
High RSI + bullish flow + strong volume = momentum play. Manage gamma risk, aim for quick profit.
\#AMD #OptionsTrading #CallOptions #WeeklyOptions #BullishBreakout #OptionsFlow #TradingSetup #TechnicalAnalysis #MomentumTrading #StockMarket #OptionsAlert

AMD: 172.28 Bullish Entry: 180.00/184.00 Stop 178.50 Target 182.00/184.00
Bearish Entry: 172.00/170.00 Stop 173.20 Target 170.00/168.00...double top zone at 182.00

AMD: 172.28 Bullish Entry: 180.00/184.00 Stop 178.50 Target 182.00/184.00
Bearish Entry: 172.00/170.00 Stop 173.20 Target 170.00/168.00...double top zone at 182.00

AMD stock up over 20% off the lows- outperform NVidia?AMD is still cheap relative to its growth and still way down from all time highs.
Seeking alpha analysts expect 25-30% annual growth in earnings yearly. The stock is still in the low 20s PE. Stock can double and still be a good business worth owning for the long term and let compounding earnings work.
Low rsi and bollinger bands gave us the signal to buy, we bought with leverage, now we are in the shares unlevered.
Target would be all time highs over the next 2-3 years.

$AMD Ready for a Push?AMD getting tight on the daily chart. We just had some news com in as well. Also it's strong the first hour. NASDAQ:AMD CONFIRMS IT RECIEVED CHINA 🇨🇳 AI CHIP EXPORT LICENSES
AMD LongOn the AMD 15-minute chart, the broader market structure has shifted from a recent downtrend, marked by a Lower High (LH) and Lower Low (LL) sequence, into a potential reversal phase. This transition was confirmed by a Change of Character (CHoCH) at 177.98, breaking above the prior LH. That move signals that sellers have lost some control, and buyers may now be positioning for a continuation upward if they can defend nearby support.
The nearest demand zone lies between 171.00–172.00, where buyers previously stepped in with strength, creating a sharp bounce. This makes it a strong short-term support area. Above, supply is positioned at 174.50–176.00, where price previously stalled and dropped, indicating active sellers. A more significant supply cap remains at 179.00–181.00, which caused a major rejection earlier in the month and stands as a strong resistance zone.
Within the marked region, price is hovering just above the 171s demand after failing to push through the mid-supply area. The current price action suggests a likely shallow pullback into the 171.50–172.00 demand to absorb liquidity before attempting another push toward the 176.00–178.00 range.
Trade bias: Bullish
Expected direction: Higher after a pullback into demand
Invalidation level: A close below 171.00 would weaken the bullish case and open the door for a deeper drop toward 168.00
Momentum condition: Slightly favors buyers, with higher lows forming despite supply pressure
Candle behavior: Short-bodied consolidation candles above demand, indicating absorption rather than aggressive selling

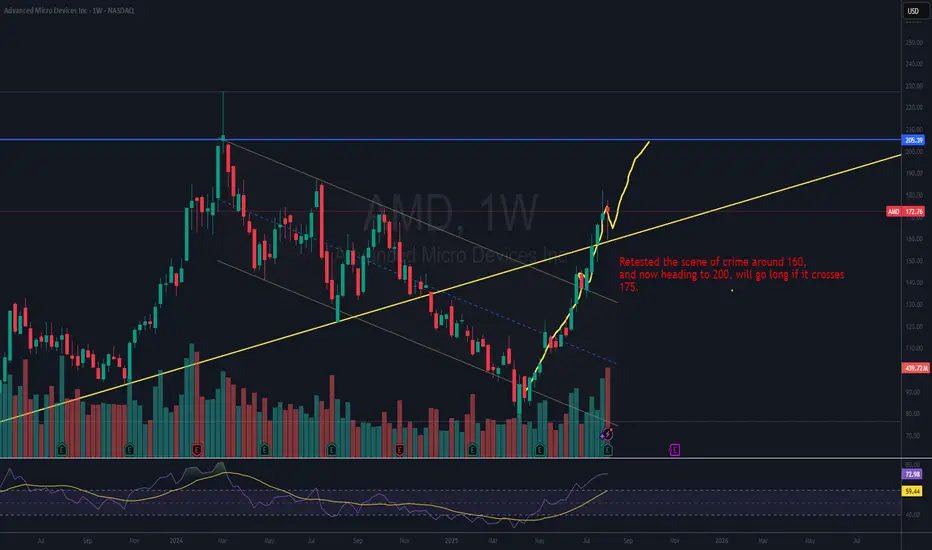
AMD Long for Aug 2025 Week2?Retested the scene of crime around 160,
and now heading to 200, will go long if it crosses
175.
Advanced Micro Devices (AMD) Stock AnalysisAdvanced Micro Devices (AMD) Stock Analysis
AMD, listed on NASDAQ, has generally been on an upward trend. However, last week, the stock experienced a brief flash downturn, dropping to around the $157 level.
Since then, it has recovered and is currently trading at approximately $172 per share.
Outlook:
I remain bullish on AMD and anticipate a potential move toward the $200 level, with a longer-term target around its all-time high near $226.
For my entry strategy, I have added positions at different levels, with an initial entry around $160 and another at the current level.
This gives me a total of three buy entries, positioning for a mid- to long-term hold.
Let’s see how it unfolds! If you have any insights or thoughts, please share them in the comments. I’d love to connect with you. Don’t forget to follow, share, and subscribe. Thank you.
AMD about to Burst?I've been trading calls on AMD for 3 months now and have made over $45k in profit. This is my latest chart to help others gain insight into what I'm seeing. Make sure you do your own research and any news about Tariffs or rates could easily change this outlook. Always to your own research.
AMD: 172.76 4:41PM 8/11/25 For mondayBullish Entry: 178.00 / 180.00 Bullish Stop: 176.00 Bullish Target: 180.00 / 182.00
Bearish Entry: 170.00 / 168.00 Bearish Stop: 172.00 Bearish Target: 168.00 / 166.00

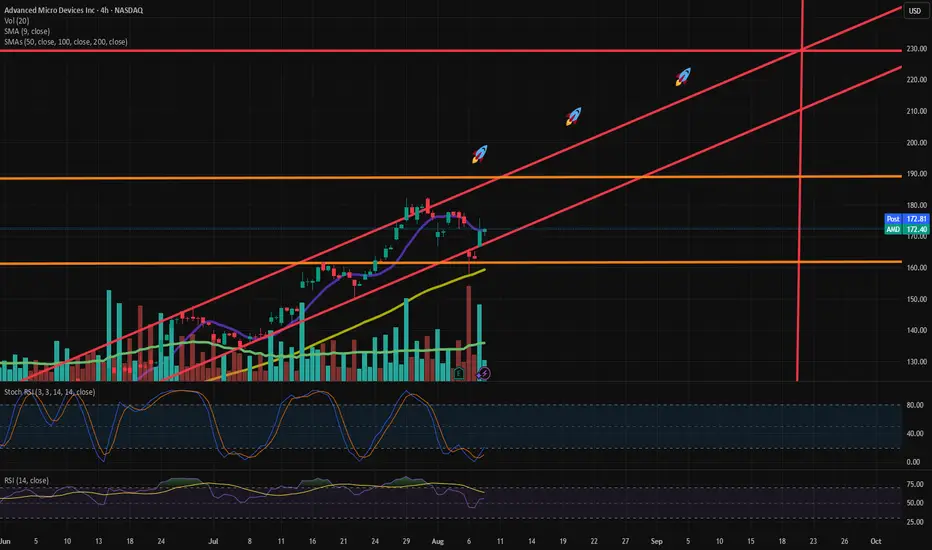
AMD Setup – Bullish Channel with Rocket Targets
Ticker: NASDAQ:AMD (Advanced Micro Devices)
Timeframe: 4H
Current Price: $129.40
Outlook: Bullish within ascending channel
🧠 Idea Summary:
AMD is trading within a well-respected ascending channel, and after a brief pullback, price is rebounding off the lower trendline support. With increased volume and momentum indicators turning up, I’m anticipating continuation to the upside — possibly targeting new highs.
📊 Technical Analysis:
🔴 Rising Channel:
The price is respecting both the upper and lower bounds of the ascending channel (highlighted in red).
Each bounce off the lower channel line has led to a strong upward move.
🟡 Support Zones:
$127.65 (9 EMA) and $117.87 (200 SMA) are serving as dynamic supports.
Horizontal support near $170 has also been tested and held.
🟠 Resistance Zones:
First major resistance at $187.75.
Further upside potential if price breaks above this level — targets align with the "rocket" icons within the channel.
📈 Volume Spike:
Strong green candle with high volume could signify institutional buying interest.
📉 Indicators:
Stoch RSI is turning upward from oversold territory.
RSI (14) is rising from 62, suggesting healthy bullish momentum.
🛫 Price Targets:
🎯 First Target: $173
🚀 Target 2: $187.75
🚀🚀 Target 3: $200+ if the channel holds and breakout occurs
🚀🚀🚀 Target 4: $230+ (aggressive bull case, upper channel extension)
⚠️ Risk Management:
A breakdown below the channel (~$127) with volume would invalidate this setup.
Use stop-loss below recent swing low (~$125) to manage risk.
📅 Key Dates:
Watch for potential catalysts in mid-to-late August (earnings, macro events, etc.)
🔔 Conclusion:
AMD is coiling for a potential breakout continuation. The structure is bullish, and the bounce off channel support with volume is a positive sign. A move above $173 could trigger a strong rally toward the $187-$200 range.
✅ Like if you find this helpful
💬 Drop your thoughts or setups in the comments!
📌 Follow for more trade setups
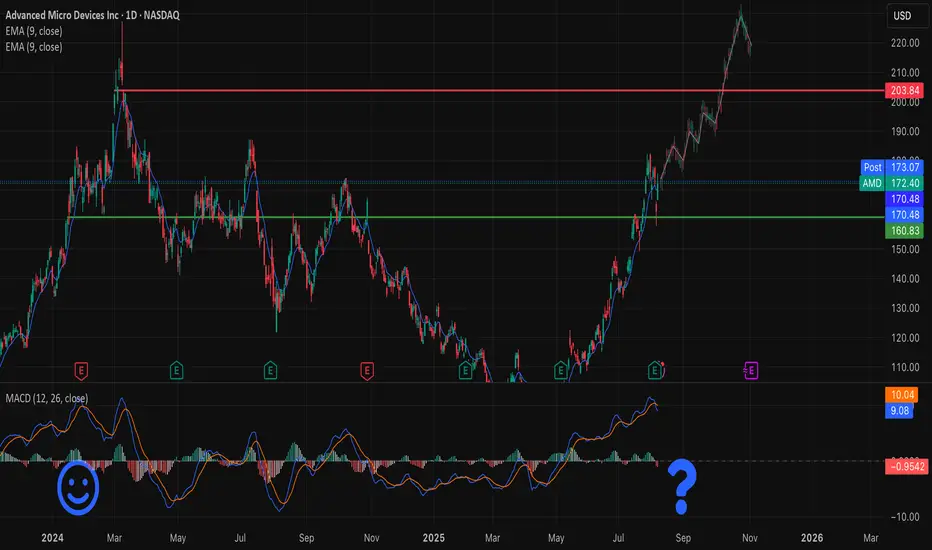
$AMD — Is history repeating itself?NASDAQ:AMD The chart is showing a pattern strikingly similar to previous highs — a strong rally after a long accumulation, followed by a pullback on news.
📰 Q2 2025 Earnings:
• Record revenue: $7.7B (+32% YoY)
• Strong sales in Ryzen CPUs and Radeon GPUs
• Q3 outlook: $8.7B revenue, ~54% margin
What’s holding it back:
• Export restrictions on MI308 to China hit margins and investor sentiment
• Short-term profit taking after a powerful rally
Reasons for optimism:
• Upcoming AI products MI350 and MI400 could be major growth drivers
• Expected demand from data centers and AI infrastructure
Technical view:
• EMA 9 remains above key support levels (170, 160)
• MACD is close to a potential bearish crossover — worth watching
• Past highs show that sharp corrections in AMD often set the stage for the next wave up
AMD Gamma Squeeze Potential?### 🚀 AMD Bulls or Trap? | \$175C Trade Setup Before Expiry!
**⚠️ High Gamma, Mixed Sentiment – Time-Sensitive Play**
📉 **Weekly RSI**: 70.4 (falling)
📈 **C/P Ratio**: 2.07 (bullish bias)
🔁 **Volume**: 1.2x weekly avg
📊 **Model Sentiment**:
* **Grok/xAI**: Bullish (Call accumulation 📈)
* **Claude/DeepSeek**: Bearish (Institutional selling 🚨)
* **Gemini**: Cautious Bearish
* **Llama**: Neutral / Wait & See
📌 **Suggested Trade**
🔵 **Call**: AMD \$175C (Aug 8 Exp.)
🎯 **Entry**: \$0.66
🛑 **Stop**: \$0.33
💰 **Target**: \$1.25
📆 **DTE**: 1
🔥 **Gamma Risk**: High – requires fast execution
🧠 **Confidence**: 65%
🧠 Watch for sharp moves. Mixed model sentiment = **great volatility** = **great opportunity** (with tight risk mgmt).
💬 *Would you take this trade?*
👇 Drop your thoughts in the comments!

AMD eyes on $178: Serious Resistance zone that may give a DIPAMD bouncing back from market wide dump last week.
Approaching a significant resistance at $177.79-178.59
Look for a Dip-to-Fib ideally to green at $163.30-163.61
